What is a SaaS company dashboard?
A SaaS dashboard visualizes the most important metrics related to a SaaS (Software as a Service) company’s overall performance. In particular, it covers data related to financial health, growth, customers and other areas of strategic importance.
Examples of a SaaS company dashboard
SaaS daily snapshot
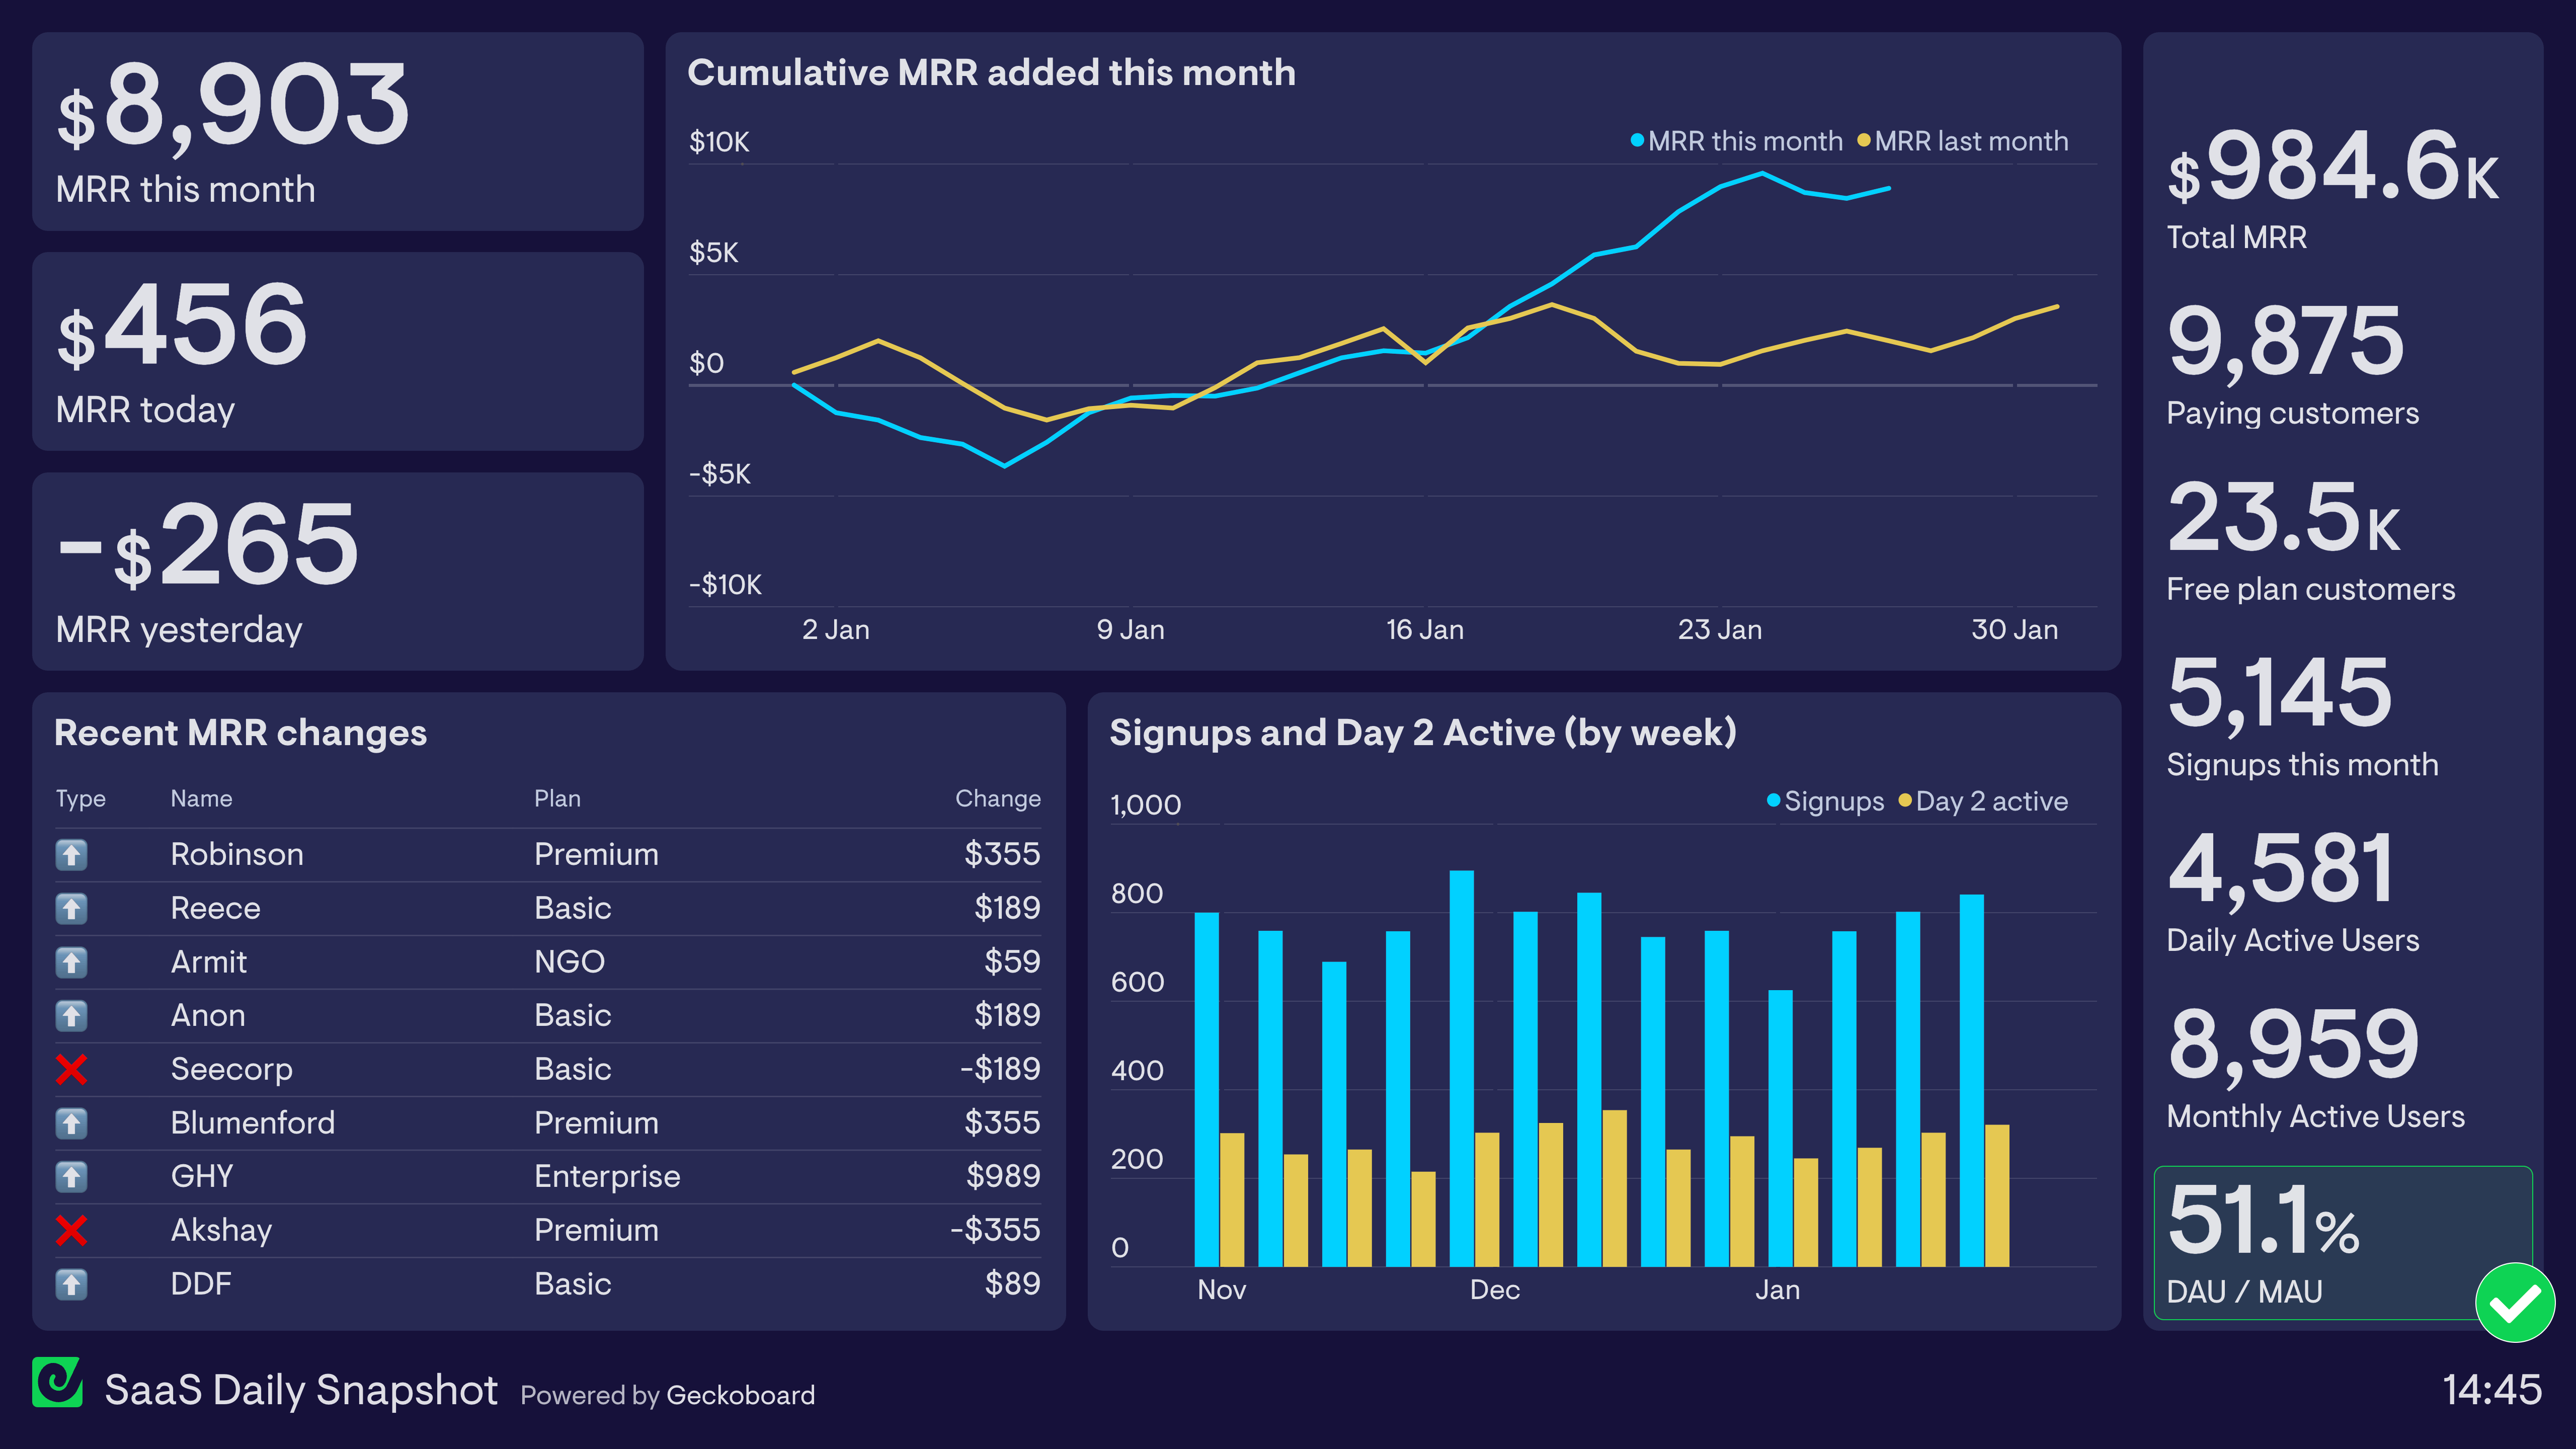
This SaaS dashboard is designed to give all employees a high-level overview of company performance, each day.
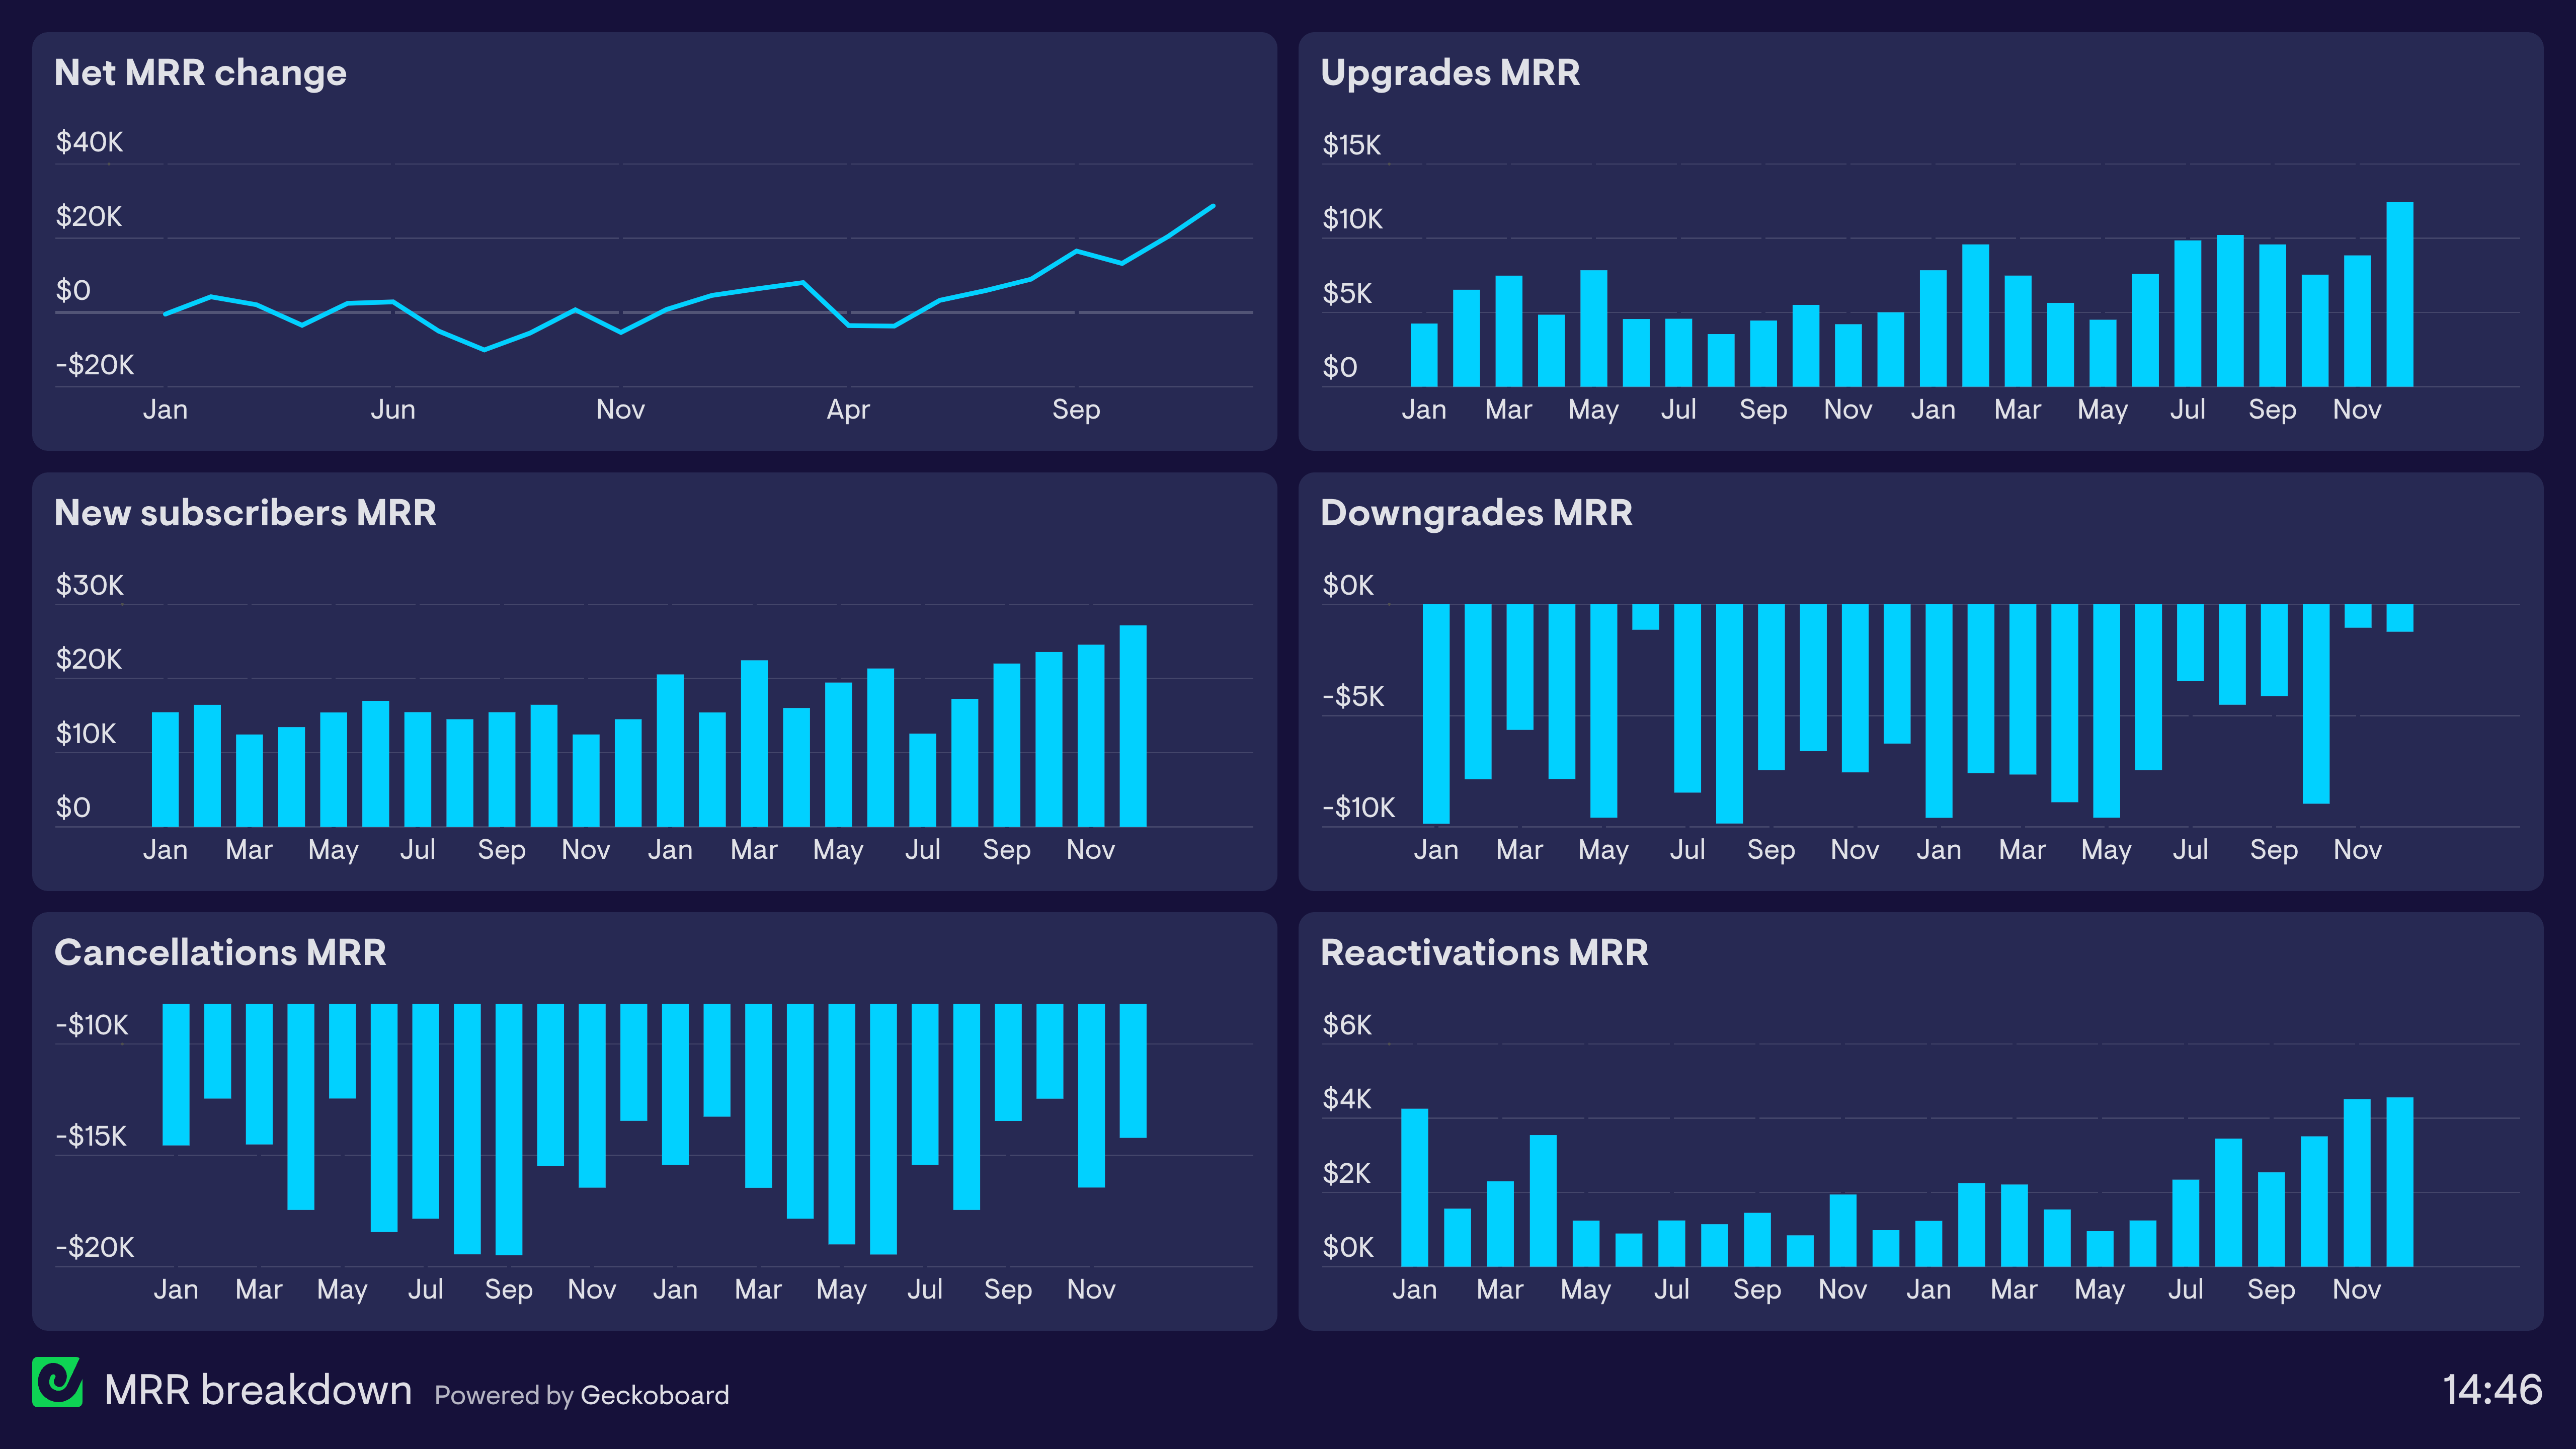
Chiefly, this dashboard focuses on MRR (Monthly Recurring Revenue). We can clearly see the amount of new MRR this month, as well as the overall MRR figure. Furthermore we can see more recent MRR changes. Even though you should expect natural variance in your MRR in the short term, these metrics are helpful because sometimes, sudden changes in MRR require further investigation (for example: a big customer churns, a payment page breaks, or there is a fault in ppc advertising.)
The other main focus of this dashboard is customers. Not only does this dashboard track potential new customers who are taking part in the free trial (signups), it also tracks the number of these trialists who are still active on Day 2. This metric helps us to understand if these new trialists are as engaged as previous customers, therefore helping us to qualify their potential.
Finally, we can see that this dashboard is also tracking DAU / MAU Ratio (Daily Active Users / Monthly Active Users) in order to see how active current customers are. A drop in DAU/MAU would indicate that customers are using the product less frequently and may be more likely to churn.
Focus area
Company growth and performance
Who looks at it?
Company owner, entire company
How often?
Every day
- MixpanelBaremetricsStripe for SaaSSQL Database
SaaS financial dashboard
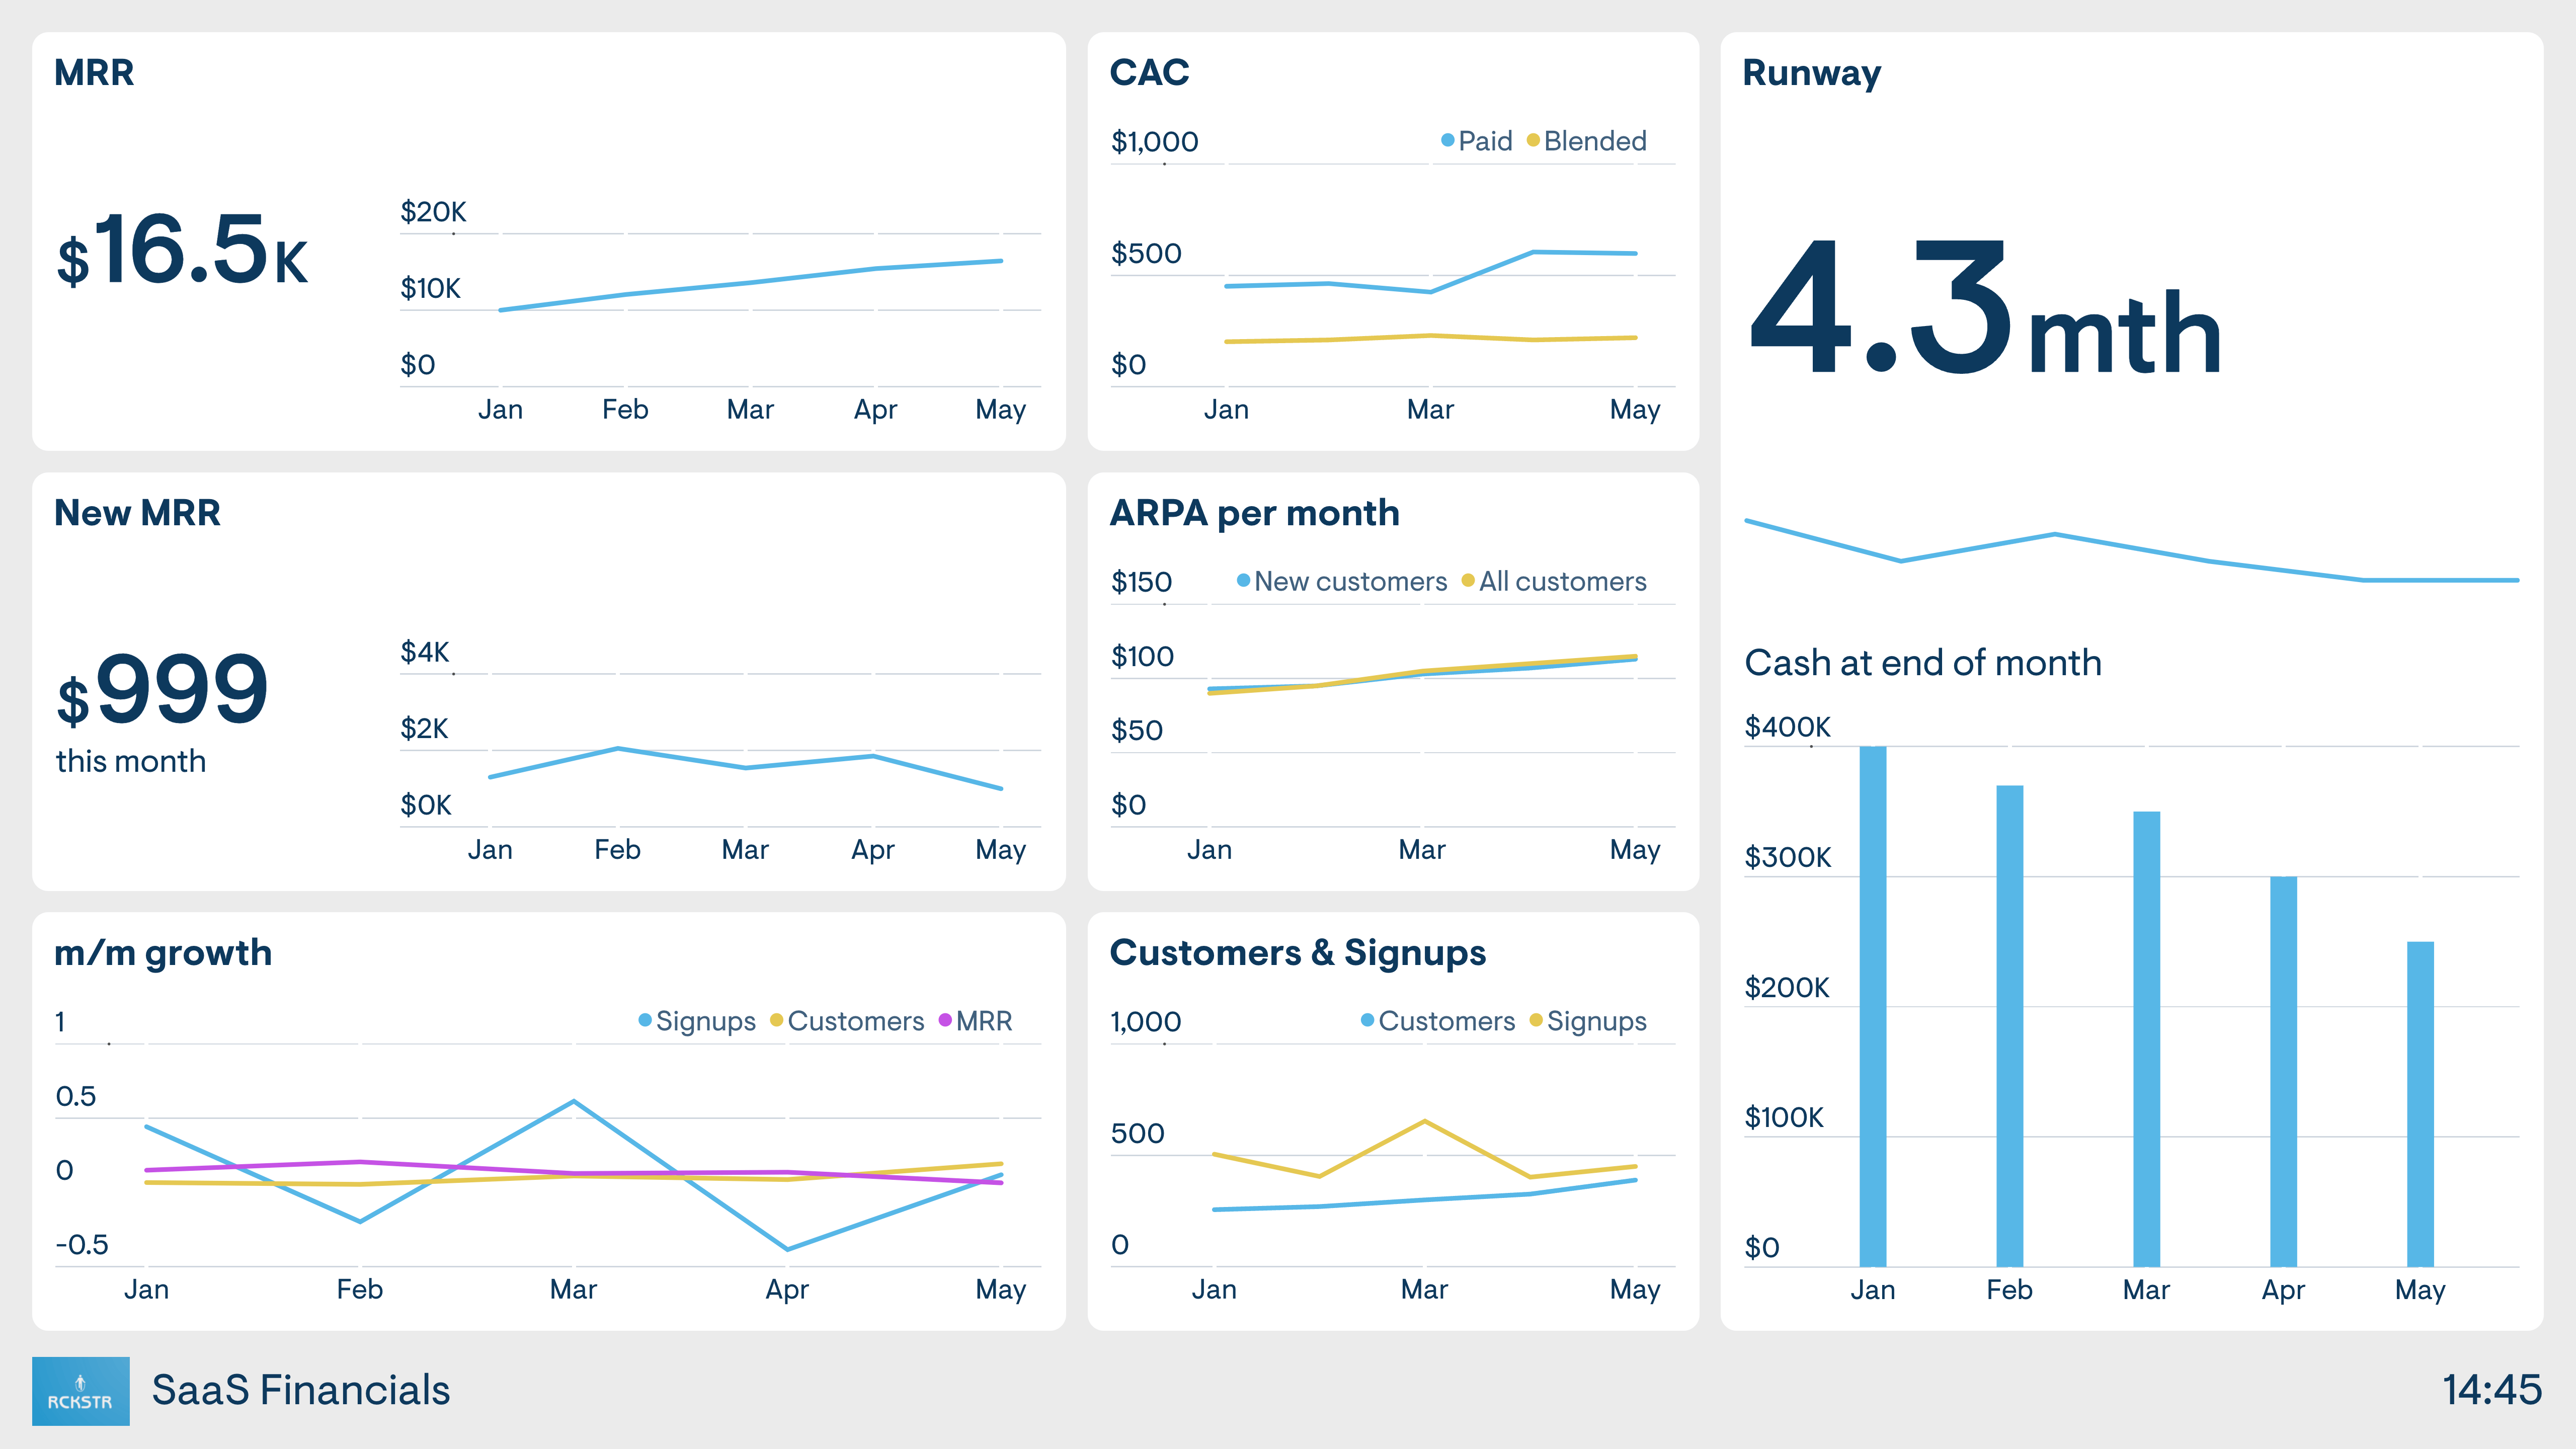
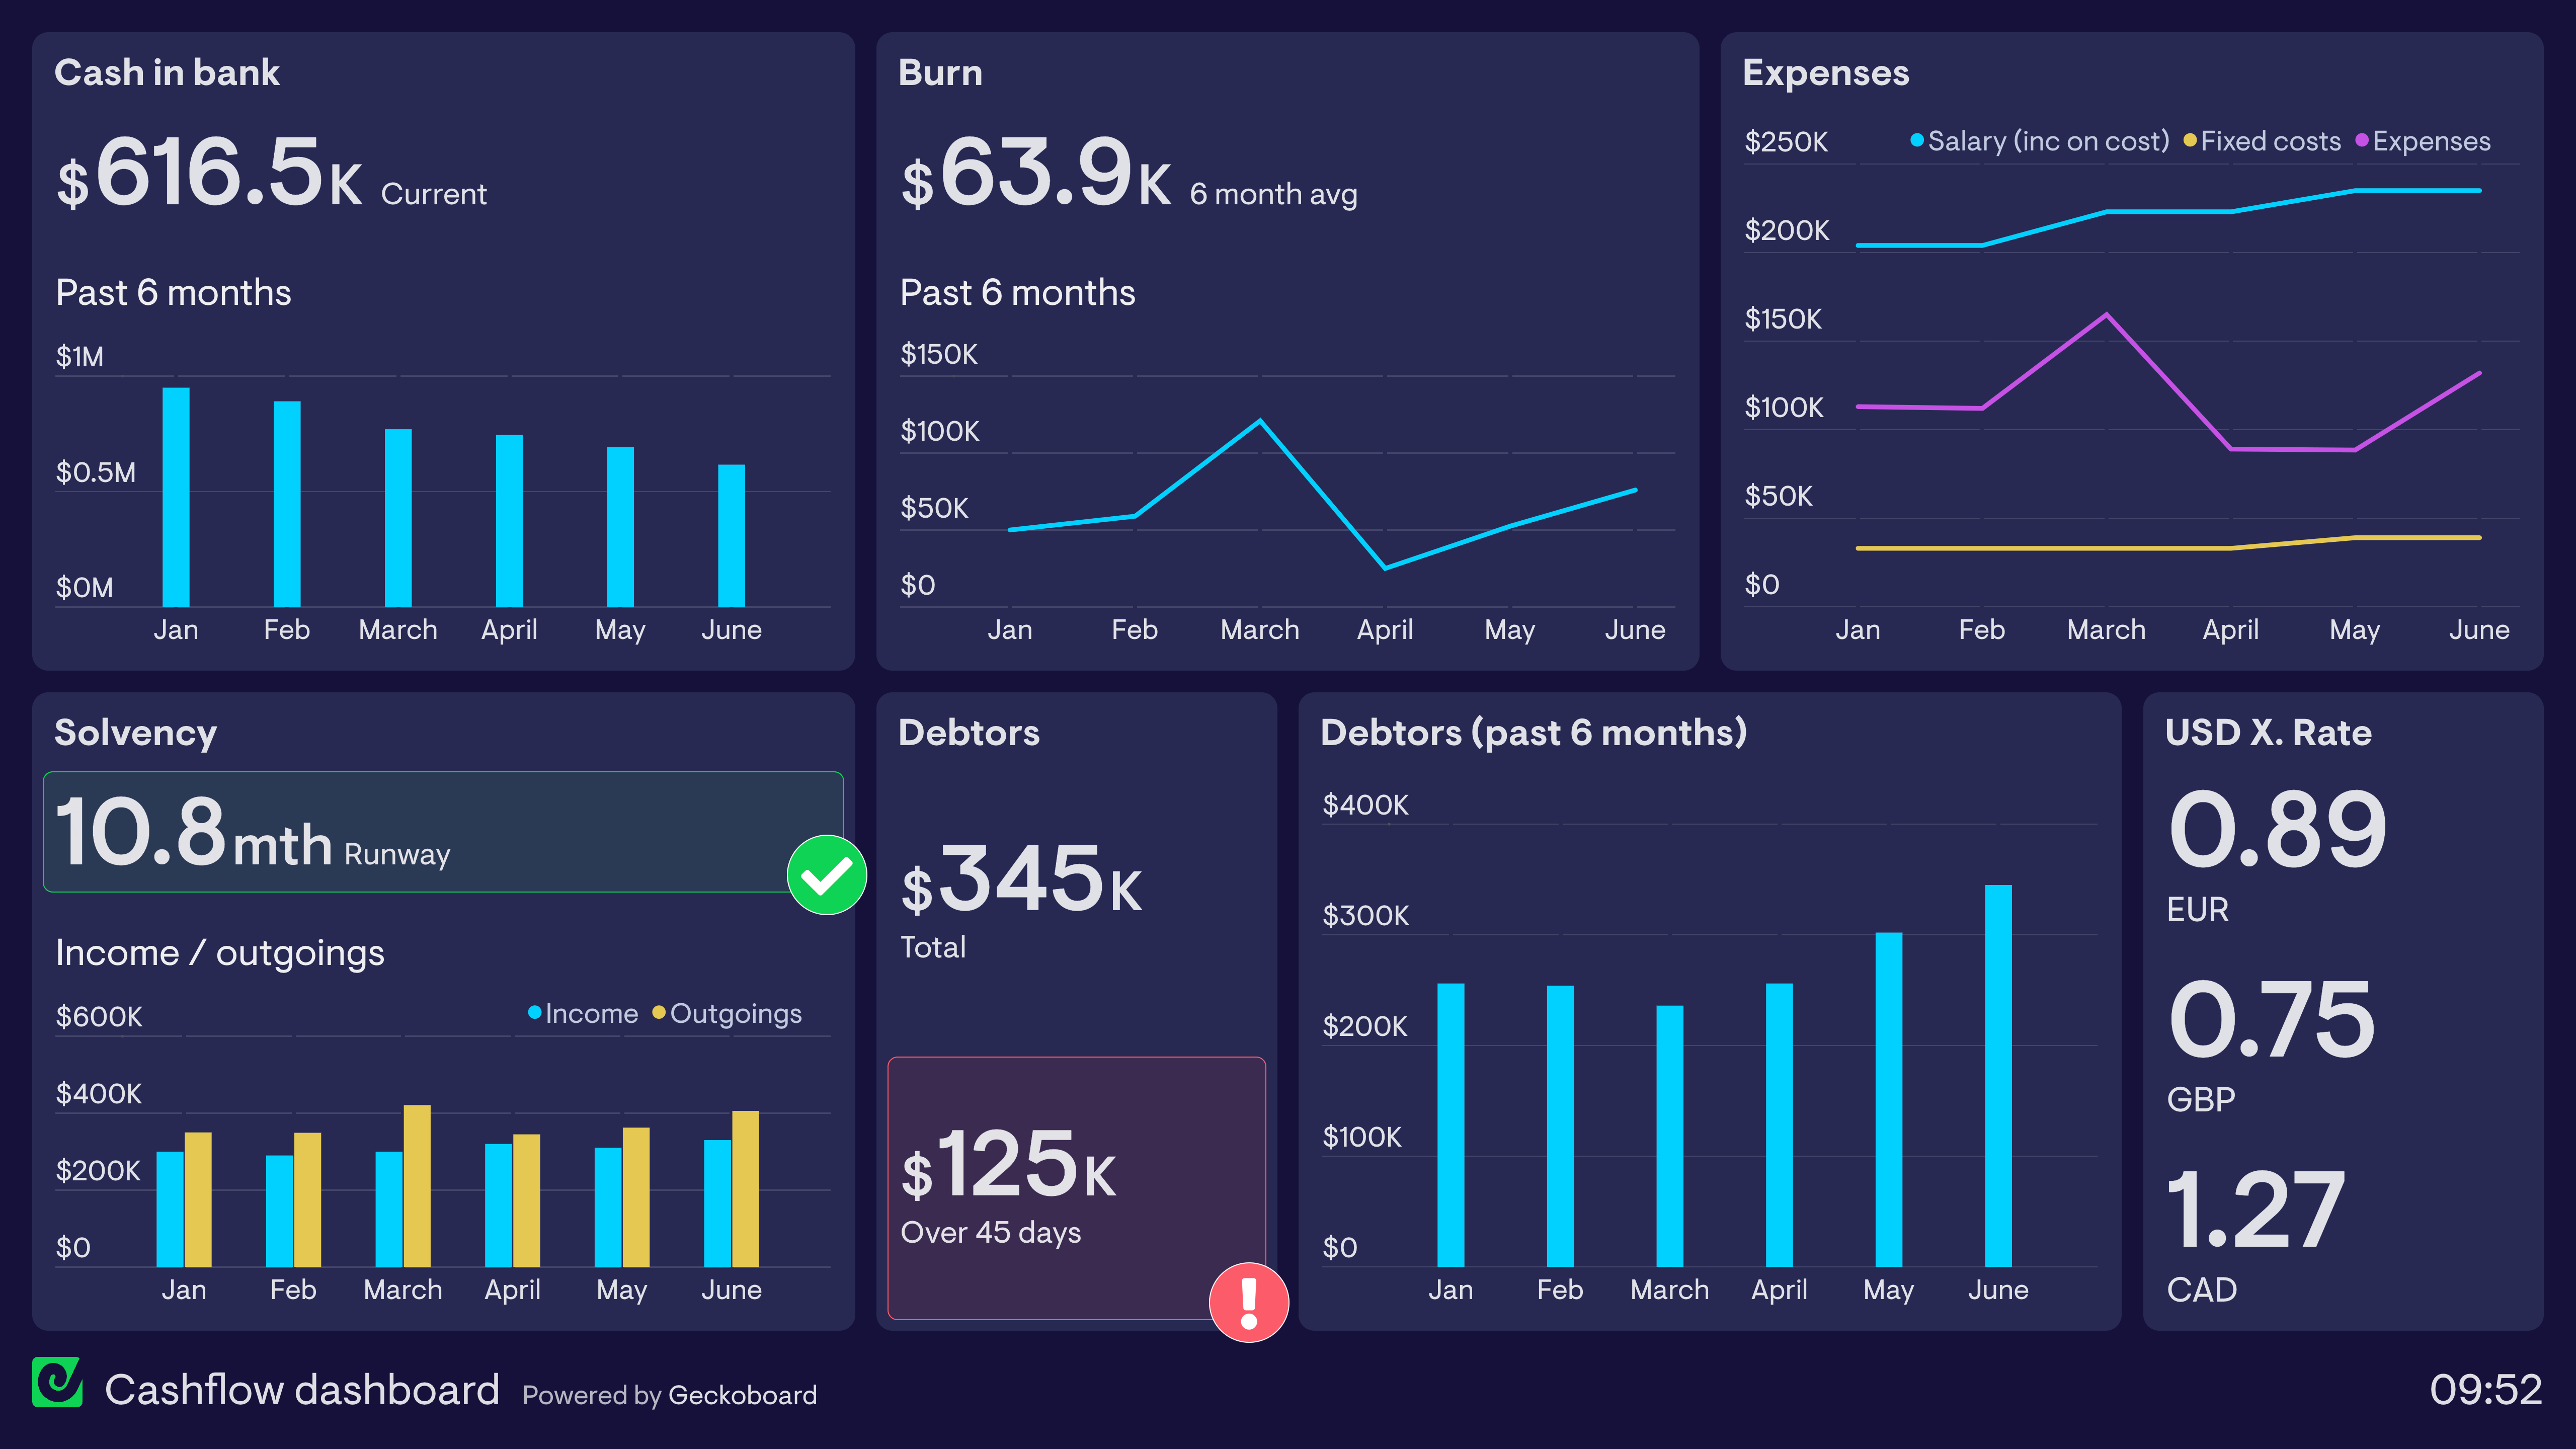
This dashboard focuses more exclusively on the SaaS company’s financial KPIs. As with the previous dashboard, this company’s main priority is MRR, which they are using to track the overall growth of the business.
However, this dashboard also tracks cash flow, which is not always in line with revenue figures. The Cash Runway is a health metric that shows how long a company can continue operating based on its current Burn Rate. Furthermore, this dashboard also tracks ARPA (Average Revenue per Account) and CAC (Customer Acquisition Cost).
Focus area
Financial performance and health
Who looks at it?
CEO, Finance Director
How often?
Several times a month
- BaremetricsMixpanelStripe for SaaSSpreadsheets