Ecommerce KPI dashboard examples
An ecommerce KPI dashboard tracks store performance across the full customer journey — from traffic and conversion to revenue and returns. It gives online sellers a fast read on how the store is doing without pulling reports from multiple platforms.
Ecommerce KPI dashboard
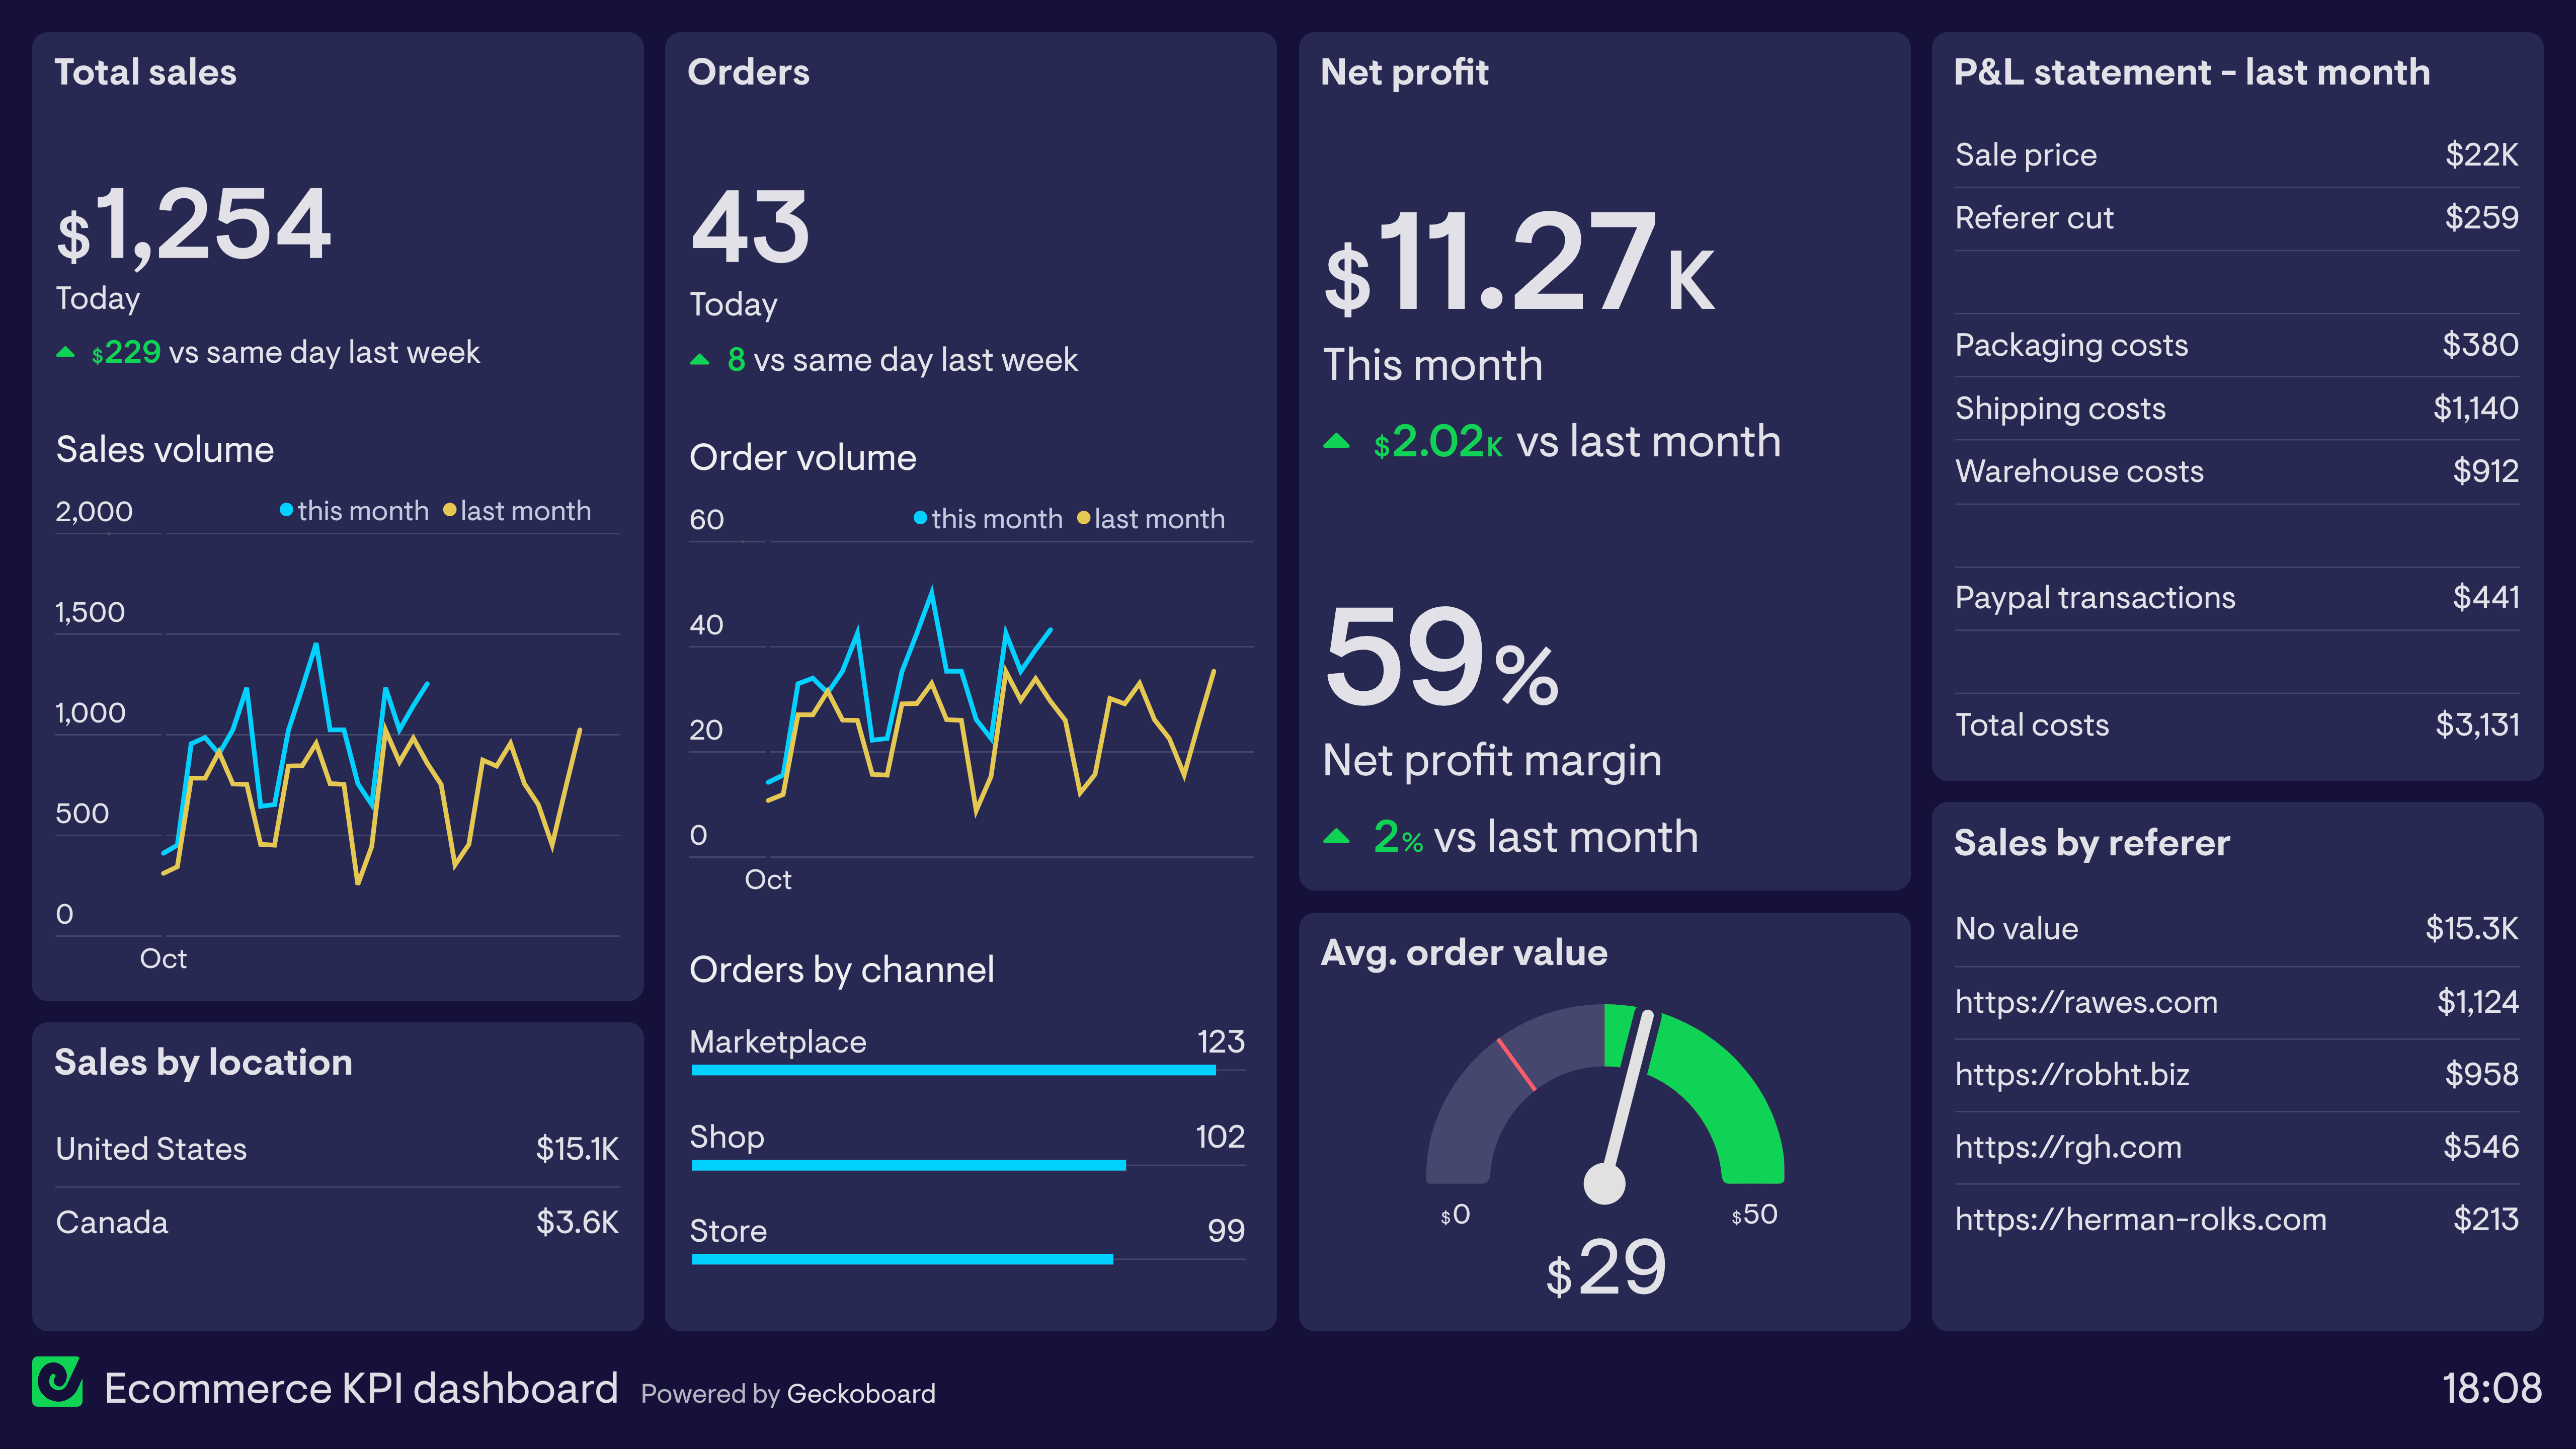
This dashboard takes many of its metrics directly from Shopify, which the store owner uses as their primary ecommerce platform. Not only is it important for the seller to track total revenue and orders, but also health metrics such as Average Order Value, and Profit Margin.
This seller has also included a Profit & Loss statement, detailing various business costs incurred last month. These metrics are not tracked in Shopify. But by using a data dashboard, they can display these important metrics alongside the Shopify data, even though they come from different sources.
Browse other popular examples
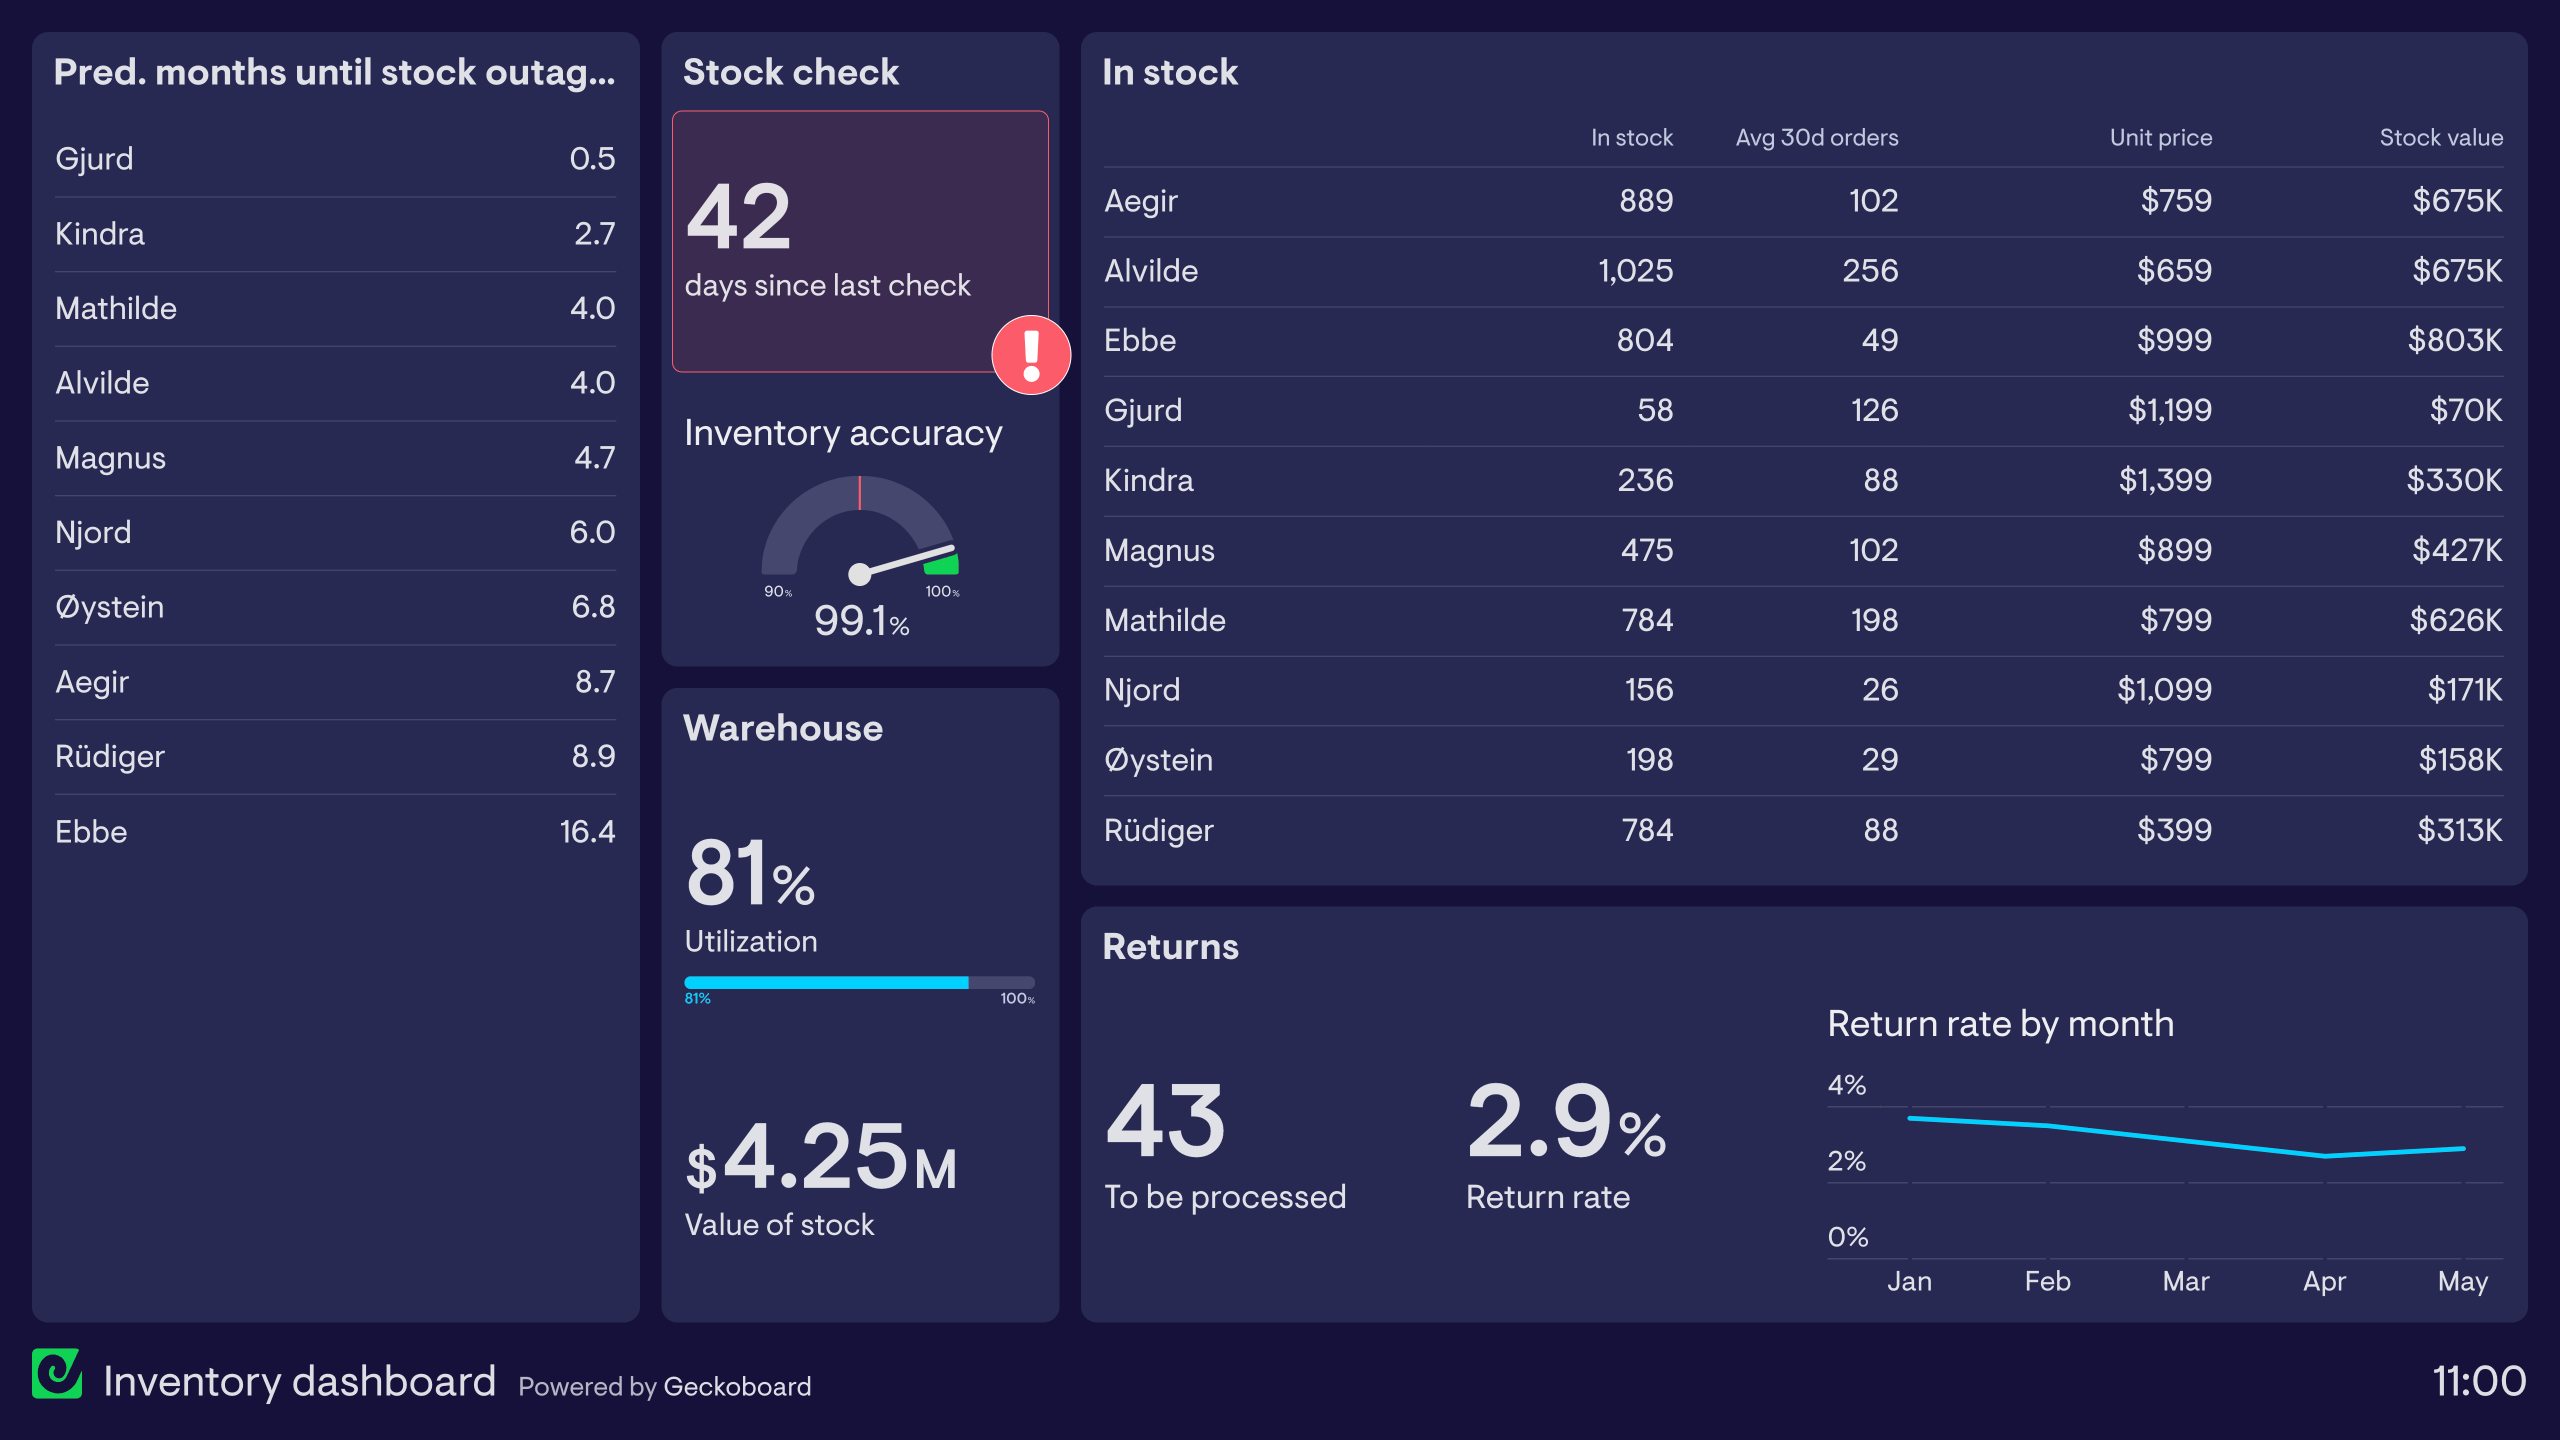
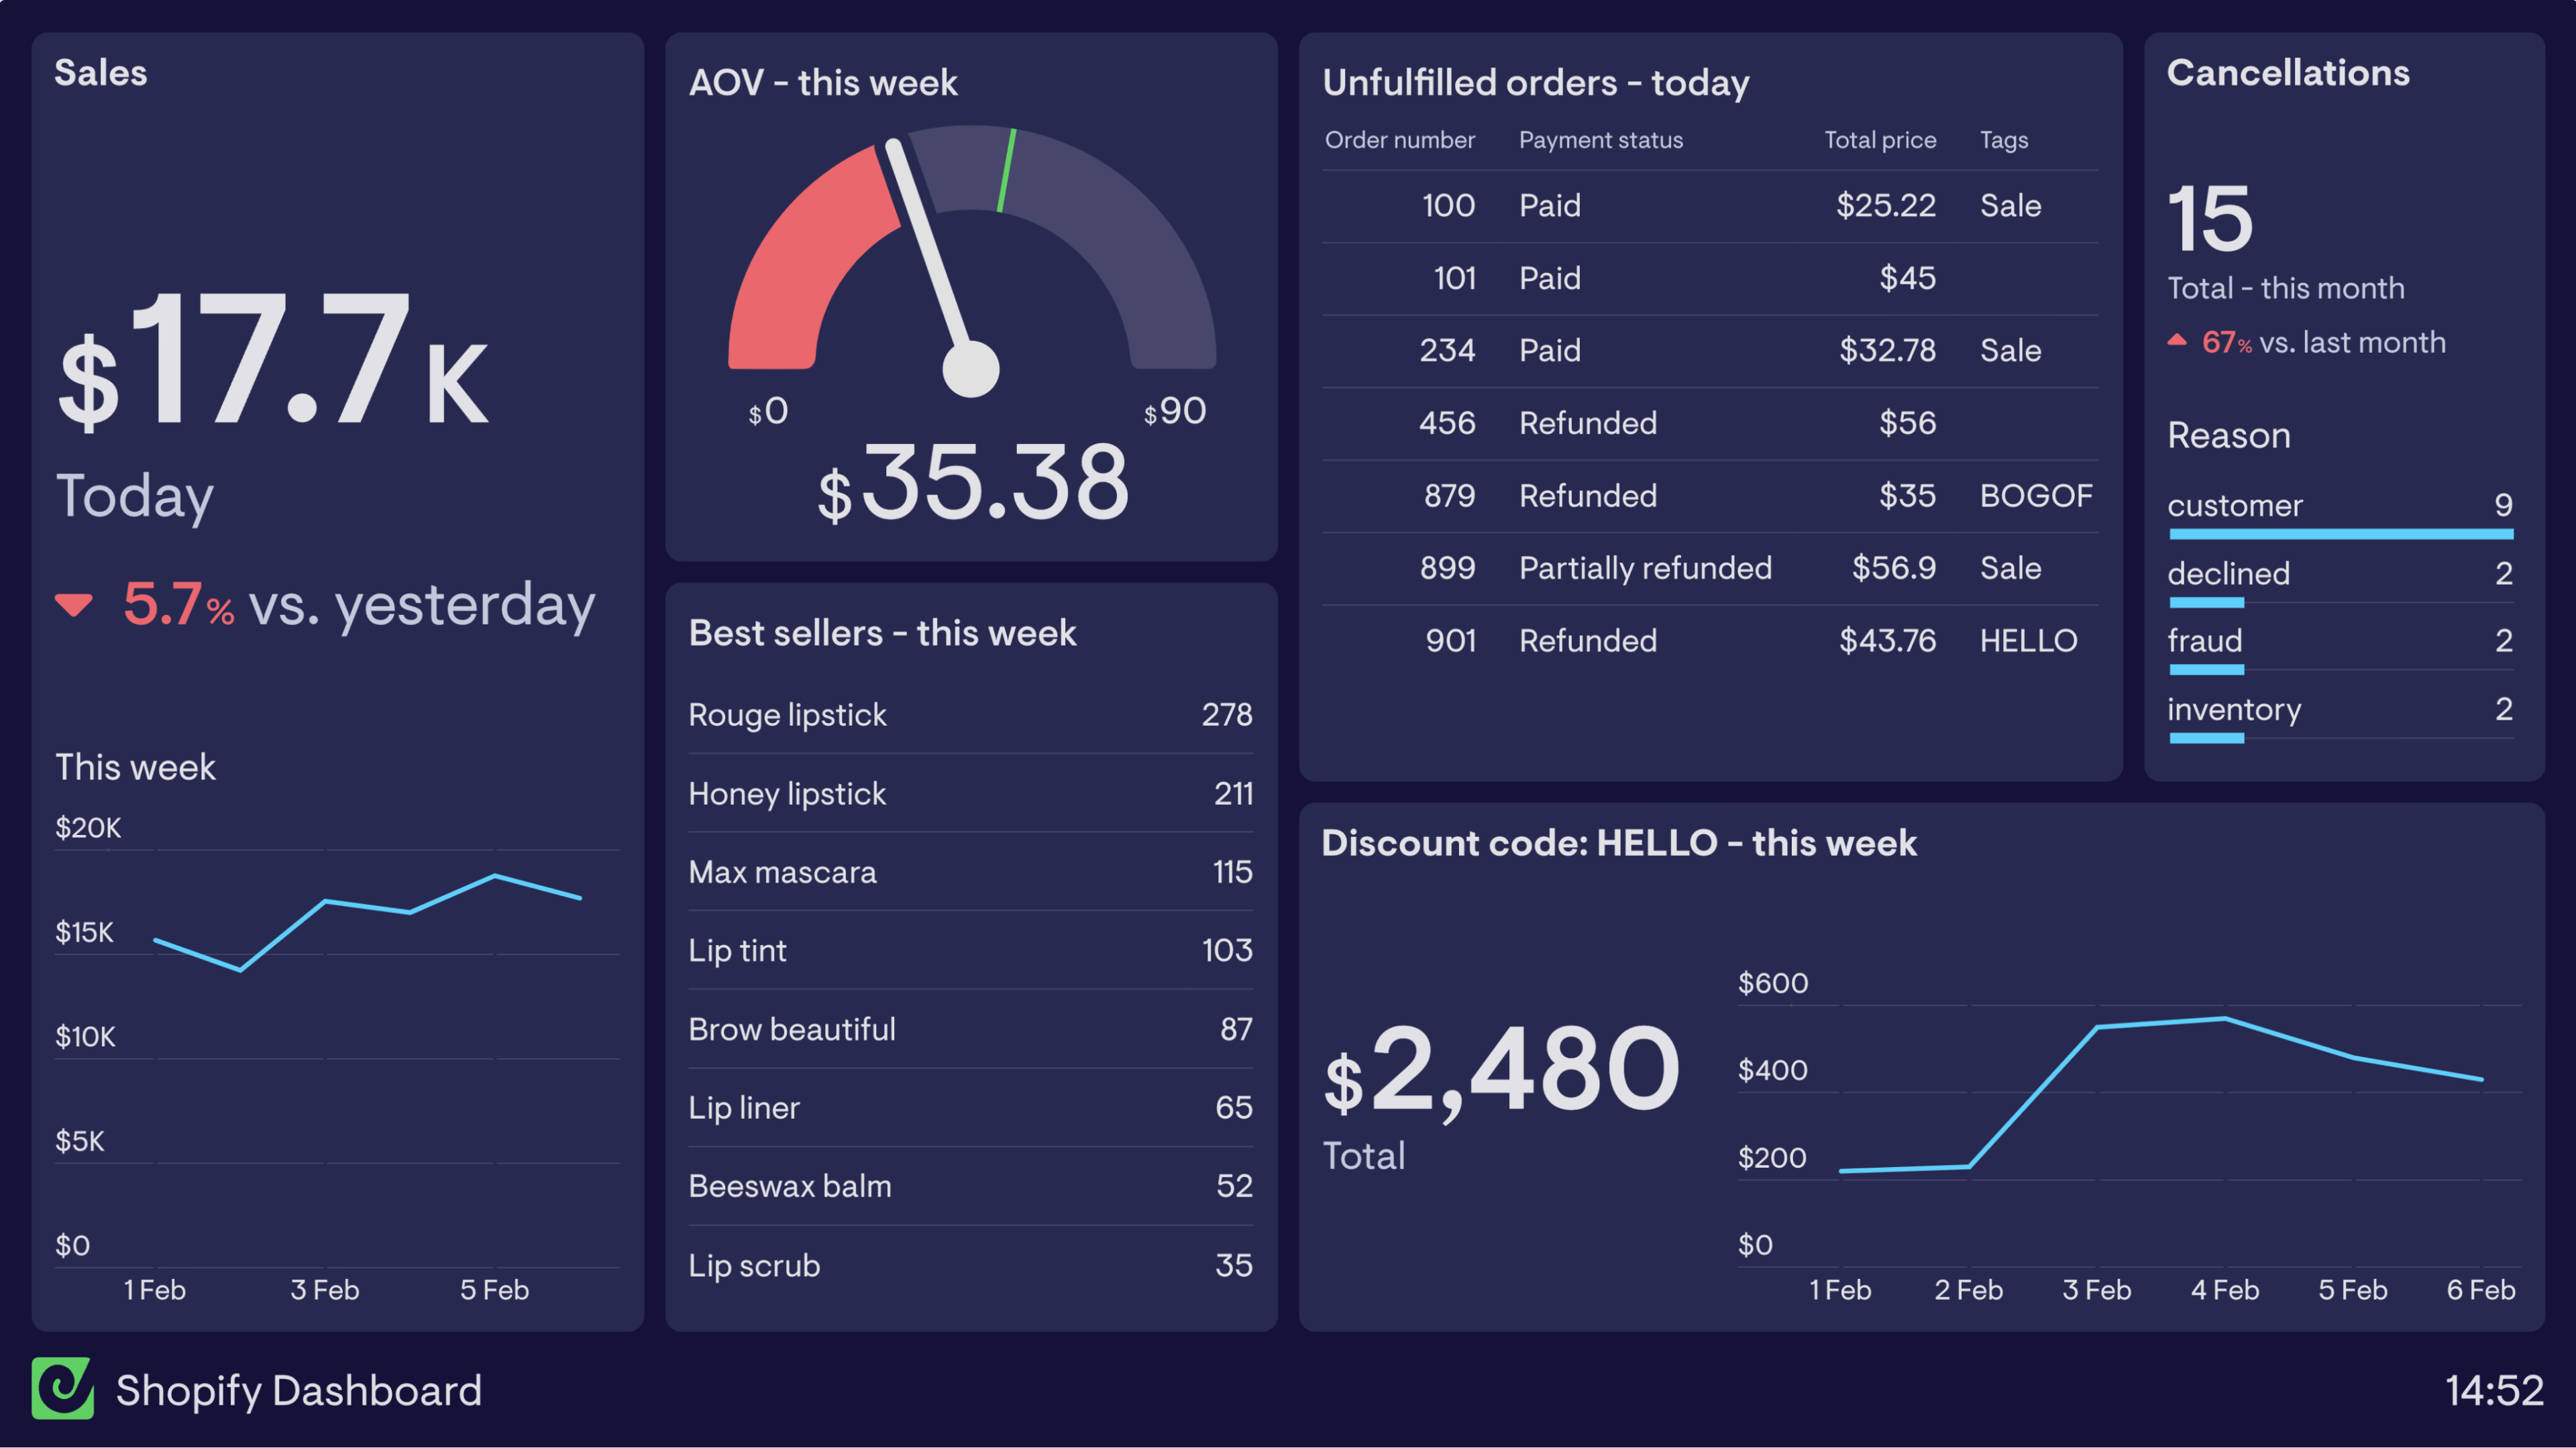
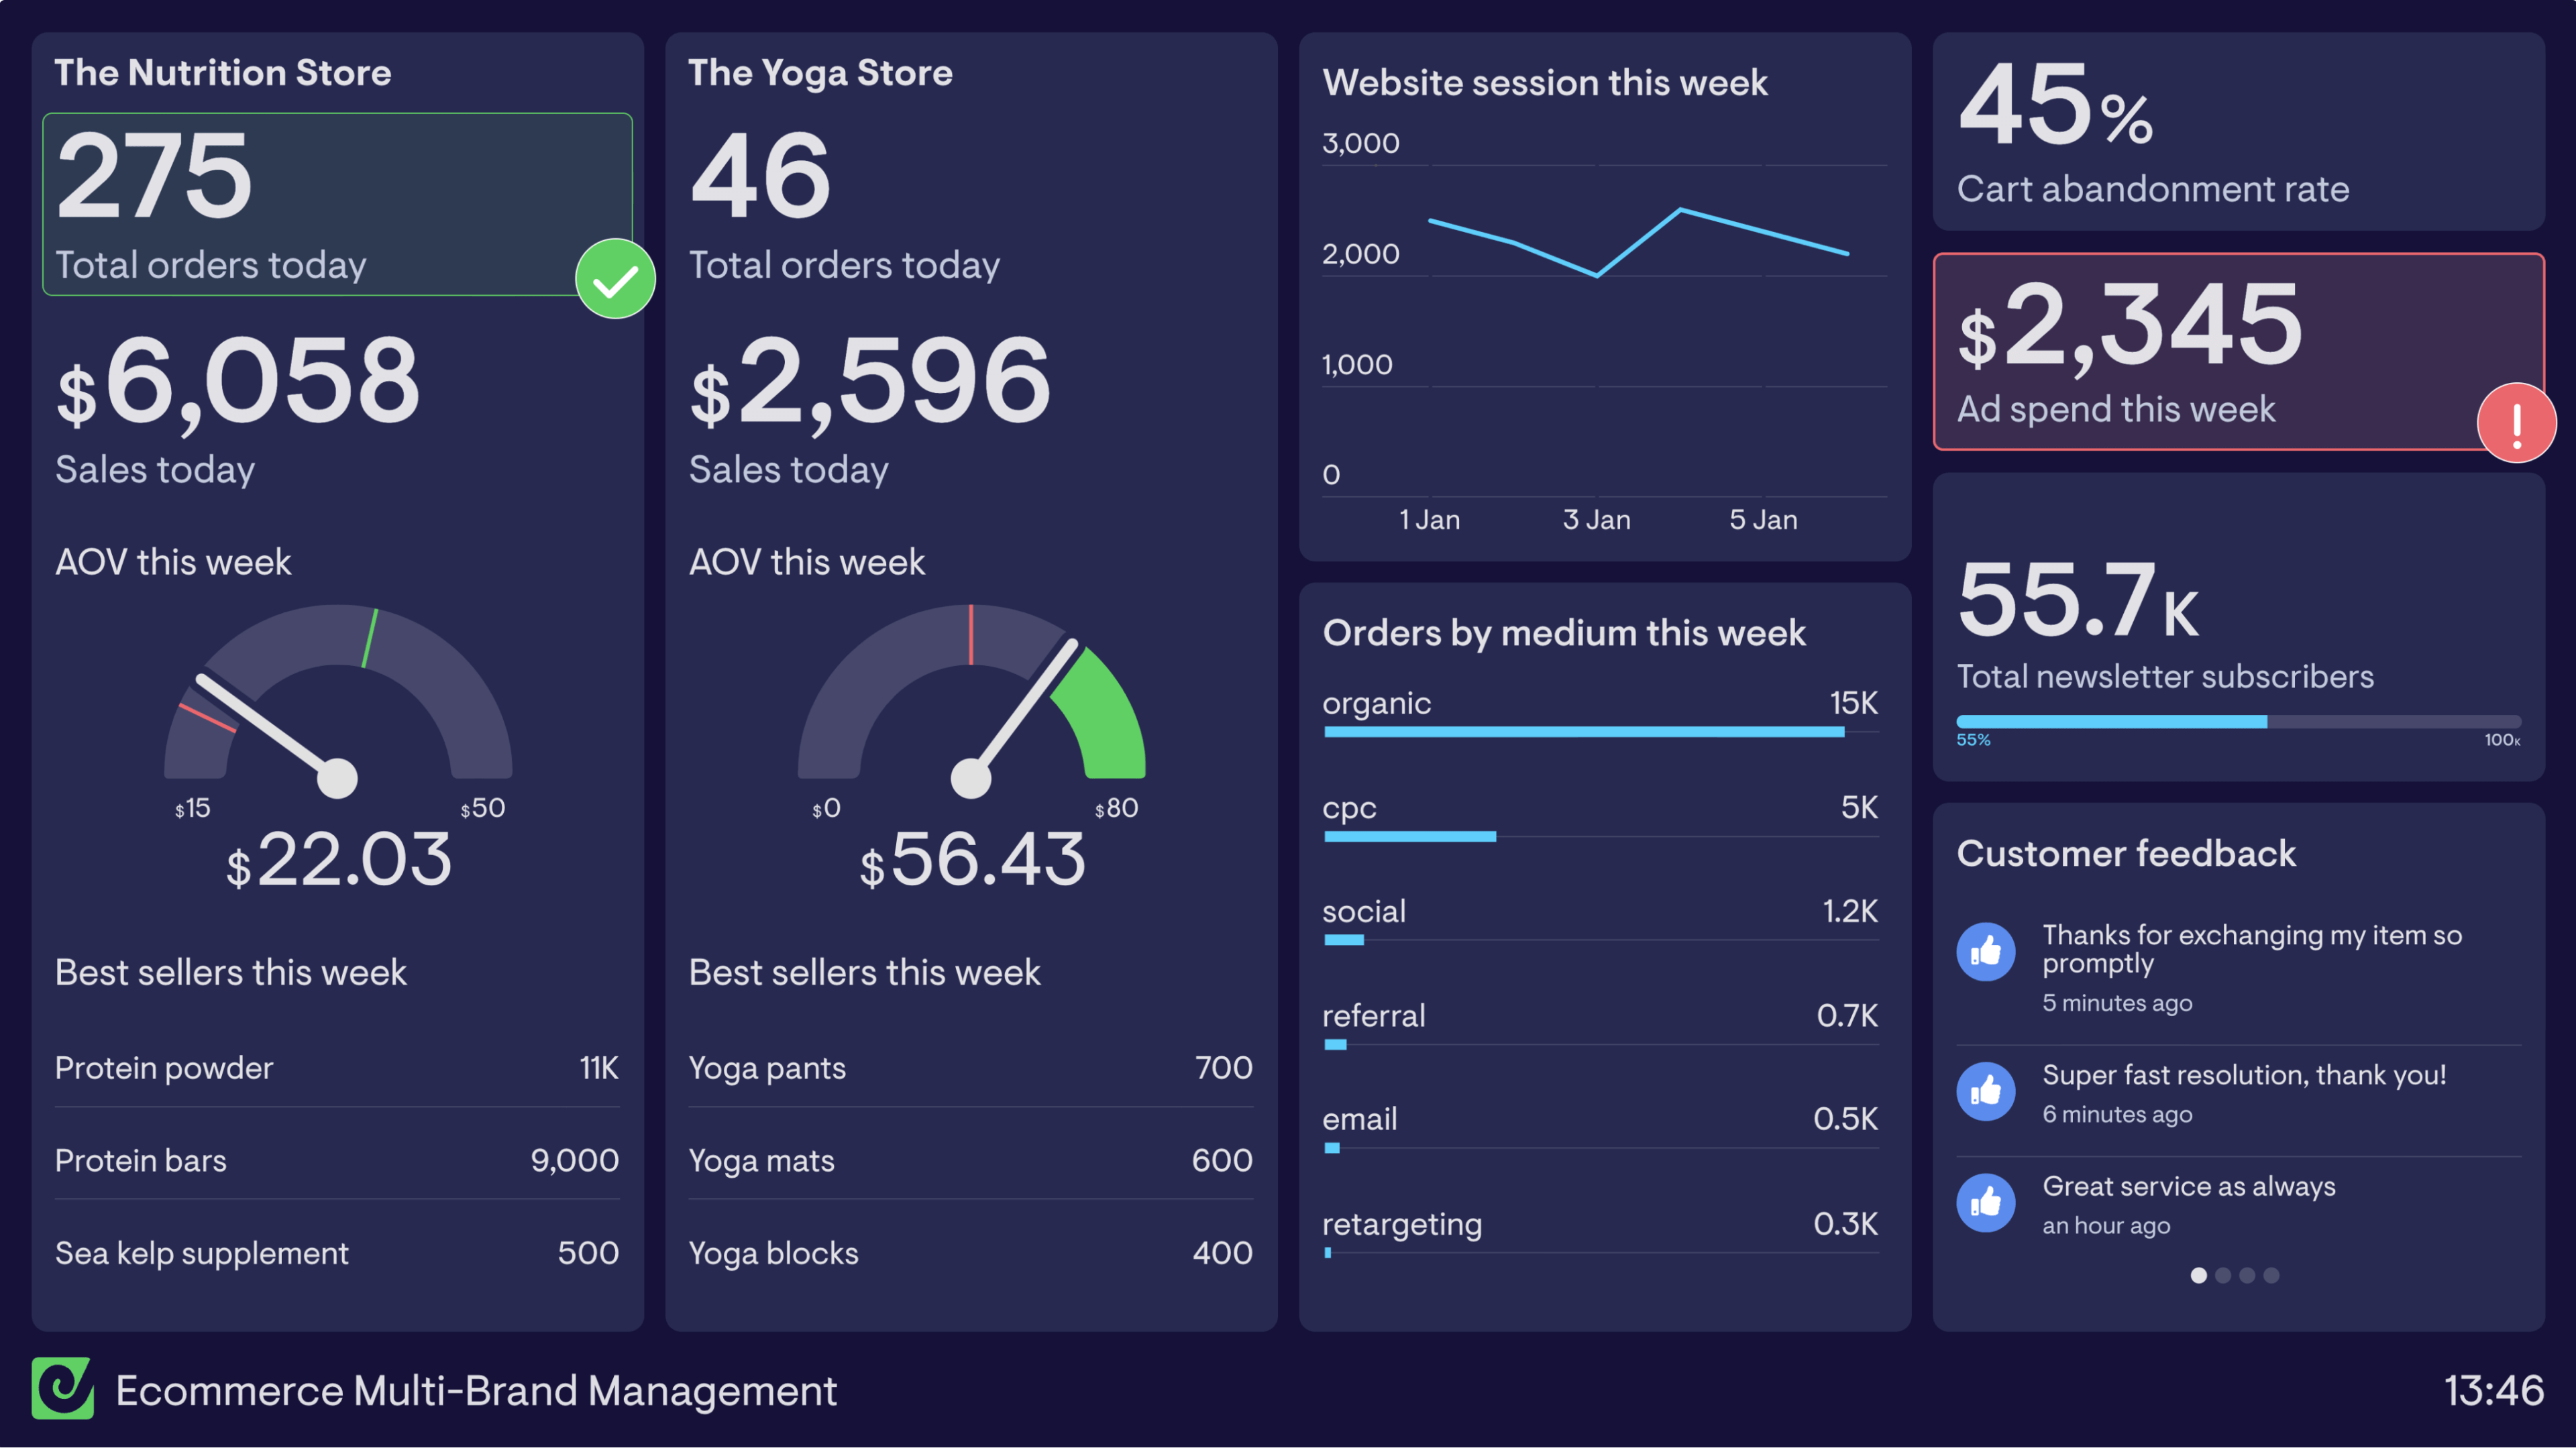
An ecommerce KPI dashboard gives store owners and ecommerce managers a real-time view of the metrics that drive online sales performance. It tracks revenue, conversion, and customer behaviour in one place — so teams can act quickly on what the data is telling them instead of waiting for weekly reports.
Geckoboard is a live dashboard tool that connects to Shopify and other ecommerce platforms to give online sellers a real-time view of store performance. Dashboards update automatically so teams always have a current picture of how the store is tracking against targets.
Common metrics include total revenue, orders, average order value, conversion rate, sessions, returning customer rate, and refund rate. Teams often track these day-over-day and week-over-week to spot trends early.
Building a custom ecommerce KPI dashboard is straightforward with Geckoboard's dashboard builder. Connect Shopify for store data and Google Sheets for any targets or supplementary data, then pick your metrics and build the view you need. Share with your team as a TV dashboard, shared link, or scheduled snapshot. Start a free trial or learn more about how Geckoboard works.
Use it to keep an eye on performance as it happens, especially during peak trading periods like Black Friday when every hour of sales data matters. It also helps put today’s sales versus target on a screen the whole team can see.