Digital dashboard examples
A digital dashboard brings your most important business metrics into one always-current view — so teams can check performance without logging into multiple tools or waiting for a report. The metrics you choose to show are the ones that get managed.
Marketing dashboard
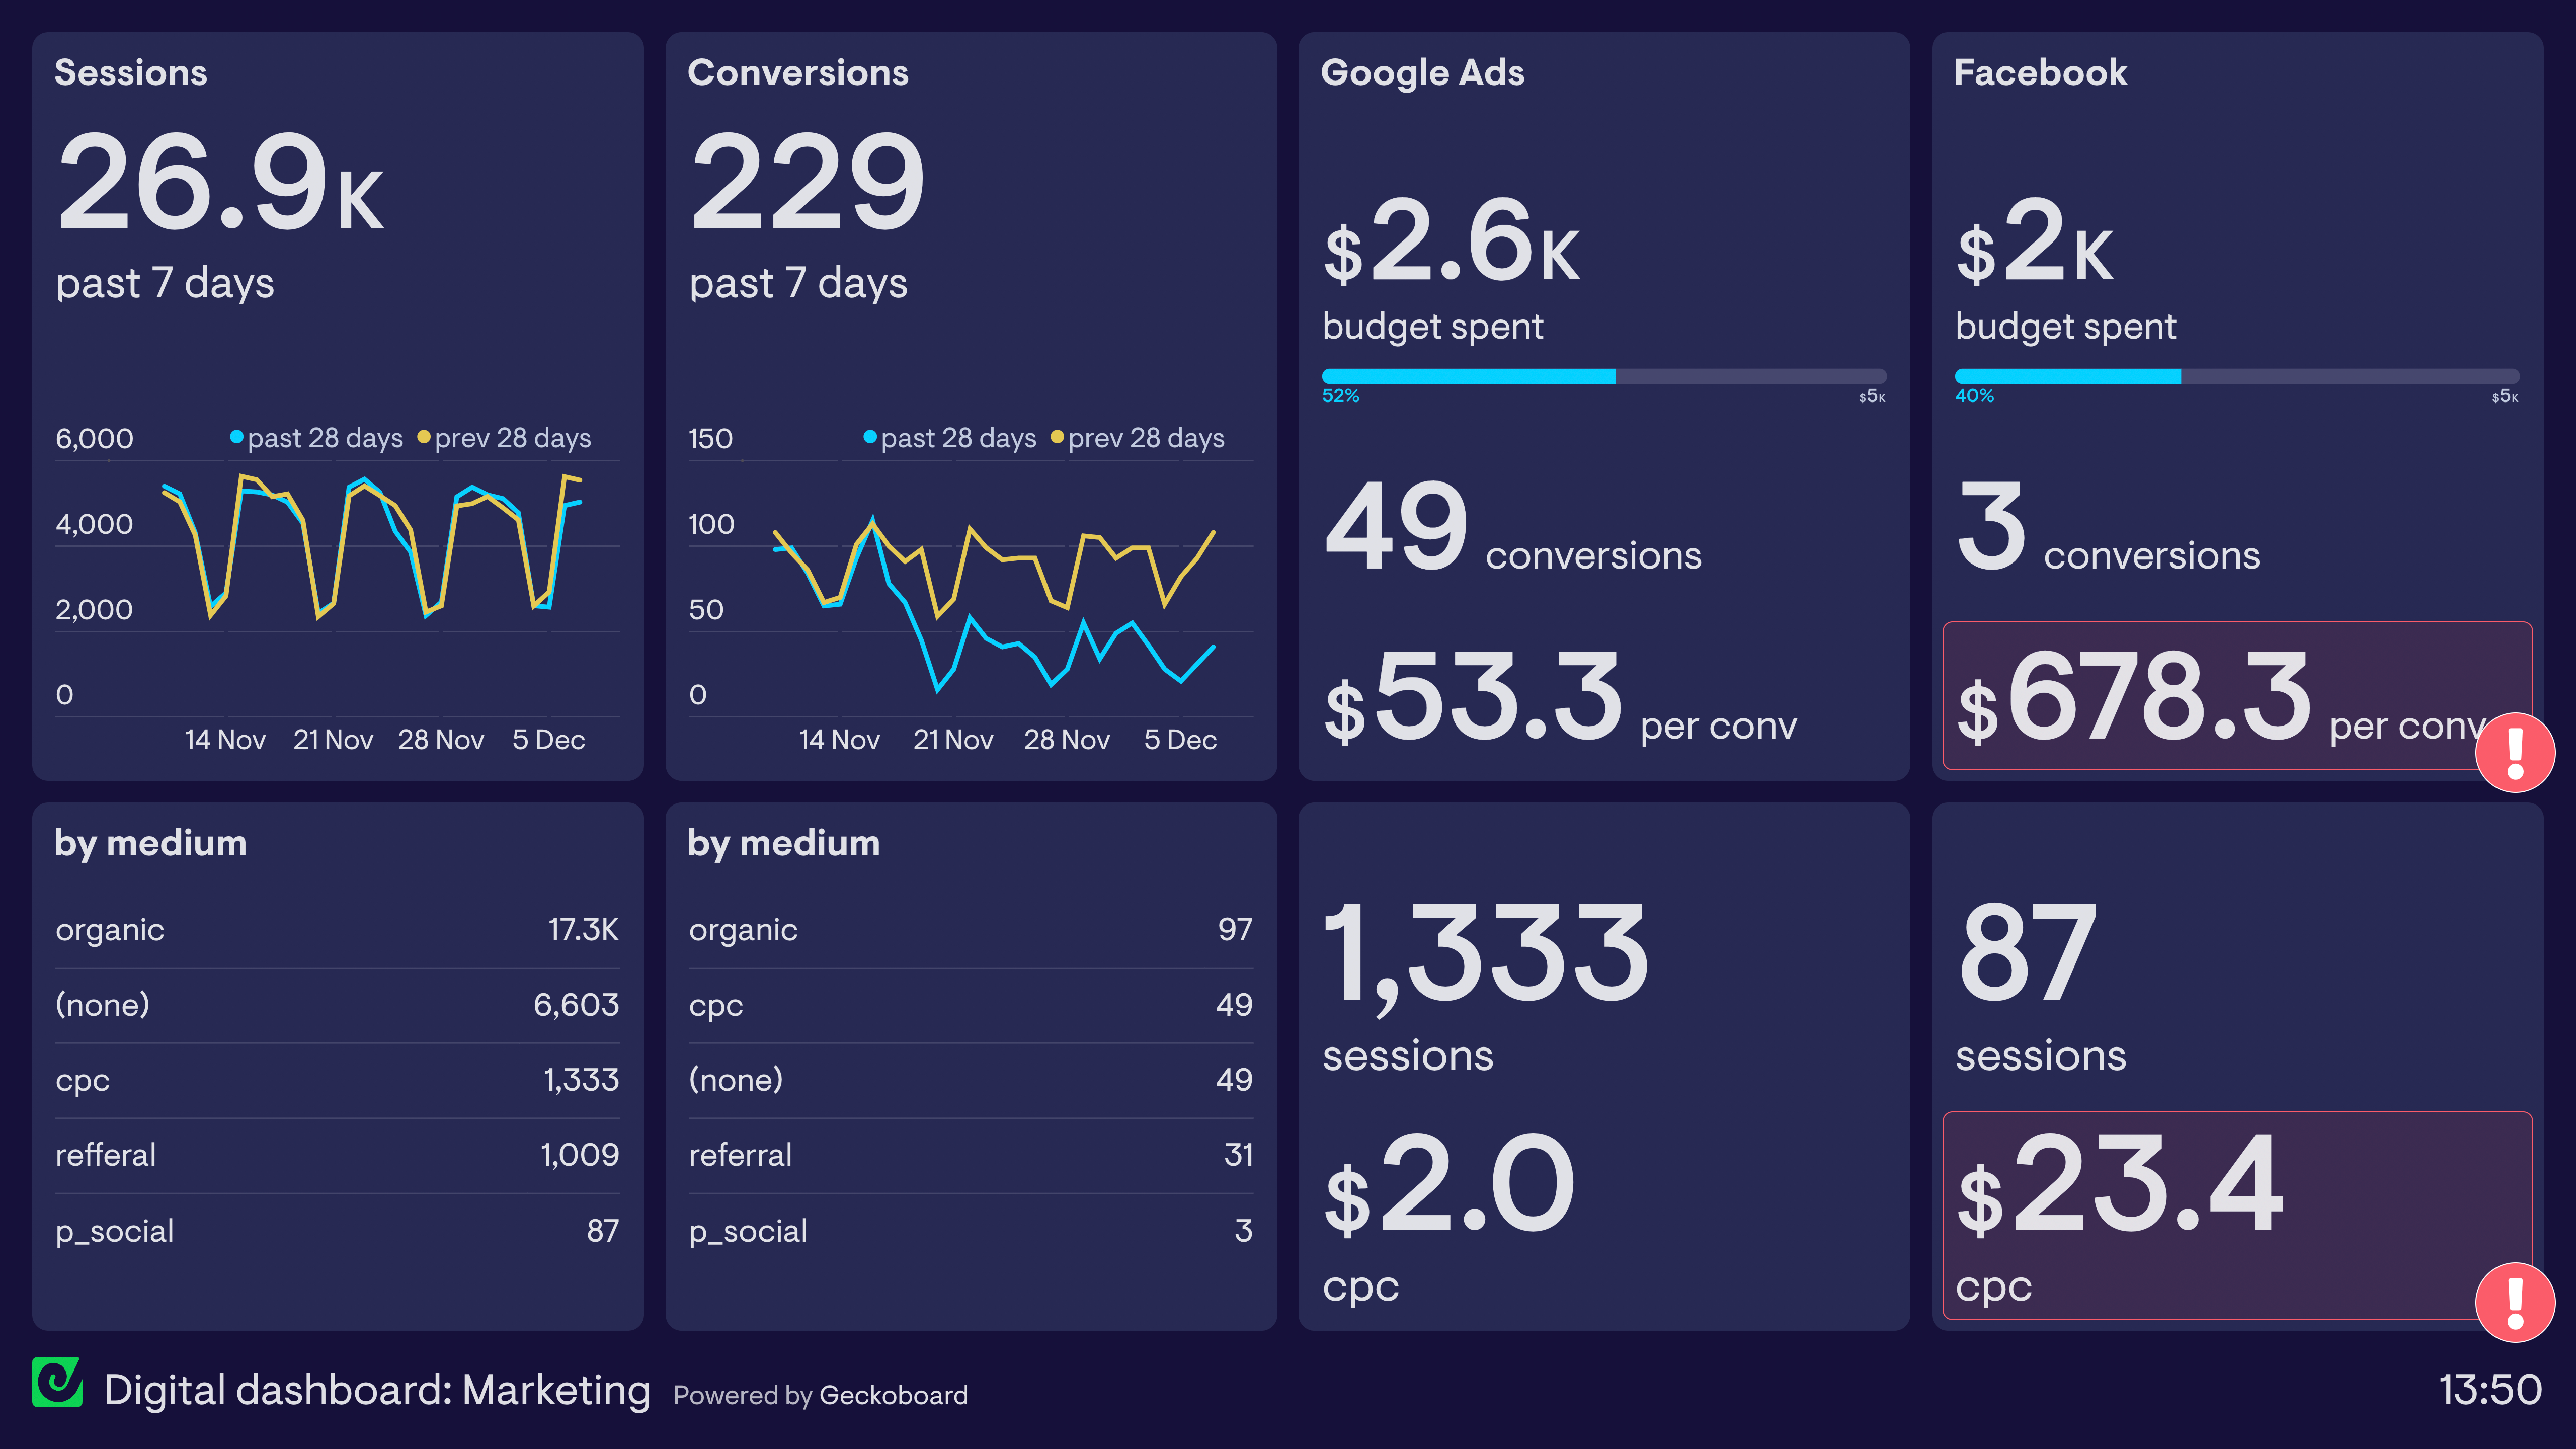
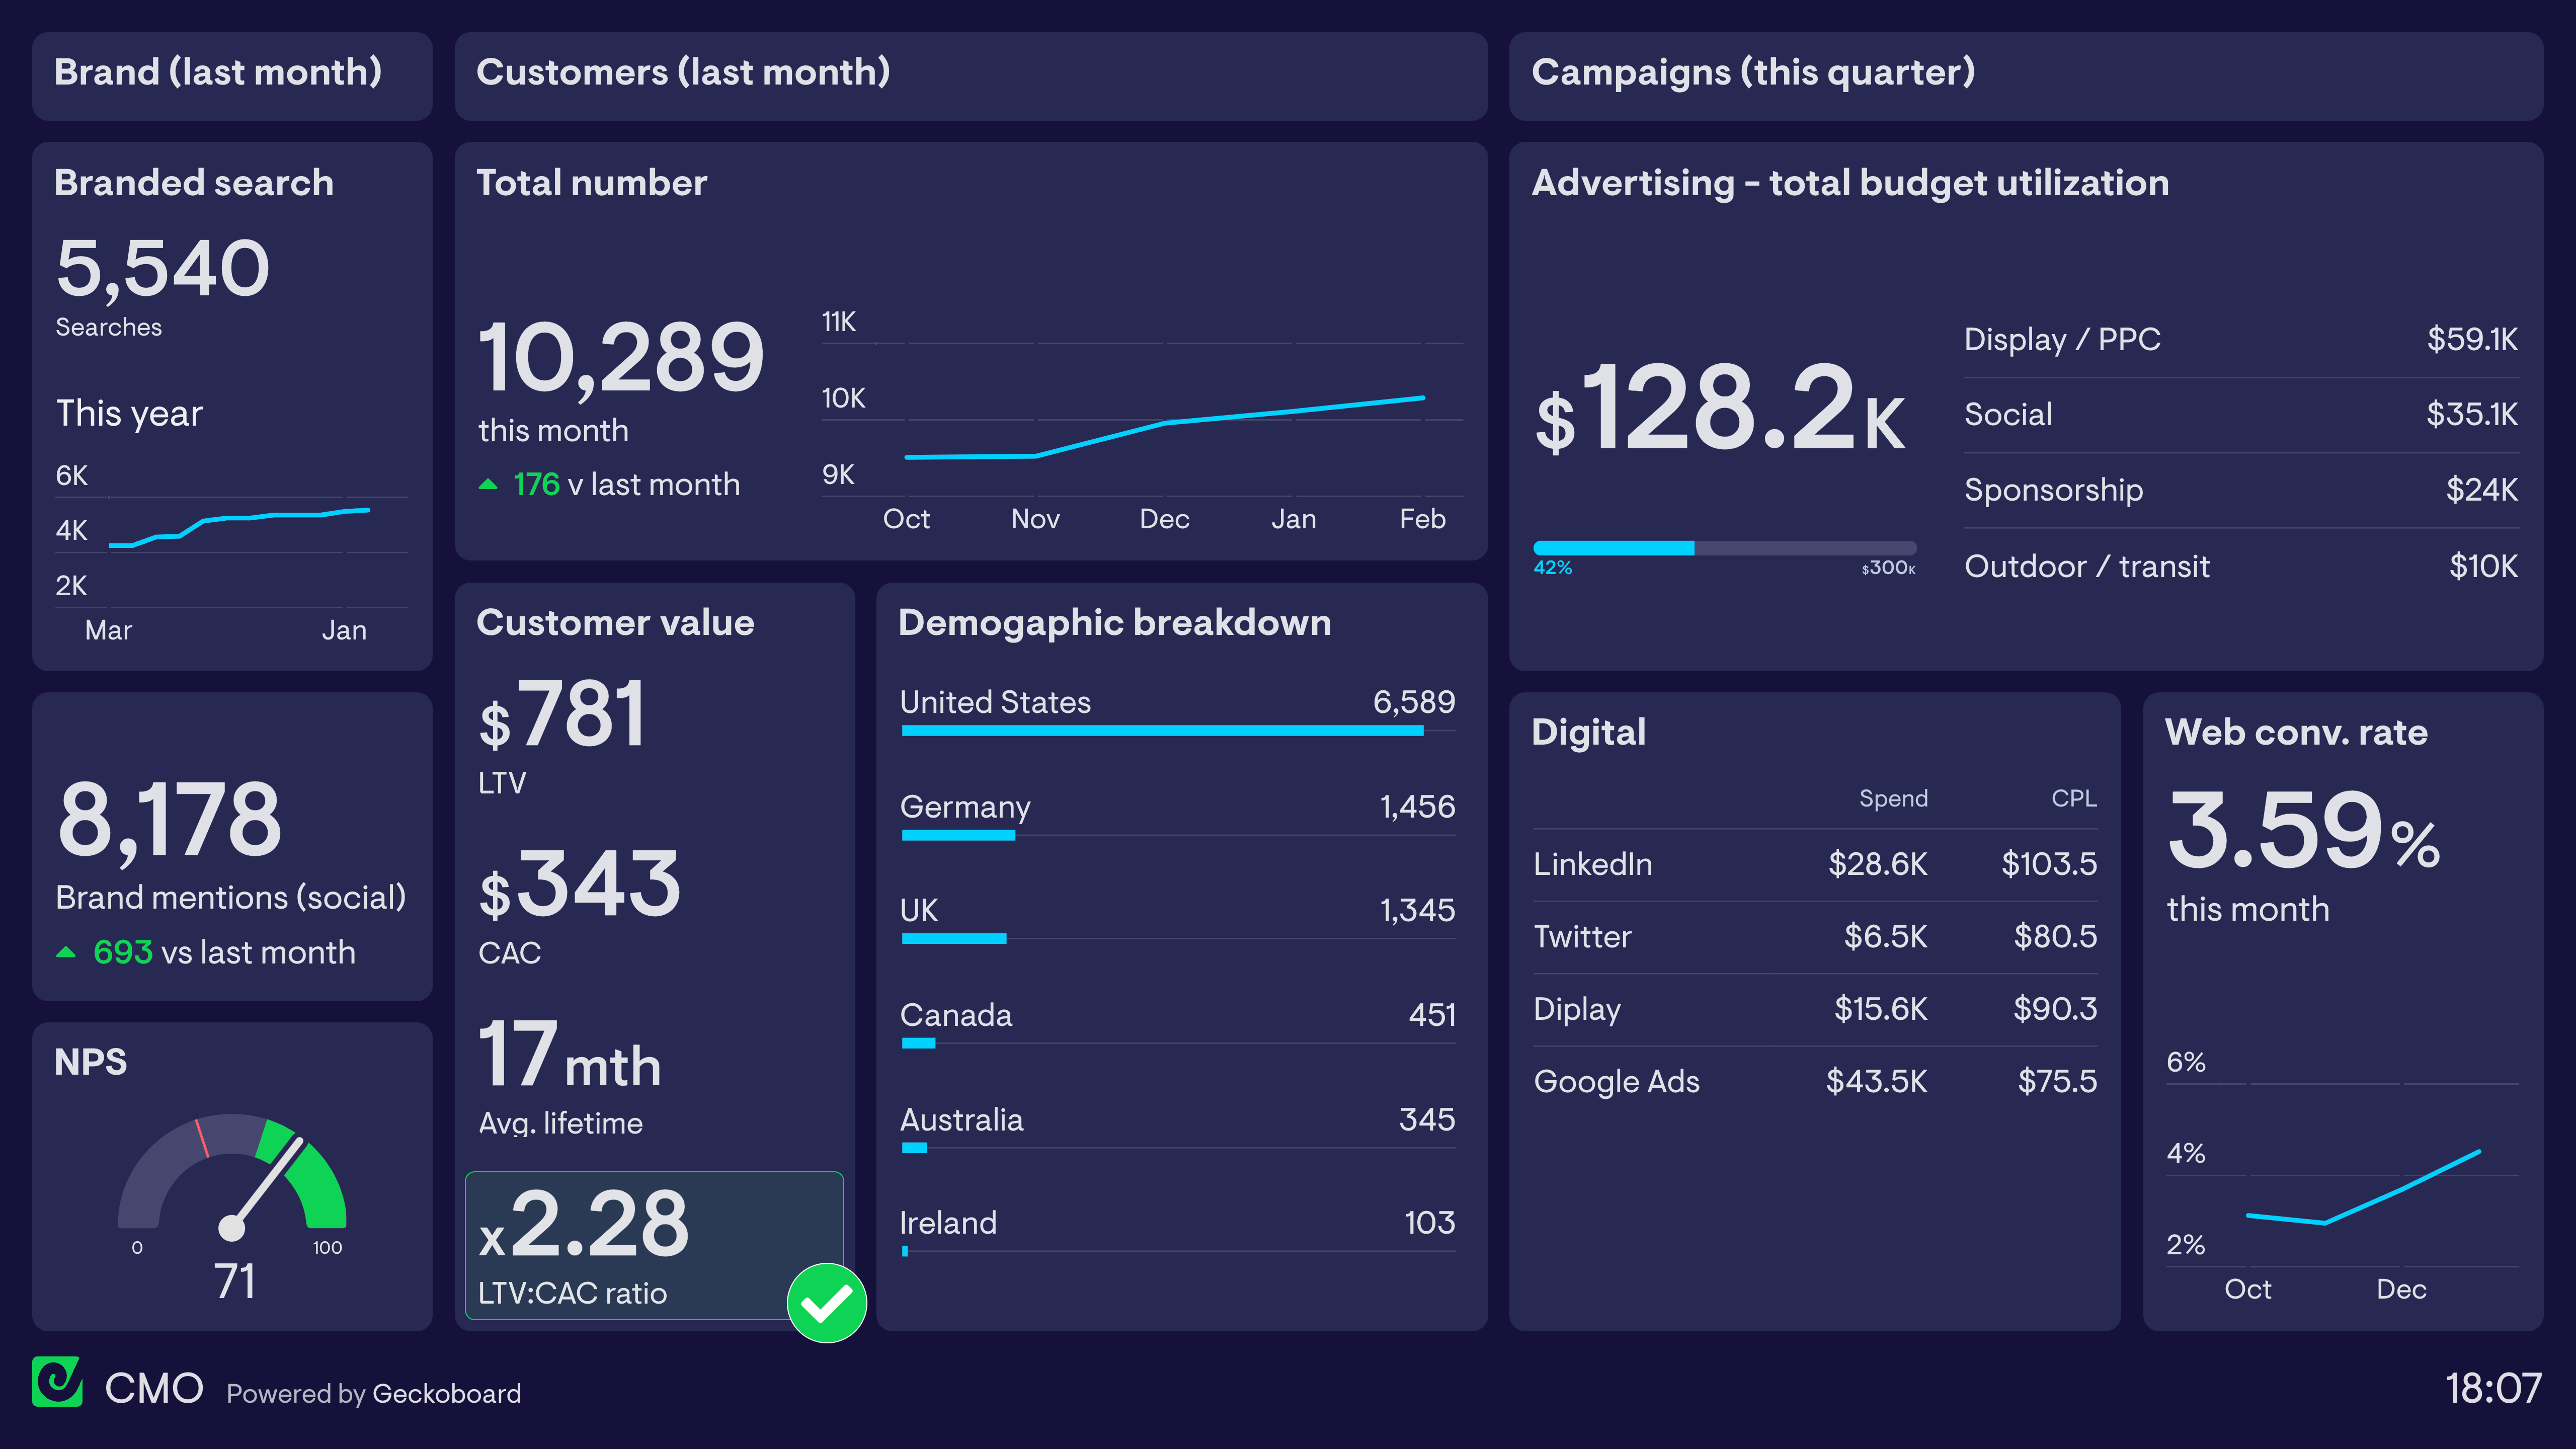
Live dashboards are popular with marketing teams who monitor Key Performance Indicators held in multiple data sources. This dashboard visualizes live data from Google Analytics, Facebook and Google Ads. Using the dashboard, the Marketing team can monitor a variety of important metrics related to their digital marketing, website performance and digital advertising campaigns.
On the left half of the dashboard, the team is tracking the number of sessions to their website, as well as the number of conversions that have taken place. A conversion in this case represents a new paying subscriber. From the data visualizations, we can see that over the past month, conversions have dropped off, but overall sessions have stayed the same. This indicates a decrease in conversion rates, which the team will want to investigate further.
On the right hand side, the team is also tracking two digital advertising channels, Google Ads and Facebook. Here they can monitor the overall budget utilization for the month, ensuring they don’t overspend (or underspend). We can also see performance data related to their current campaigns. Facebook Ads have not driven many sessions or new customers resulting in a higher cost per conversion and cost per click. This has triggered red status indicators, alerting the team to the issue.
Ecommerce dashboard
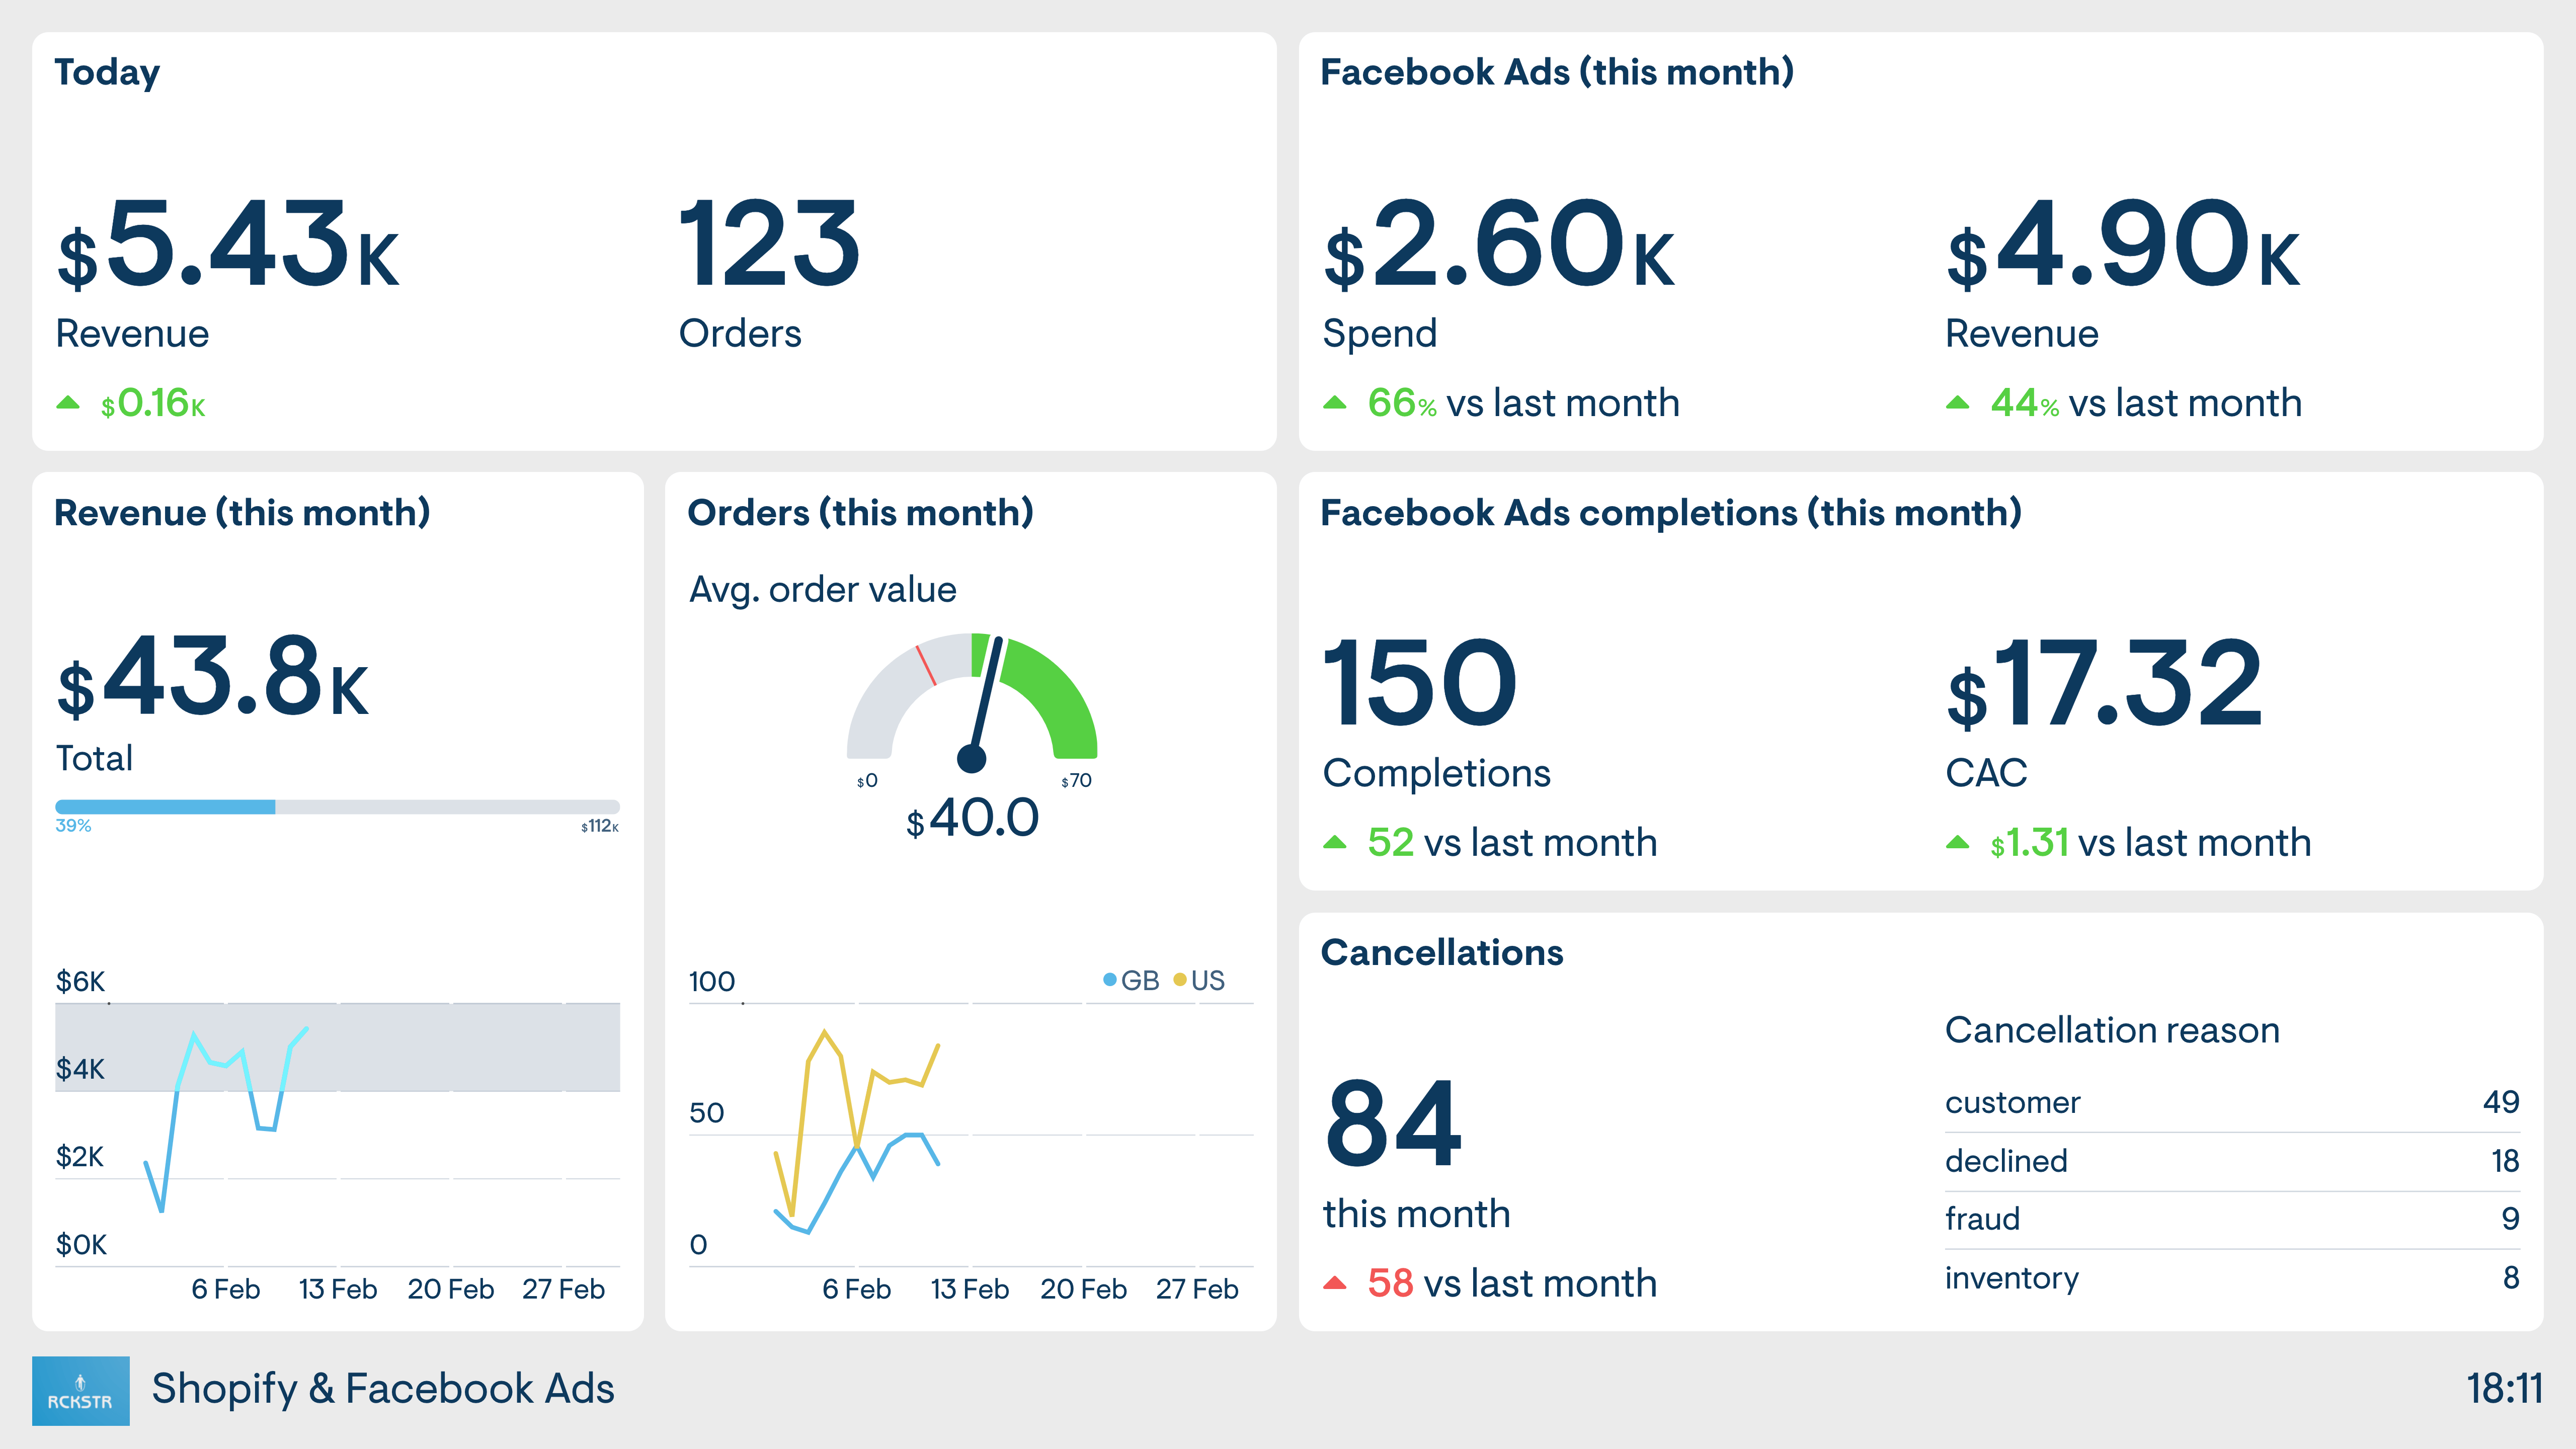
This dashboard is similar to the previous example in that it tracks the success of an online business. However, the difference here is that the business is an ecommerce business and many of the metrics it’s visualizing are pulled directly from Shopify, where it hosts its online store.
This allows the user to track important ecommerce metrics like Revenue, Orders, Order Value and Cancellations, alongside digital advertising KPIs taken from Facebook Ads. Without the dashboard, anyone interested in these metrics would need to log into both platforms and query the data they were looking for. Often, these manual steps create friction resulting in KPIs going unseen.
Sales dashboard
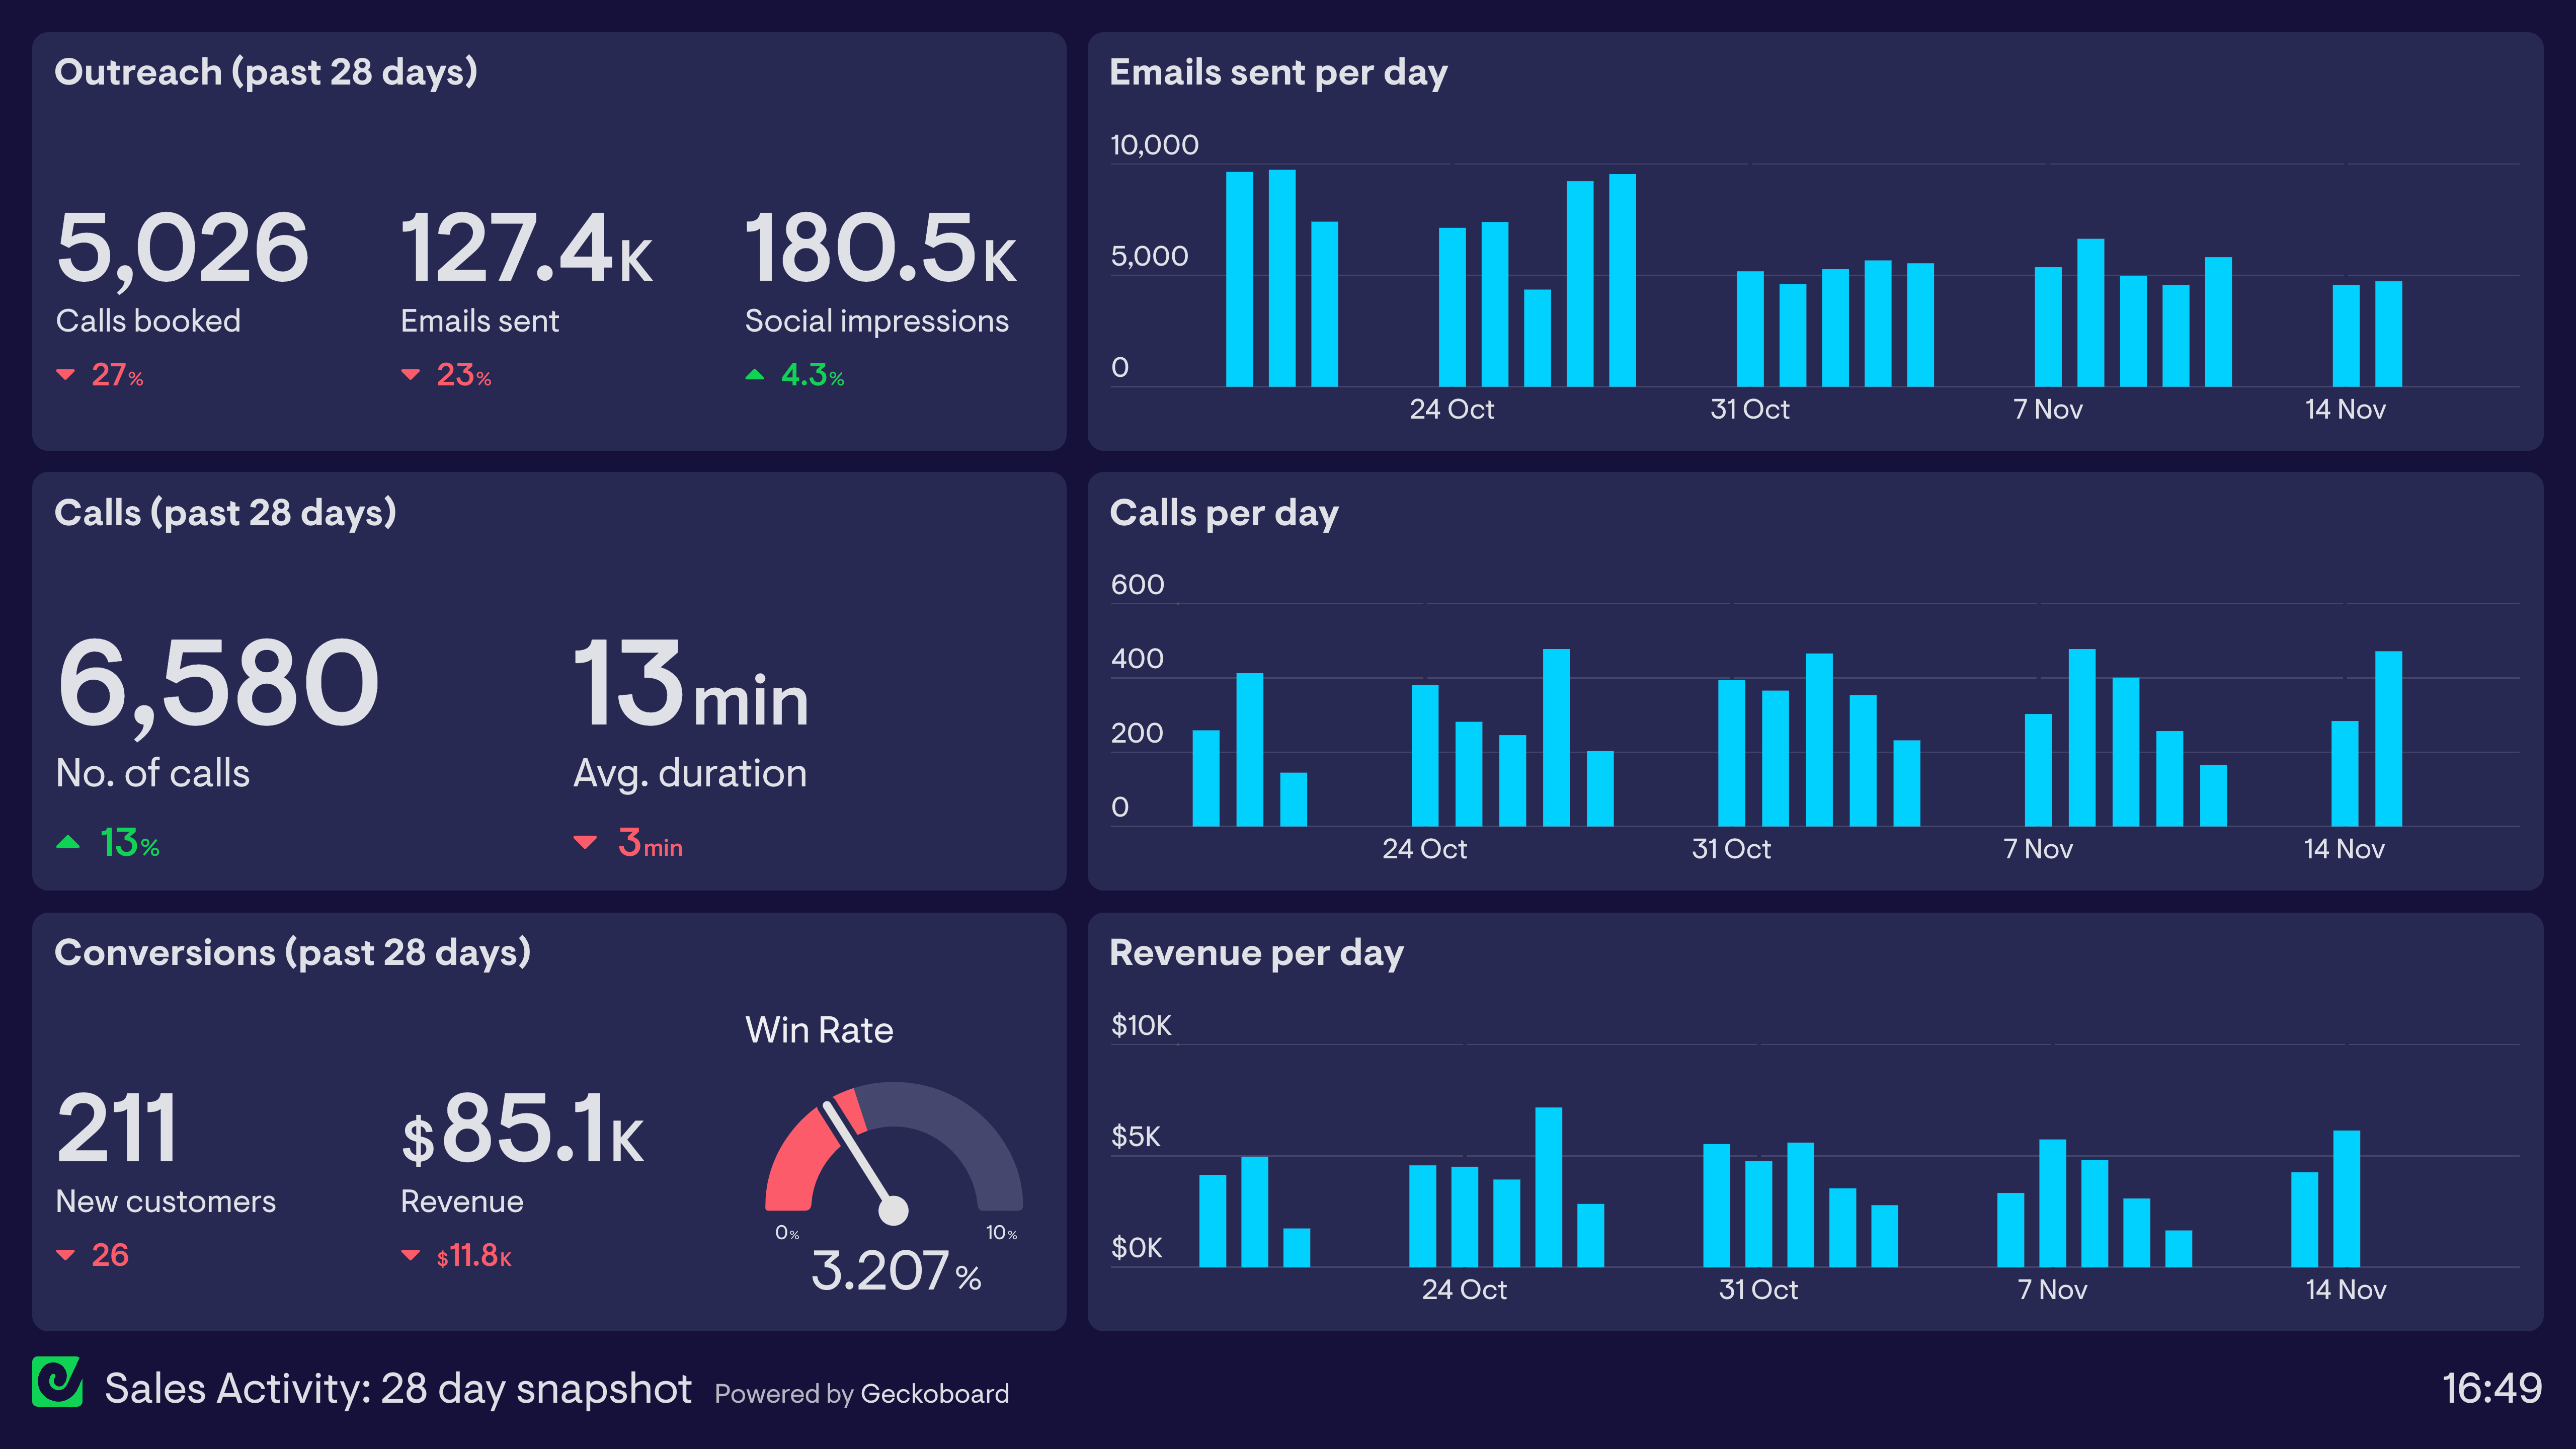
Dashboards are popular with Sales teams who need to keep track of large quantities of data that can quickly change. They are particularly helpful for Sales teams who are working towards a shared goal, helping the whole team understand overall performance so they can stay on track.
This dashboard example is taken from a Sales team who monitor sales activity – outreach emails, calls and the ultimate goal, new business. Here, the team leader can gauge the quantity and quality of the overall sales activity taking place. If the team starts to fall behind, she can examine workload and priorities, and support the team to manage their deliverables.
Finance dashboard
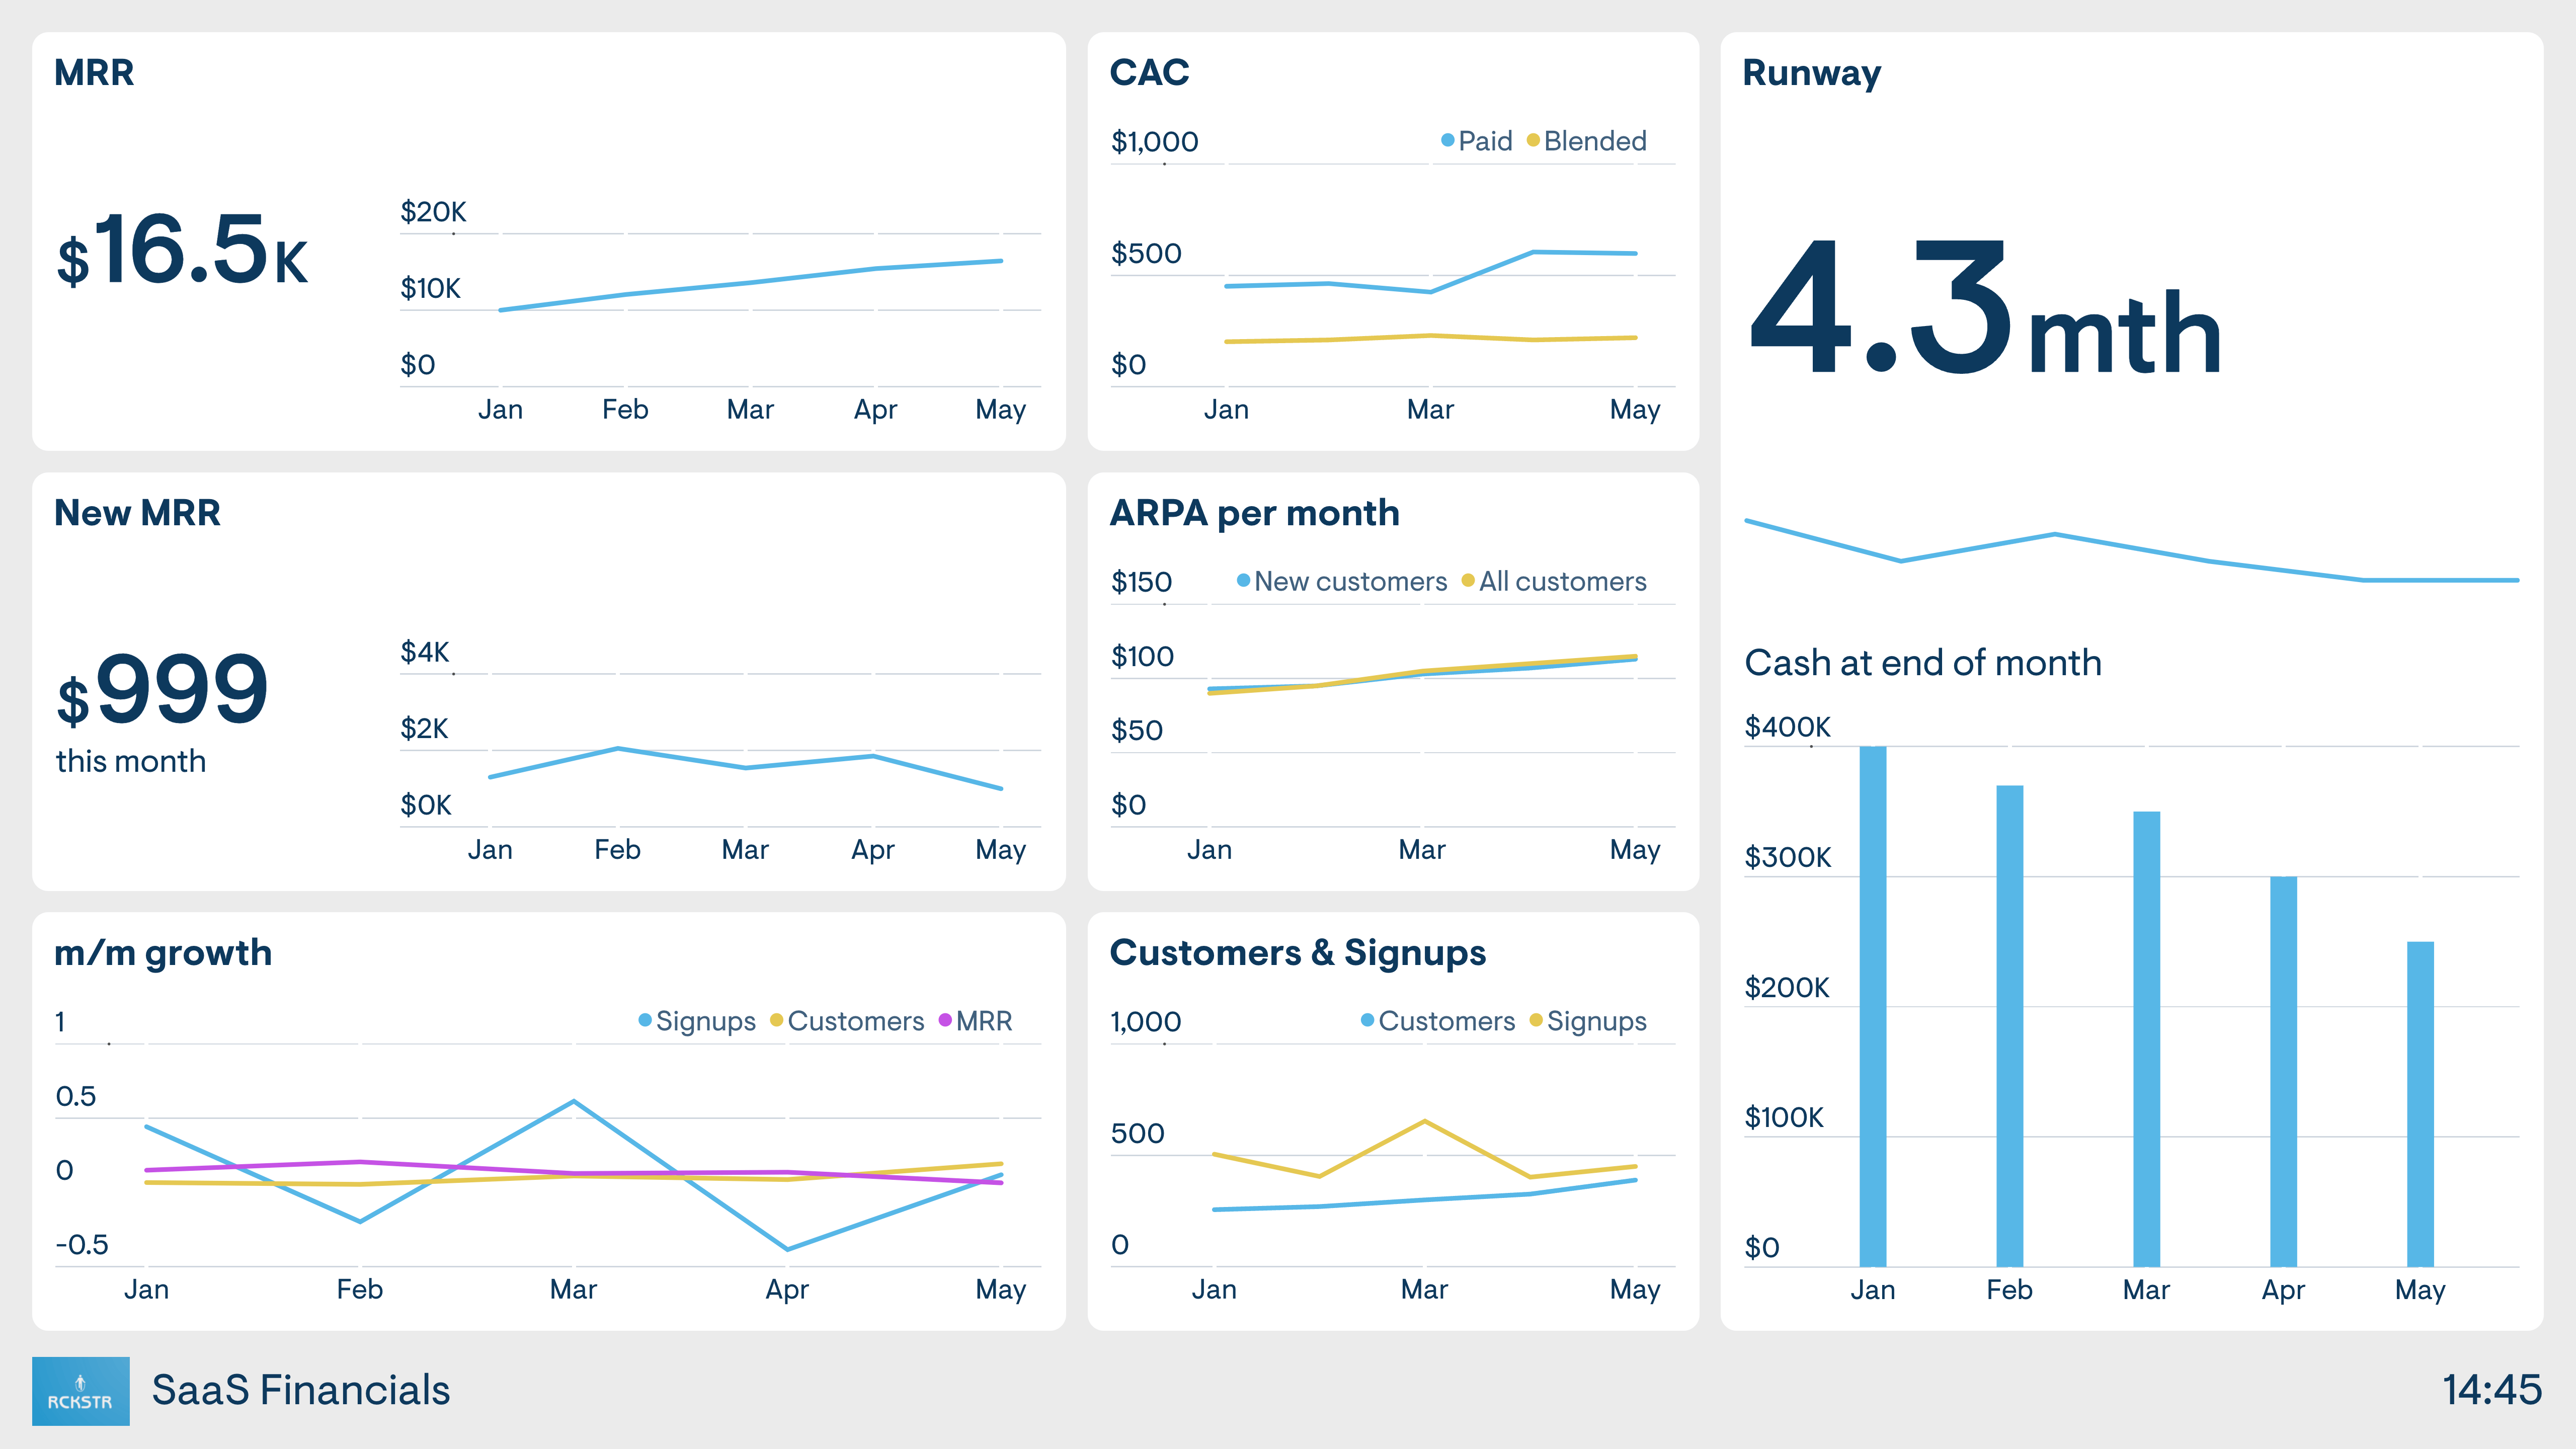
Financial reporting and analysis form a large part of any finance team’s day-to-day responsibilities. However, when it comes to communicating high-level financial information to the rest of the organization, it can be challenging to present this data in an easily digestible way.
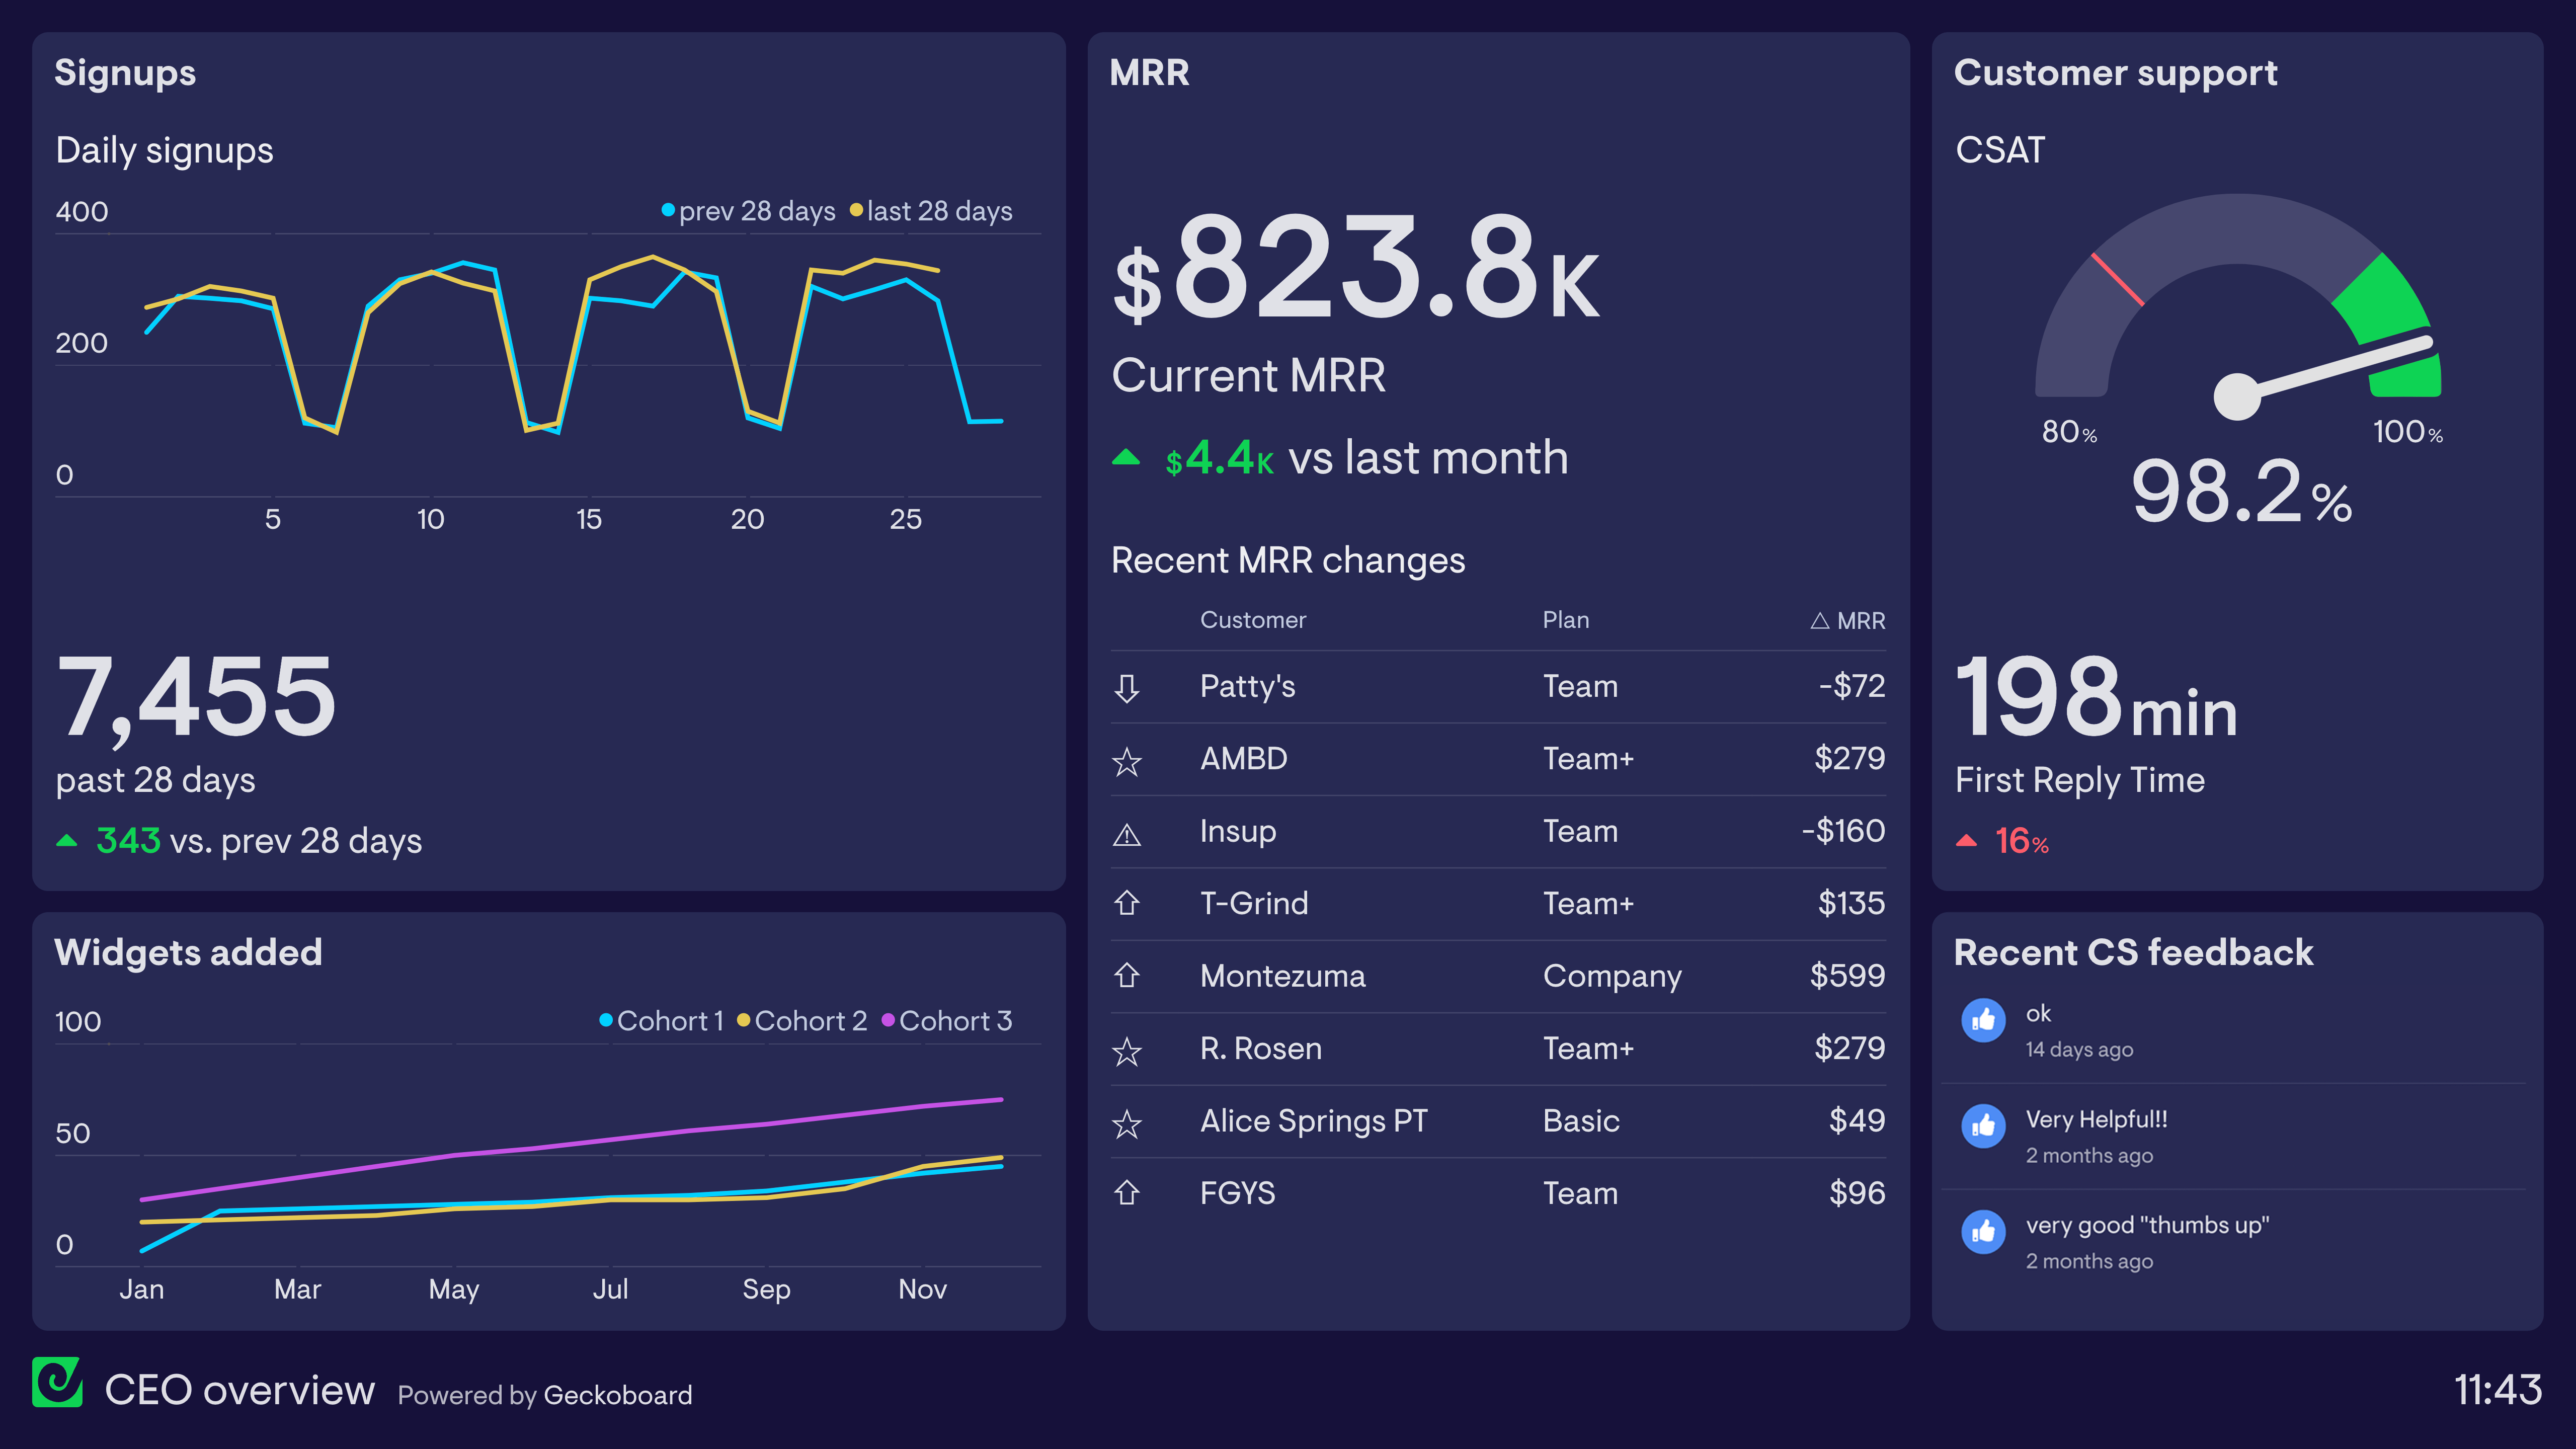
This dashboard visualizes the company’s most important financial KPIs in a way where the rest of the organization can build up a familiarity and understanding of the company’s financial health. By regularly seeing the company finances, they become more generally aware of how and when they change. This leads to a much more nuanced understanding of company finances at every level of the business.
Company dashboard
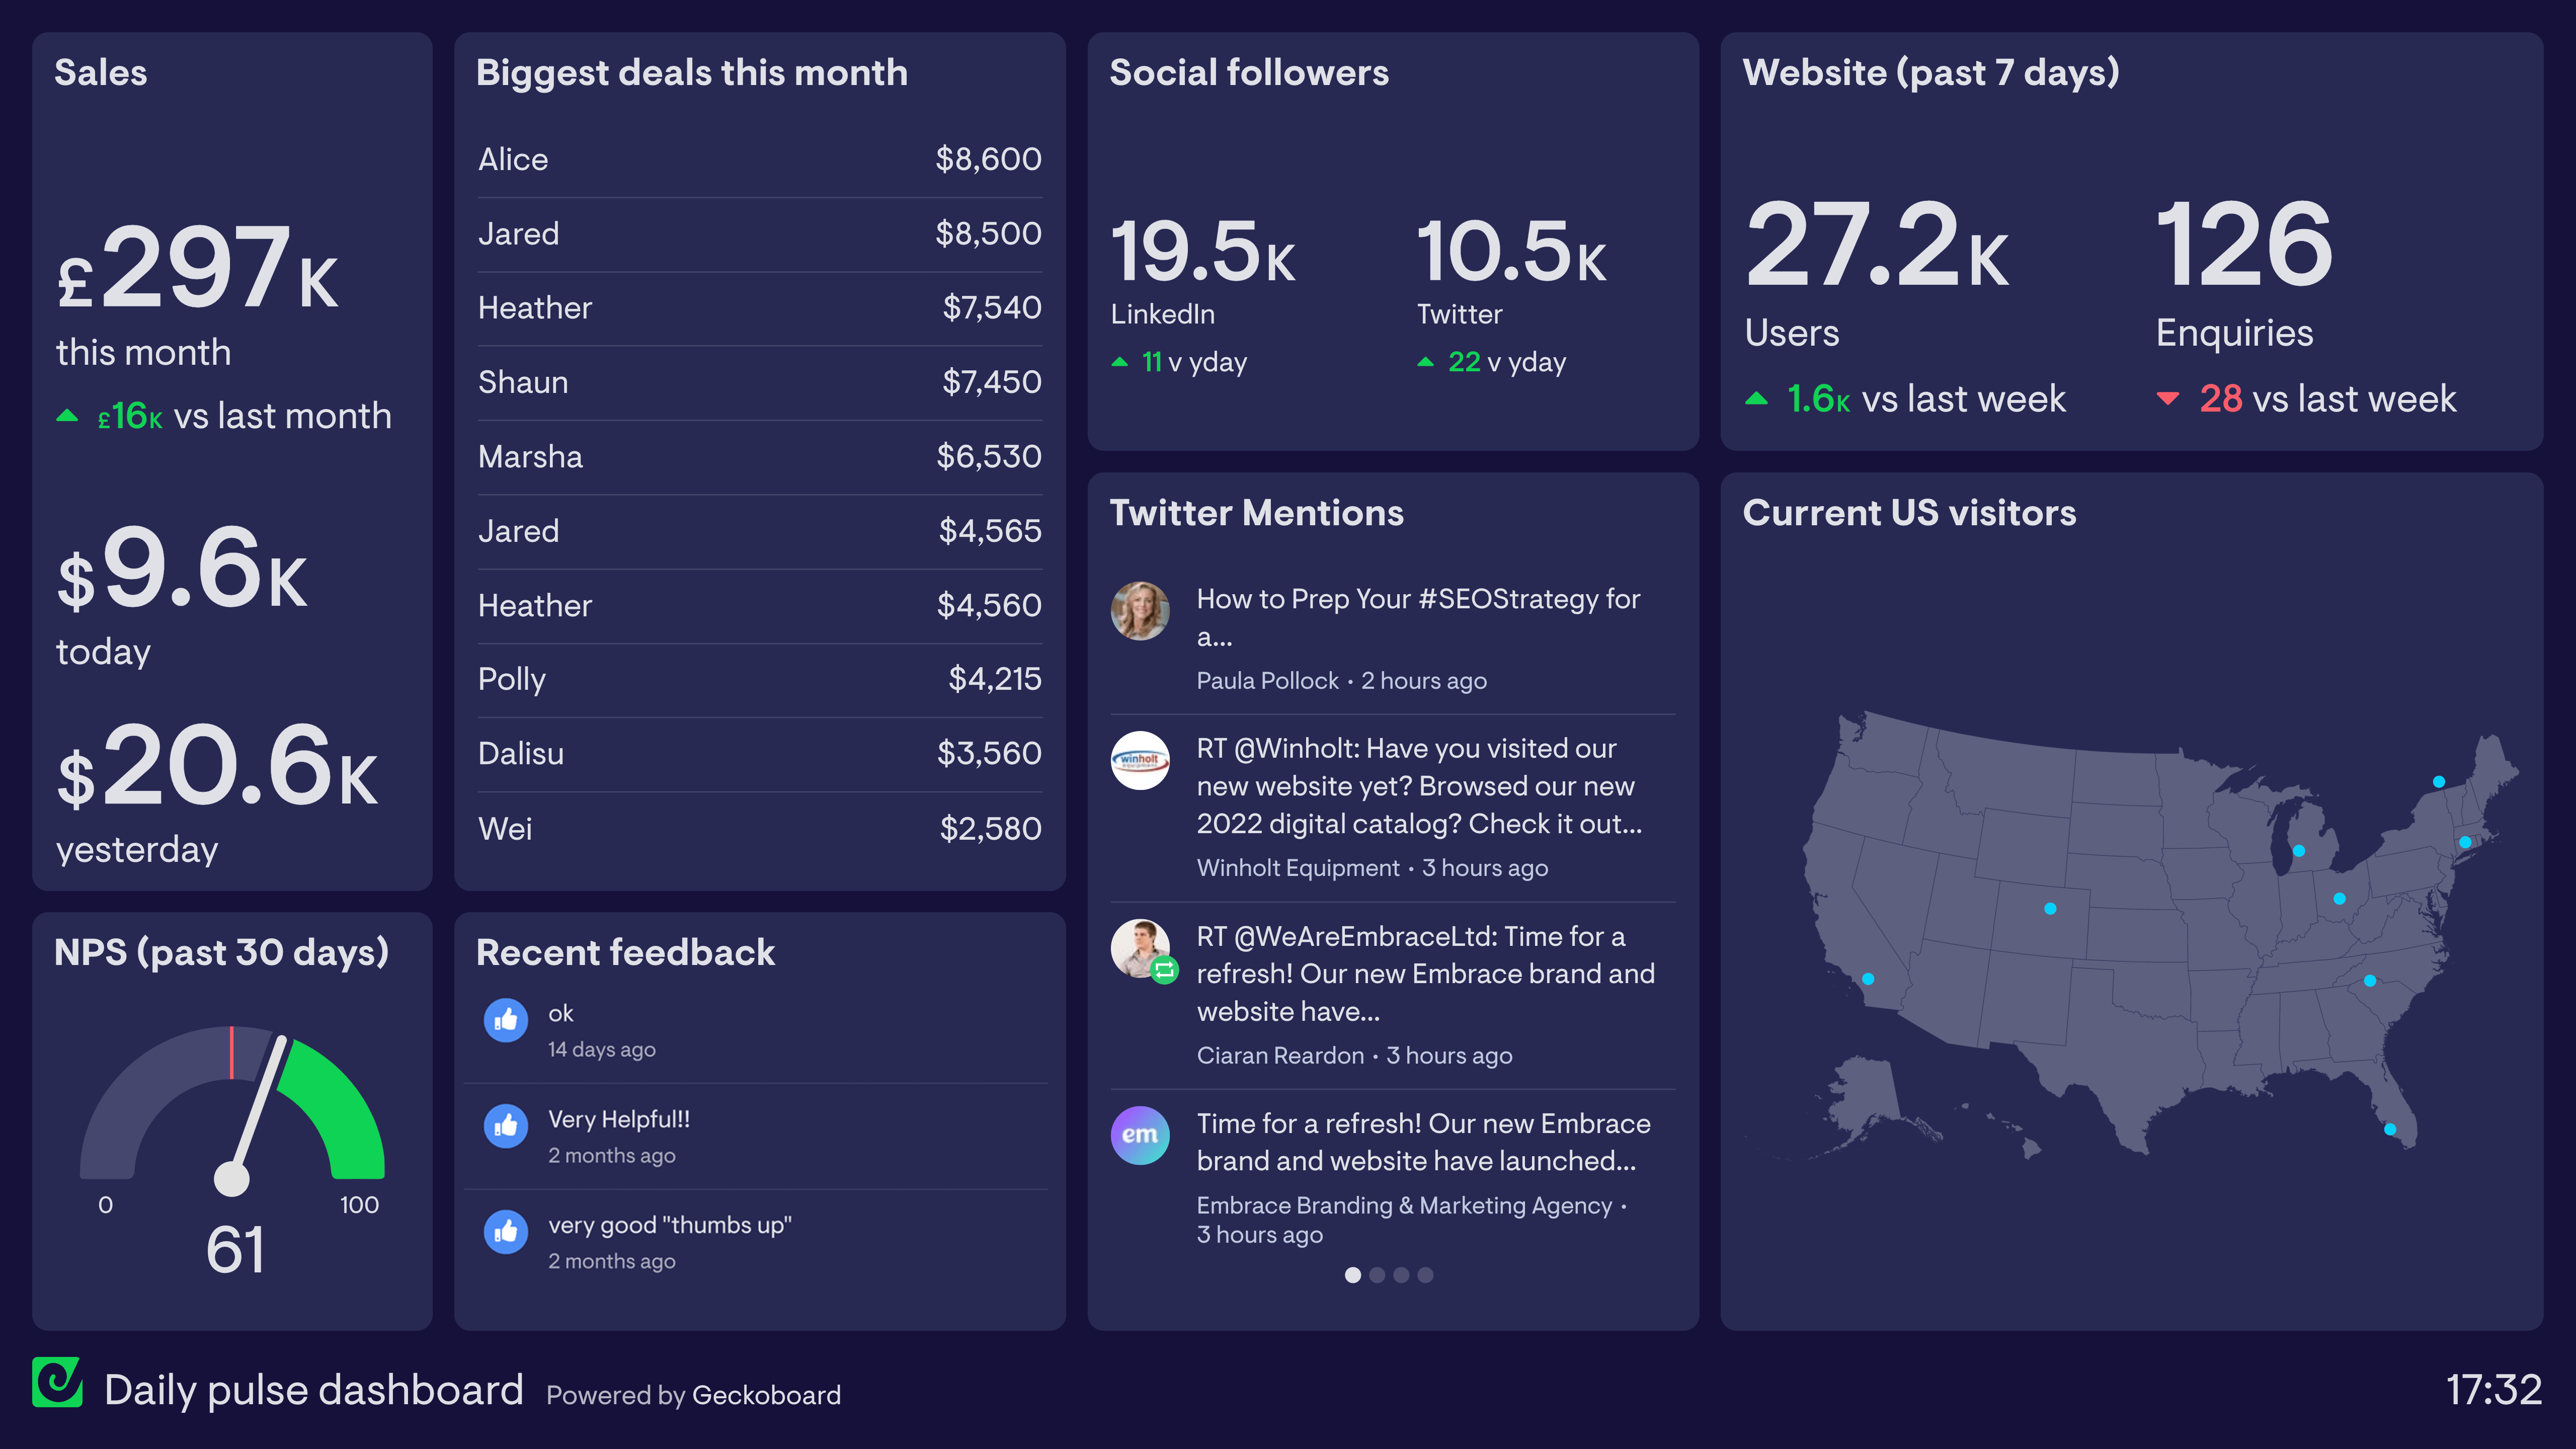
This digital dashboard is designed to be used by the whole company and is displayed on a large TV in the office where everyone can see it. It tracks important metrics from different areas of the business including sales, customer support and marketing. It also includes real time customer feedback and social media mentions.
Dashboards like these can help to create a sense of common purpose within a company. They also create the watercooler effect, where team members spot new developments and discuss them, informally. This can spark people’s curiosity and promote a more data-oriented culture.

A digital dashboard consolidates data from multiple business tools into a single, real-time view — covering marketing, sales, ecommerce, finance, or any combination. It's used by managers and executives who need to see cross-functional performance without logging into four different platforms to get the full picture.
Geckoboard is a dashboard tool that connects to 90+ data sources — from CRM and finance to ecommerce and support — to give businesses a live view of performance across teams. Dashboards can be displayed on office screens or shared across the organisation as links or automated snapshots.
Digital dashboards are customisable by function: marketing teams track campaigns and traffic, sales teams track pipeline and revenue, and finance teams track cash flow and MRR. Executive versions combine the most important KPIs from each department.
Building a custom digital dashboard is straightforward with Geckoboard's dashboard builder. Connect whichever tools are most relevant to your use case — popular choices include Salesforce, Google Analytics, Shopify, and HubSpot, then pick your metrics and build the view you need. Share with your team as a TV dashboard, shared link, or scheduled snapshot. Start a free trial or learn more about how Geckoboard works.
Use it to bring data together from all the tools your business runs on into one shared view. A digital dashboard also helps automate reporting — replacing the time-consuming task of compiling weekly summaries from multiple sources into a single manual report.