CFO dashboard examples
A CFO dashboard gives a Finance Director or Chief Financial Officer a live view across the metrics that define the business's financial health — revenue, margins, cash, and forecasts. It supports both day-to-day oversight and longer-term planning without needing to pull a custom report each time.
Forecast dashboard
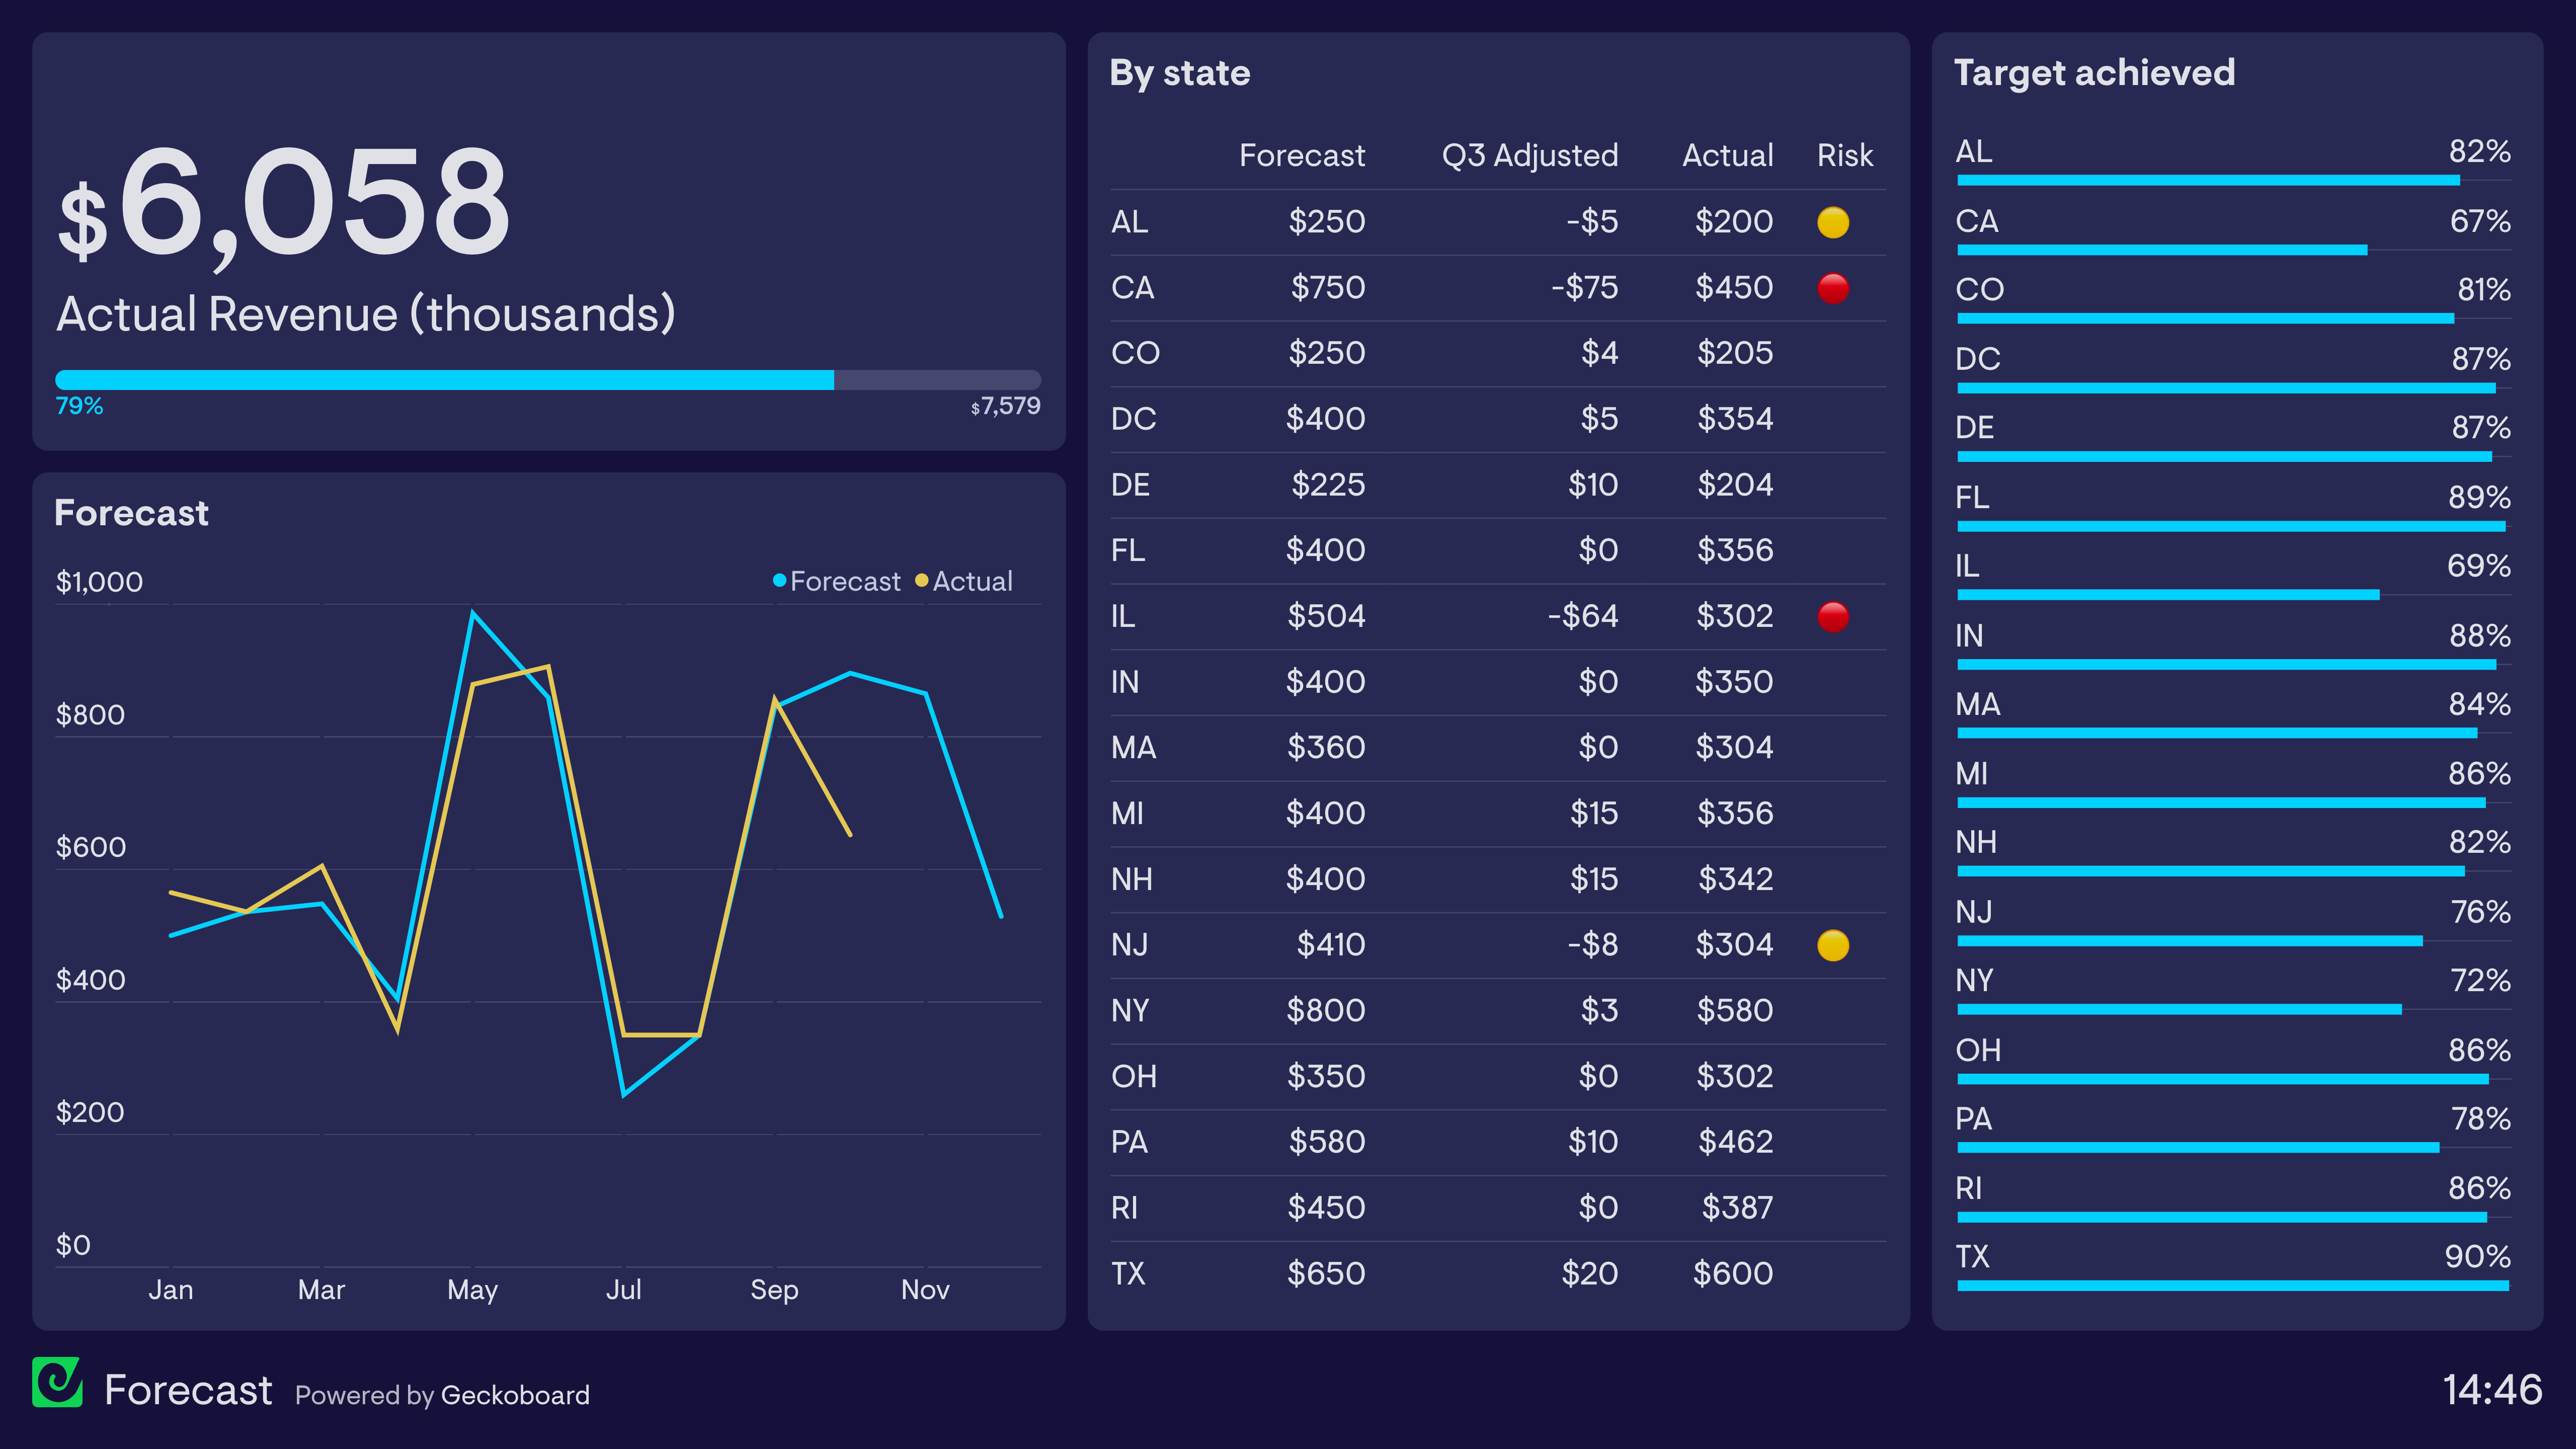
This dashboard is used by the CFO to understand how individual teams (based in different states) are performing against budgeted revenue projections for the year. The total budgeted revenue for the year is $7.579 million and they have so far achieved $6.058 million. (Figures in the dashboard are displayed in multiples of 1000, which is a common practice in accounting).
In the bottom left corner, we can also see how revenue is tracking against the forecast. Forecasts are created at the start of the financial year and normally updated every quarter. By creating a realistic forecast, a business can better understand if they are ahead or behind budget in relation to where they would expect to be at that time of year.
In the middle section, the CFO is tracking the performance of individual teams in different states. They are using a dot chart system to flag any teams which are at risk of not hitting their target for the year. Two teams are high risk, and are looking unlikely to reach their target. Finally, on the right, we can see all teams' current revenue performance as a proportion of their target revenue for the year.
Browse other popular examples
A CFO dashboard gives the chief financial officer a consolidated view of financial forecasts, budget vs. actuals, and key SaaS financial metrics. It helps CFOs track financial health in real time and walk into board meetings with current data — rather than a static snapshot that was accurate a week ago.
Geckoboard is a dashboard tool that connects to financial platforms, spreadsheets, and databases to give finance leaders a live view of the numbers that matter. It removes the need to pull data from multiple sources each time leadership needs a current picture of the business.
Common metrics include MRR, ARR, gross margin, burn rate, cash runway, LTV, CAC, churn, and forecast accuracy. CFOs of SaaS companies often add cohort revenue analysis and subscription growth metrics.
Building a custom CFO dashboard is straightforward with Geckoboard's dashboard builder. Connect Baremetrics, Google Sheets, and SQL databases and custom data sources to centralise billing, forecast, and custom financial data, then pick your metrics and build the view you need. Share with your team as a TV dashboard, shared link, or scheduled snapshot. Start a free trial or learn more about how Geckoboard works.
Use it to deliver executive visibility into financial performance without waiting for quarterly finance packs to be assembled. It also helps bring data together from billing, accounting, and planning tools so the CFO has one authoritative view of business finances.