Helpdesk dashboard examples
A helpdesk dashboard gives service desk teams — whether supporting customers or internal staff — a live view of ticket volume, response times, and performance against KPIs. It keeps the team aware of where things stand without having to run reports from the ticketing platform.
Helpdesk dashboard
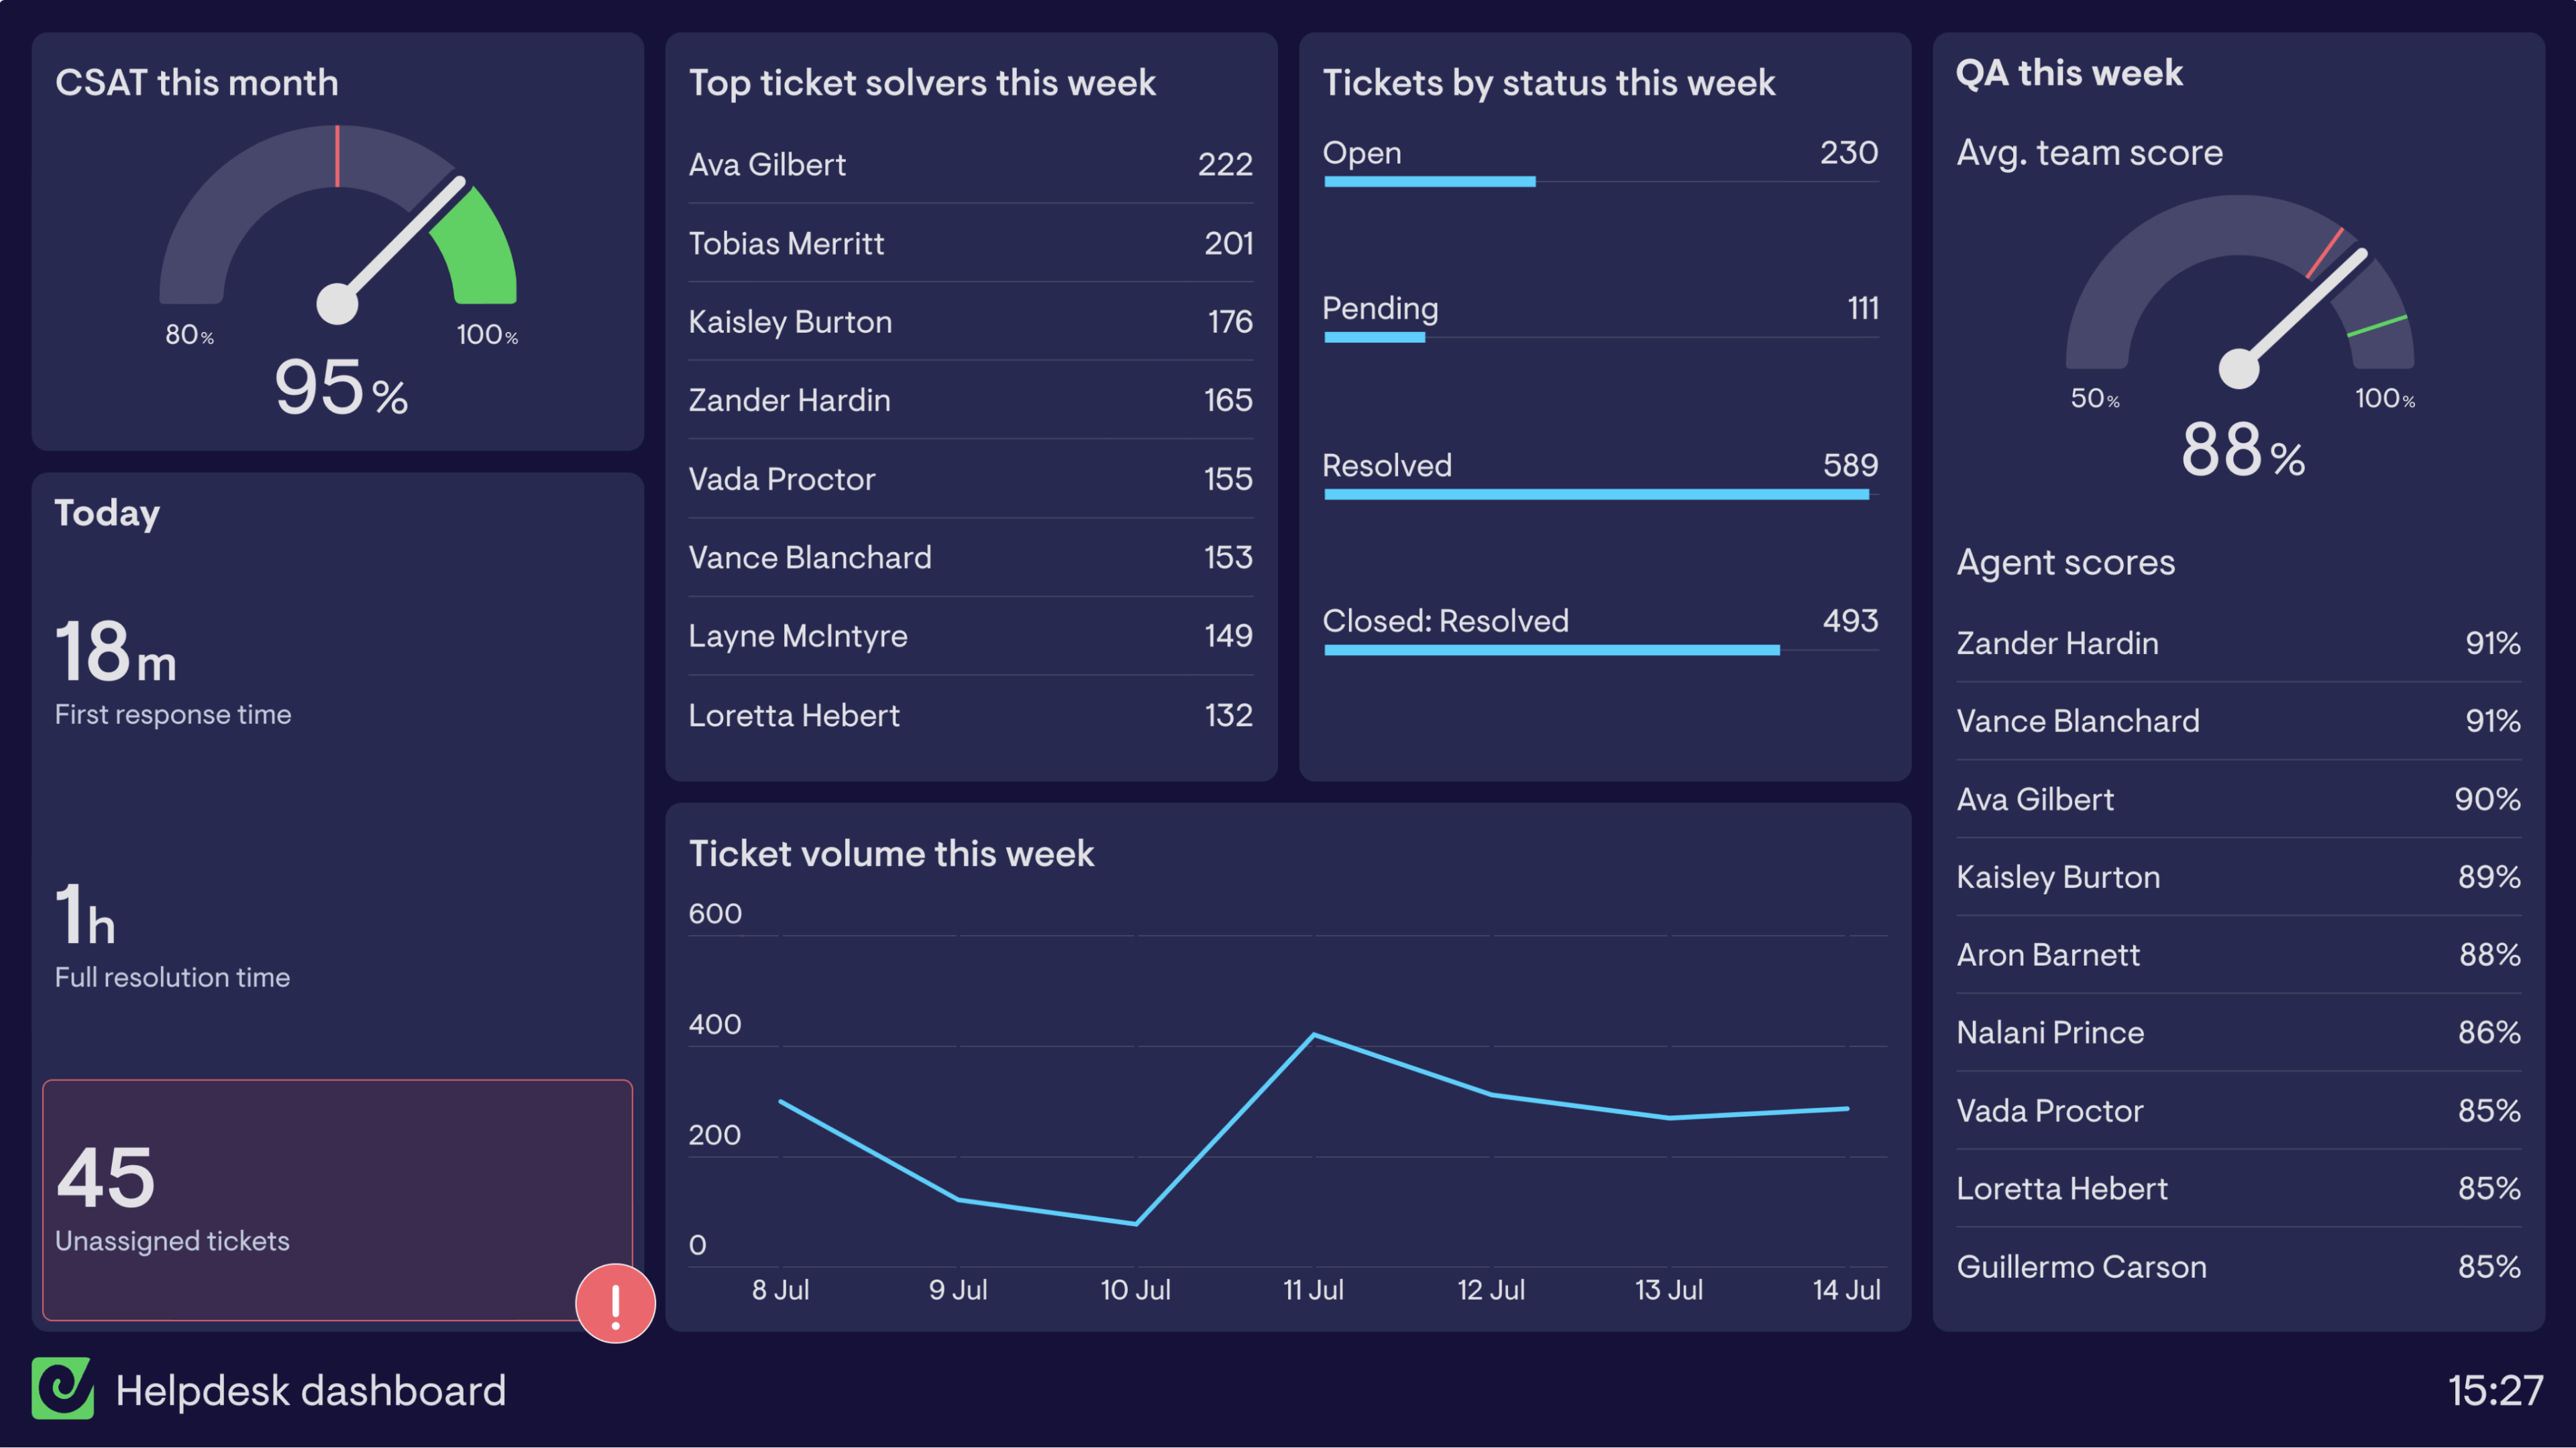
This dashboard takes data from Freshdesk to highlight how the whole helpdesk team is performing against their KPIs. The focus for this team is the quality of the interactions they’re having, Customer Satisfaction Score (CSAT) is their most important metric. This helpdesk dashboard also keeps a close eye on First Response Time and Full Resolution Time as the team have found these metrics are critical to providing a positive customer experience.
In order to ensure high quality conversations, the team also shares Quality Assurance (QA) data generated through peer reviews in Klaus. The dashboard shows the average QA scores for individual agents and the whole team.
IT Service Desk dashboard
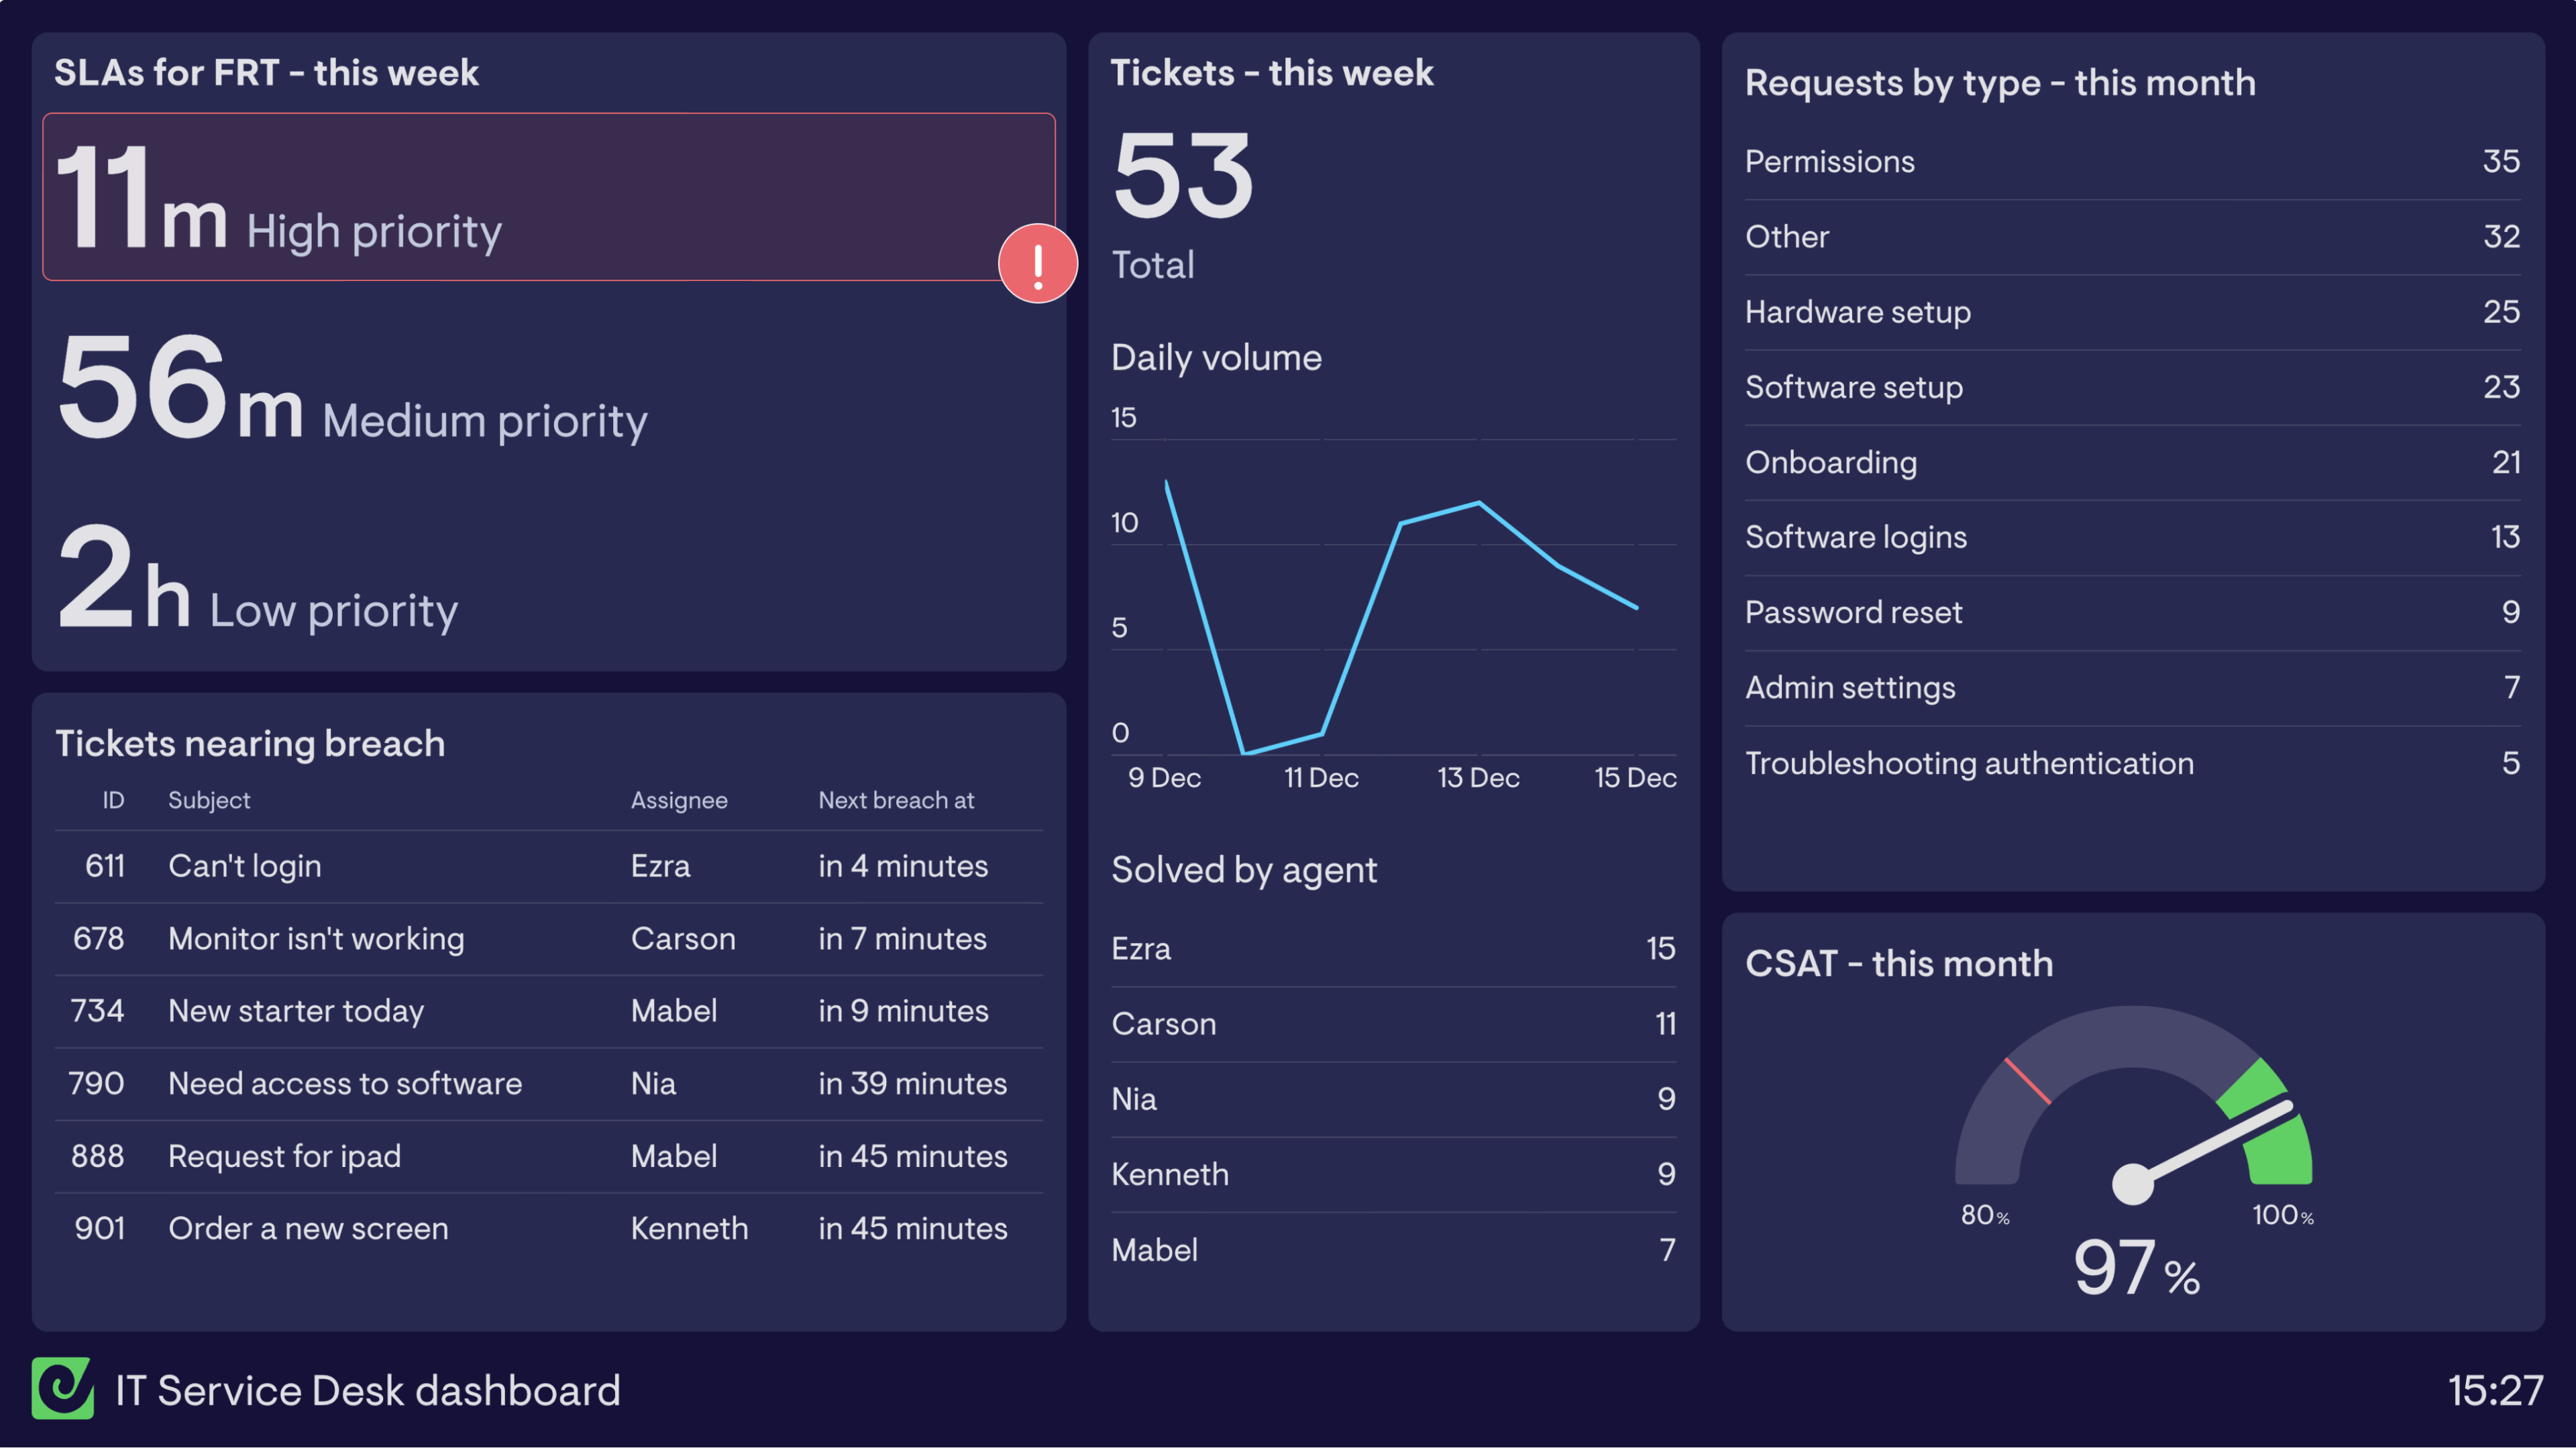
The IT Service Desk team in this example provides technical support to staff members, internally. They use this dashboard to monitor their performance against Service Level Agreements (SLAs), ticket volume, the different types of technical requests and their CSAT score. The data for these metrics comes from Zendesk Support.
They’ve broken down First Response Time (FRT) SLA targets by priority to ensure the most urgent tickets are responded to first. They’ve also included a table highlighting tickets about to breach, which allows the Service Desk Manager to monitor any upcoming potential breaches and help agents resolve issues quickly.
Help Scout dashboard
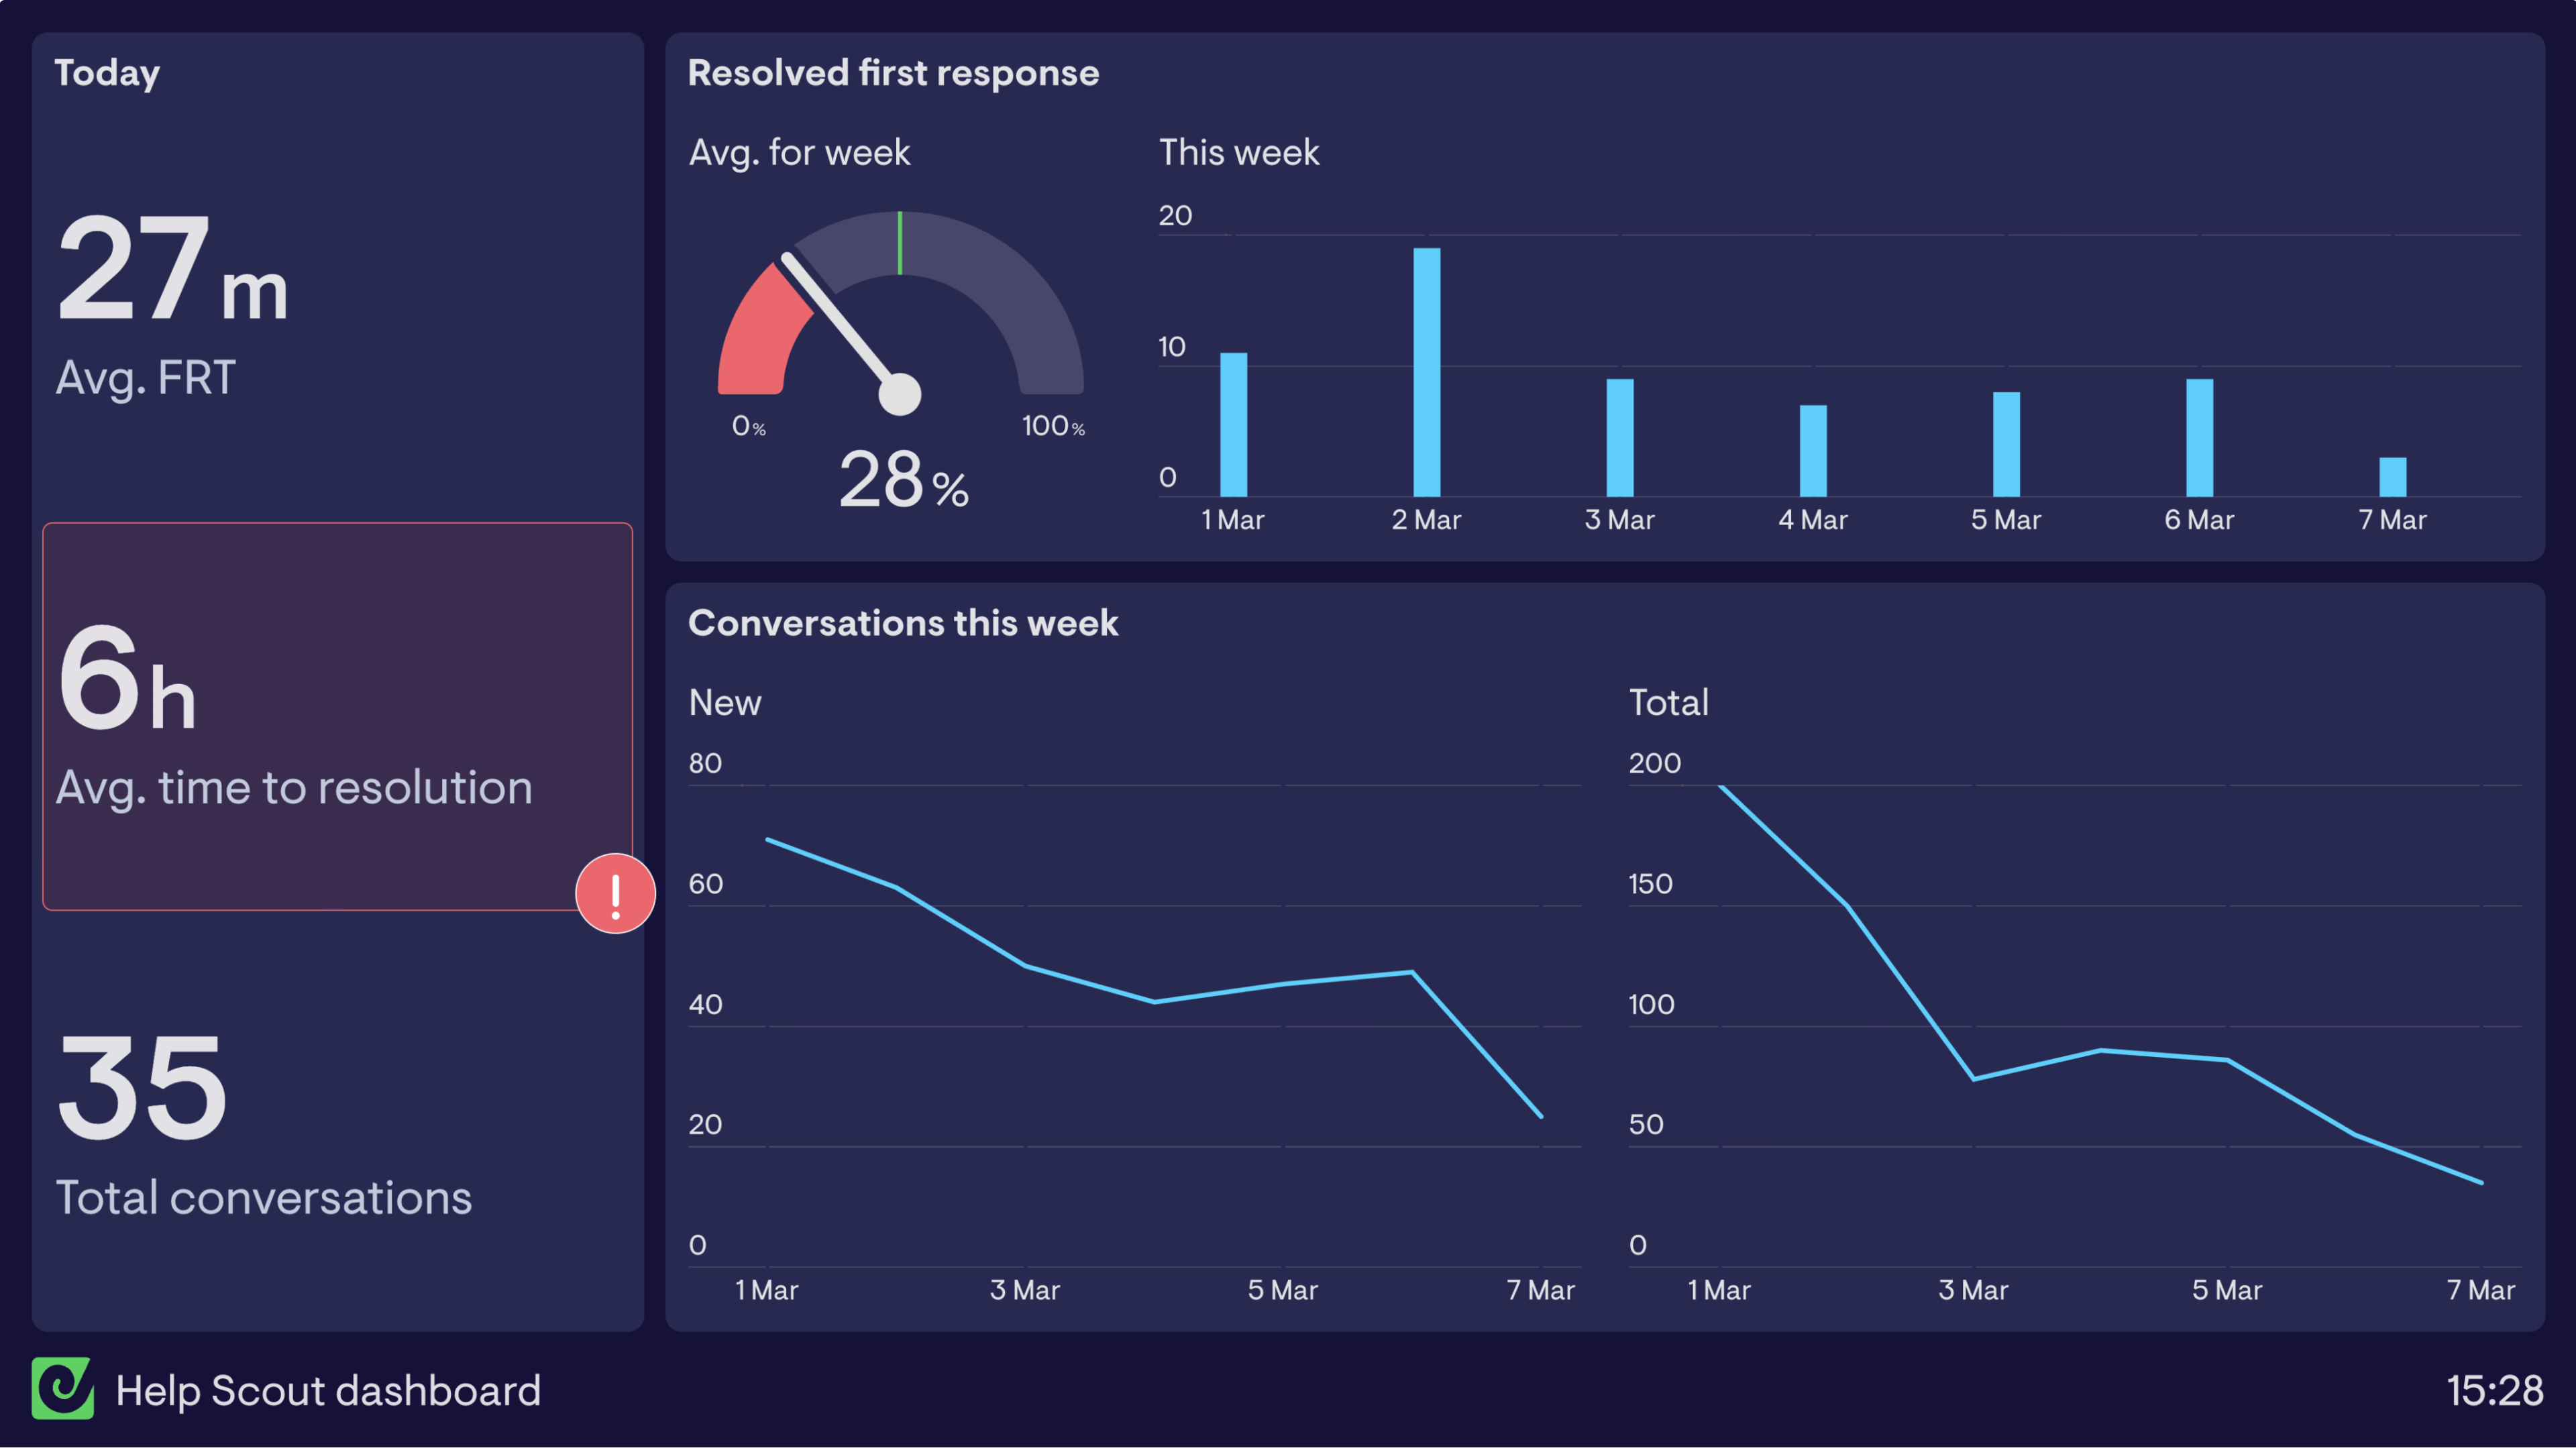
This dashboard allows the helpdesk team and manager to see an overview of performance for the day and the week. An area of focus for the whole team is first response; they’re tracking both daily average First Response Time (FRT) and tickets resolved after the first response. It’s their goal to deliver faster customer service overall.
All the data included in this dashboard comes from Help Scout.
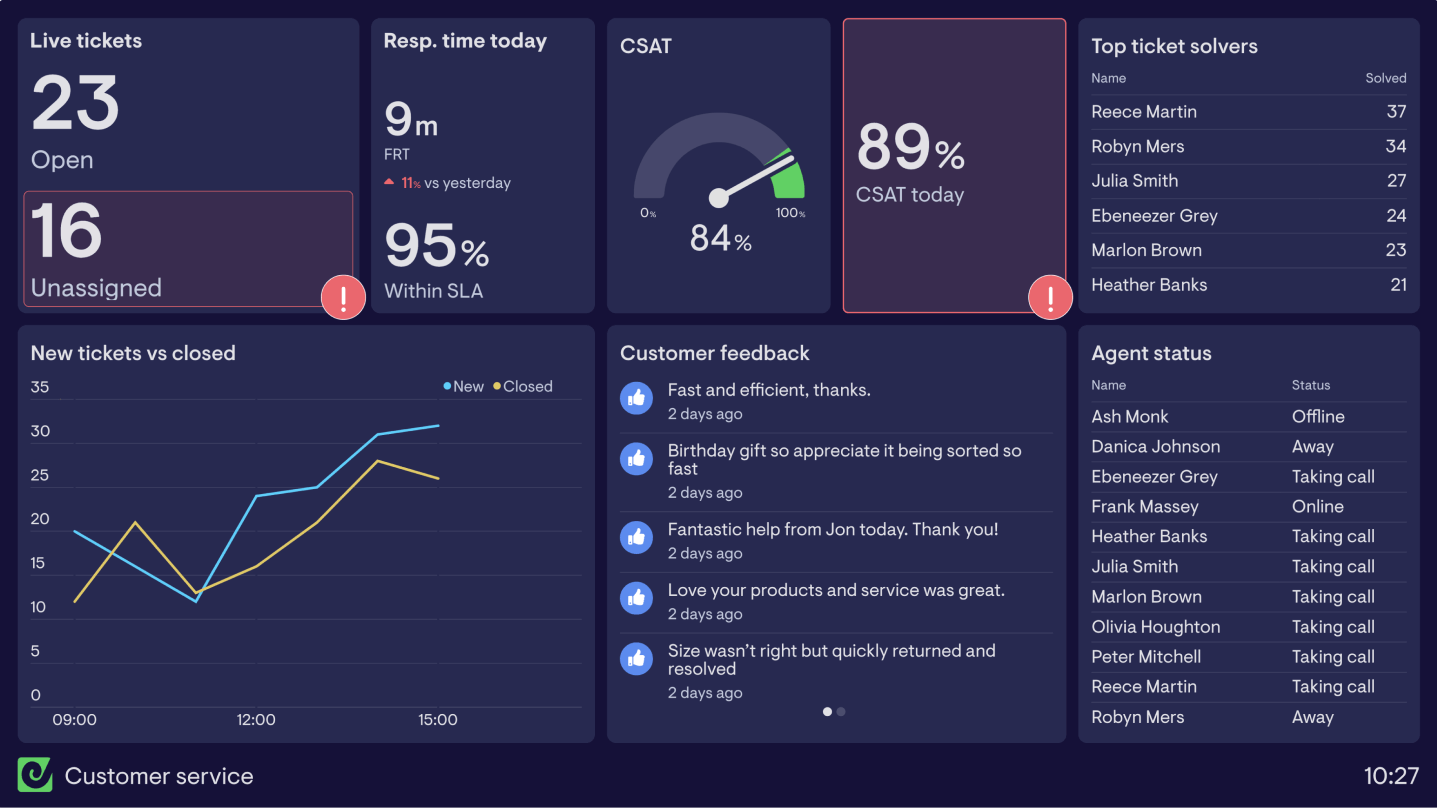
Freshdesk dashboard
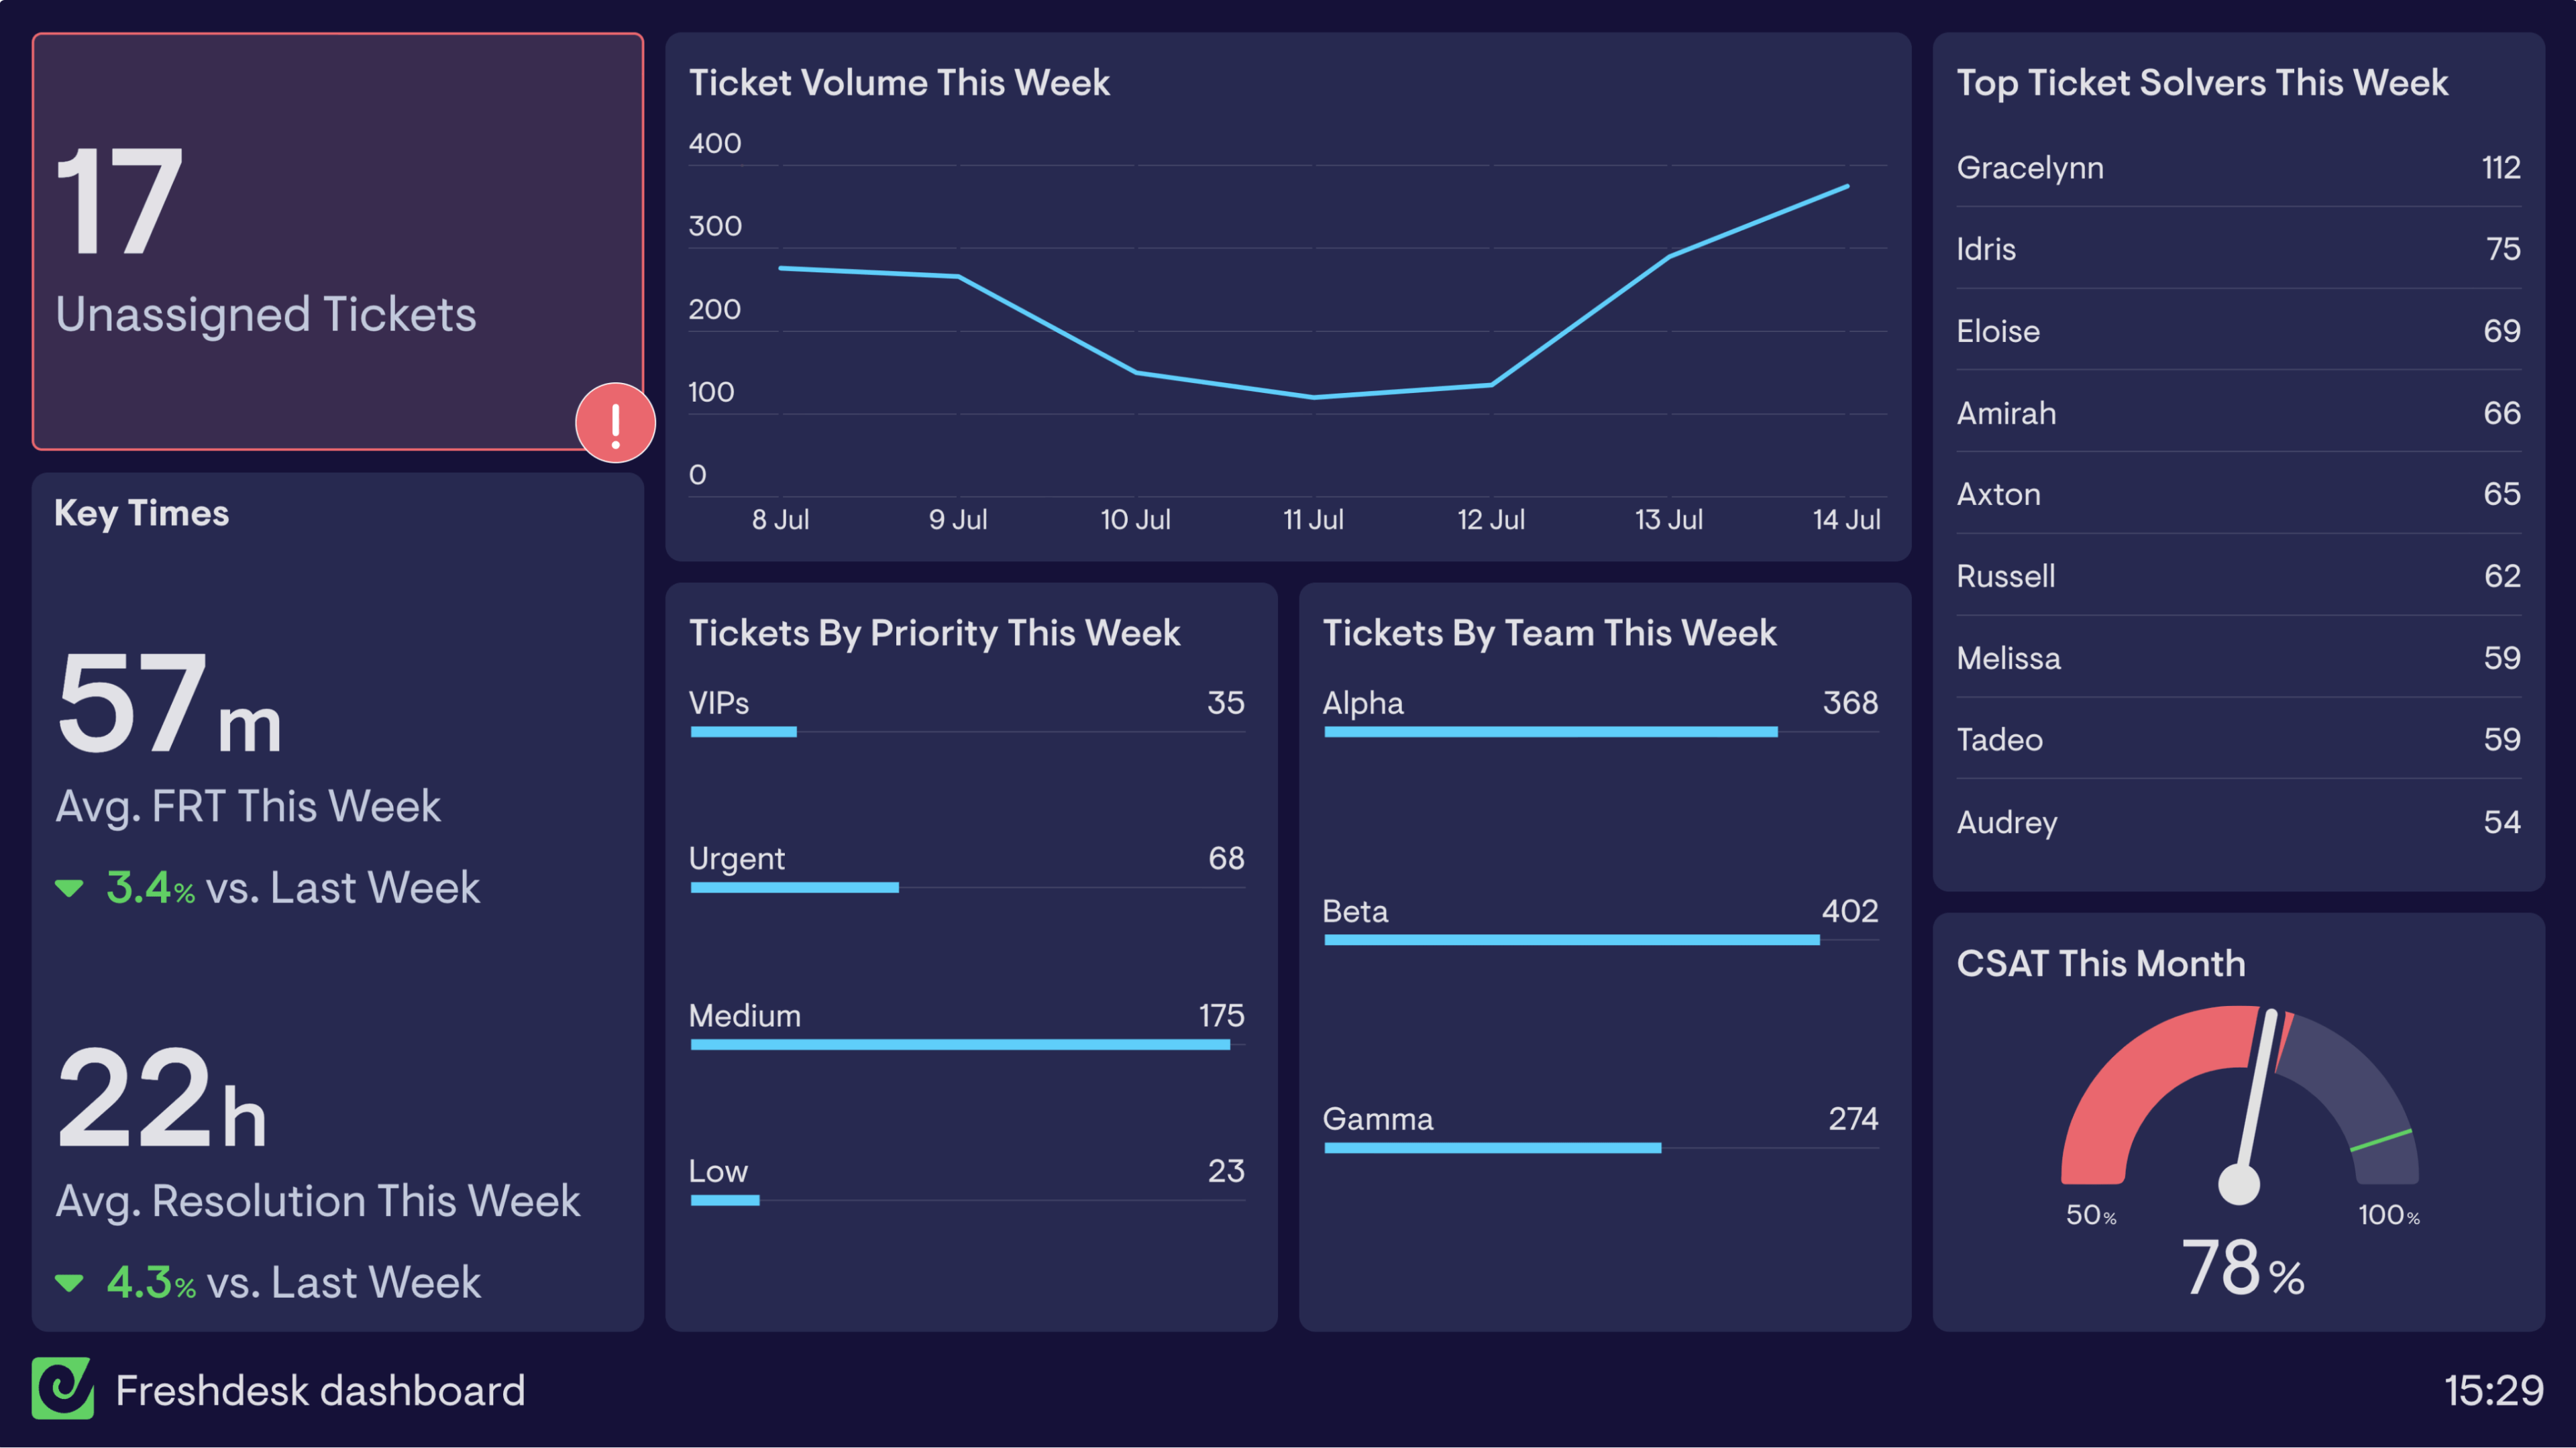
This Freshdesk dashboard allows the Helpdesk Manager to manage team workflows and get an overall picture of how the team is performing. Using data from Freshdesk, tickets are broken down into priority and team so that the manager can see if there is a need to redistribute workload.
The helpdesk agents view the dashboard to keep an eye on unassigned tickets, their goal is to keep this below 10, as well as maintain a good average First Response Time (FRT) and Resolution Time for the week. A leaderboard of top ticket solvers is included to help encourage friendly competition among agents.
Zendesk helpdesk dashboard
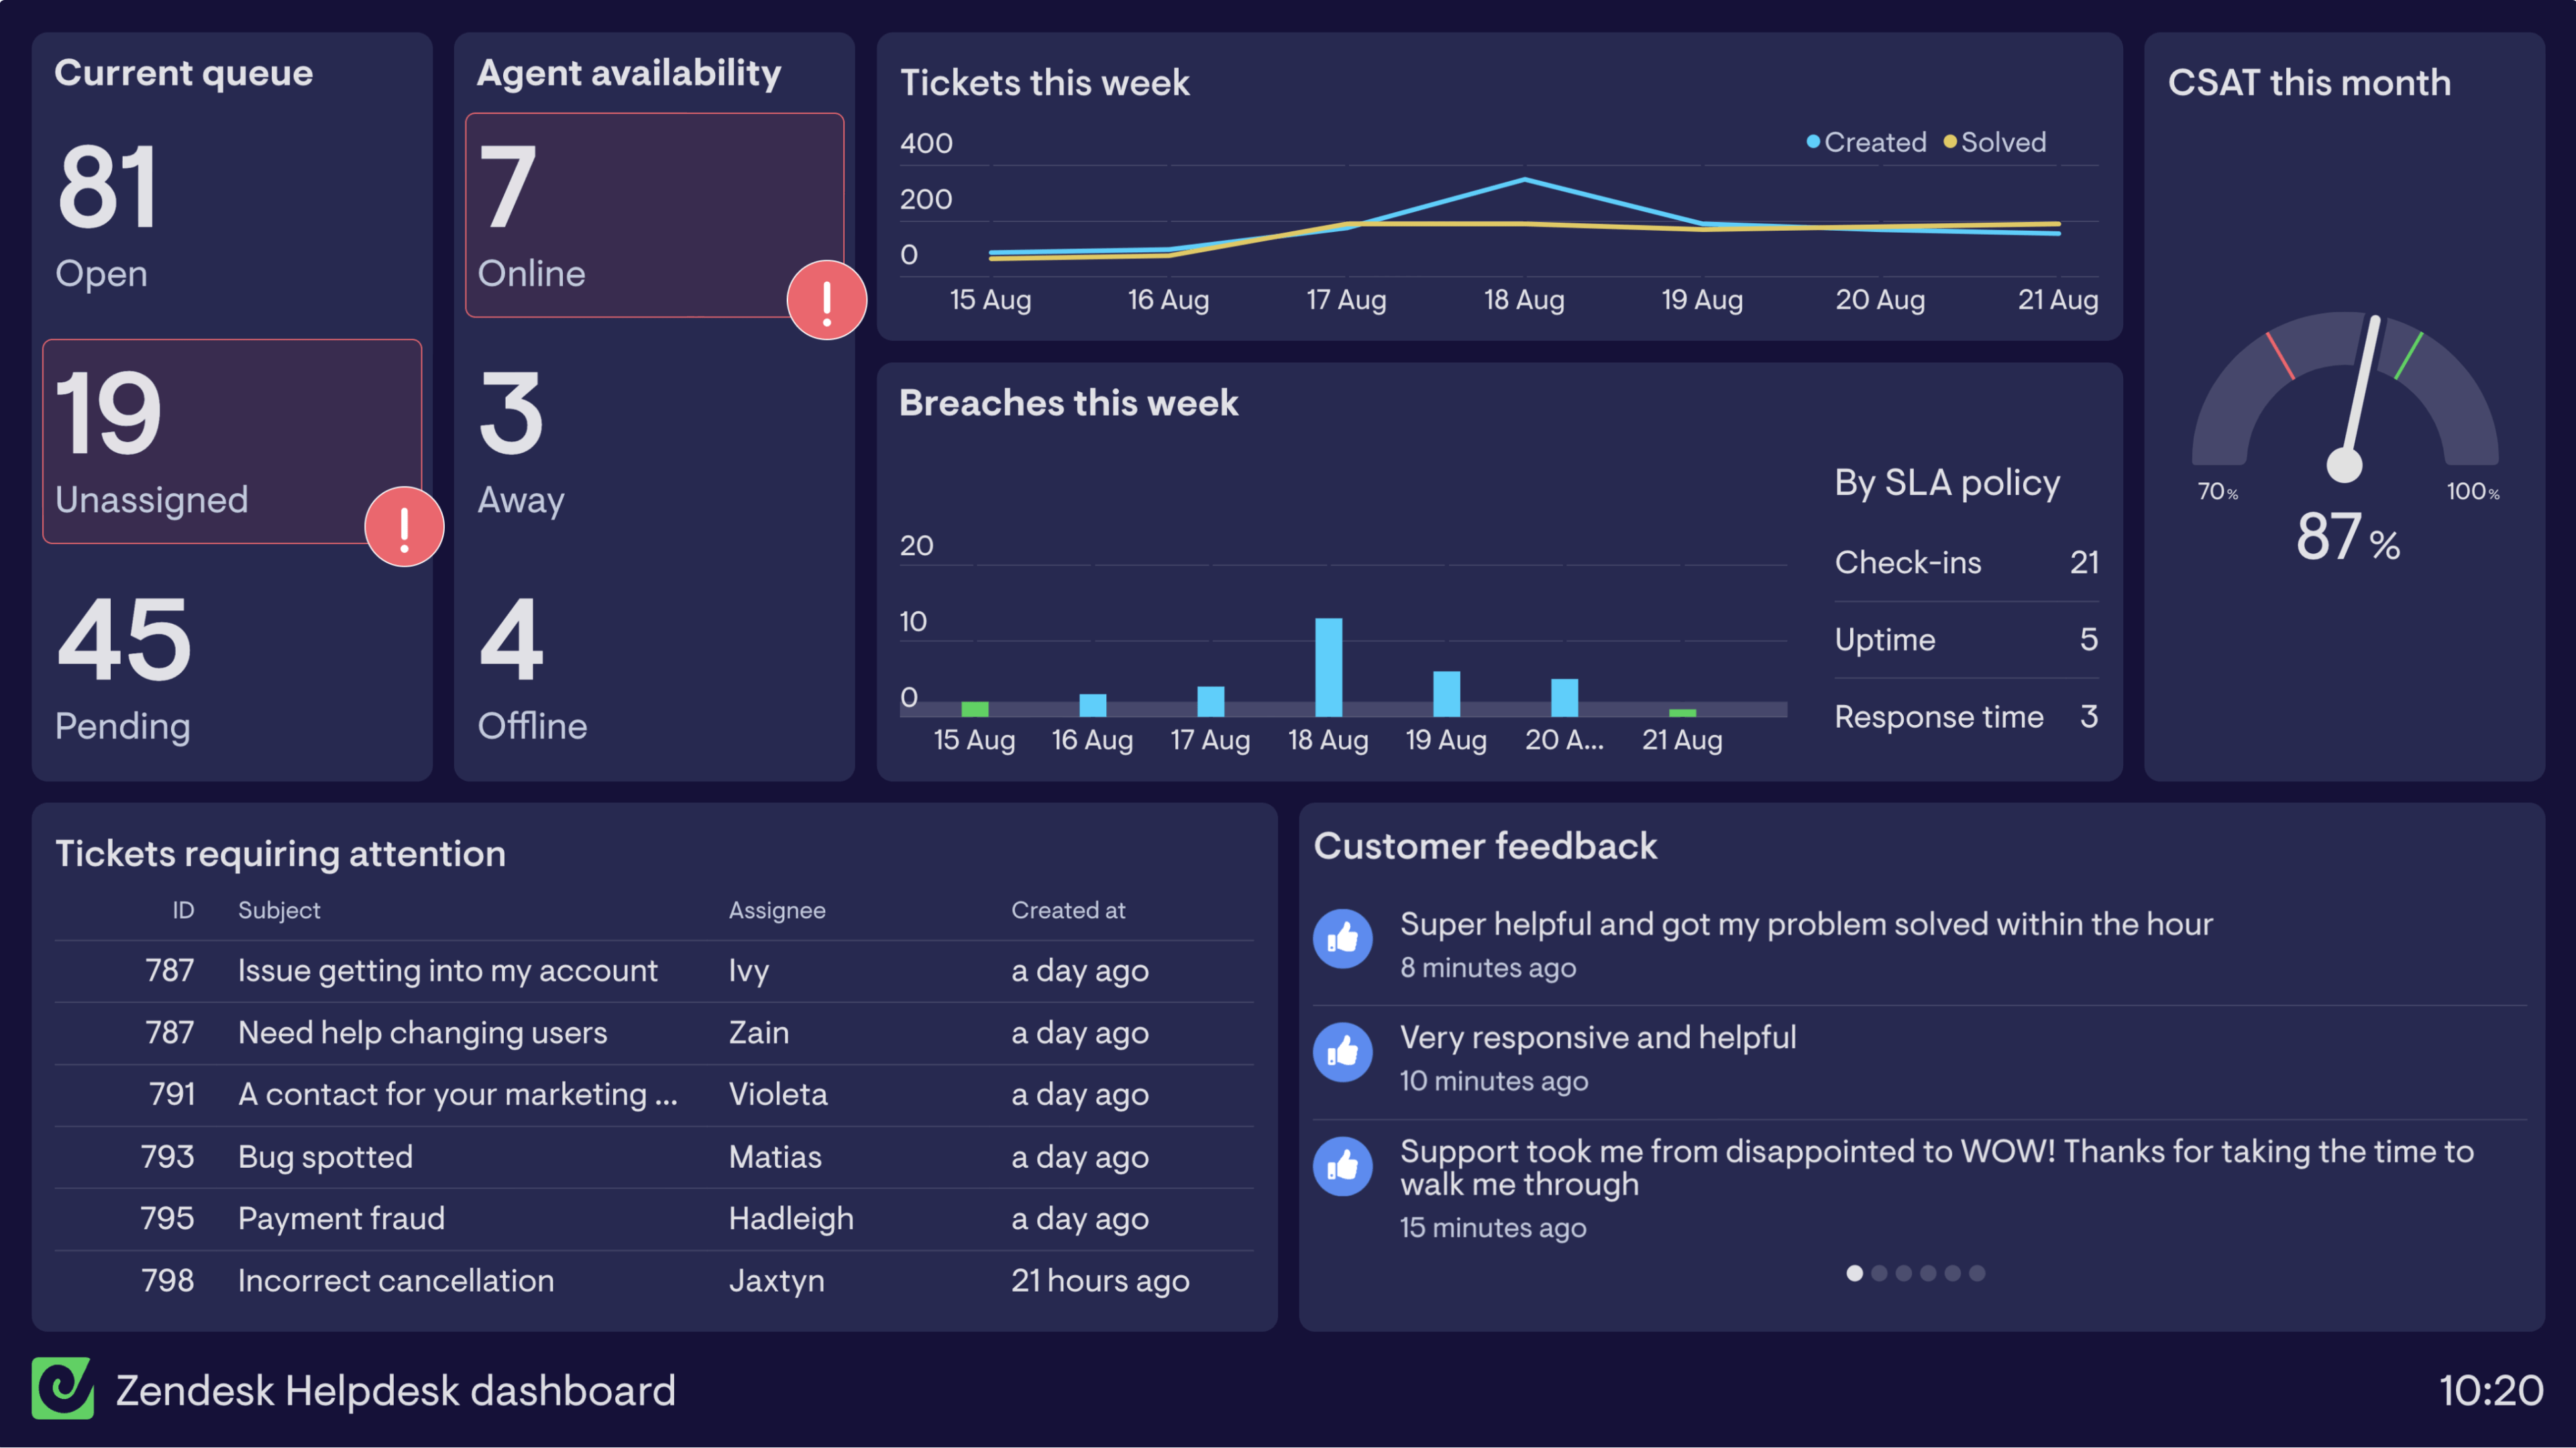
The helpdesk viewing this dashboard needs to stay on top of high volumes of tickets for a relatively small team. The dashboard is predominantly used by the Helpdesk Manager to monitor volumes, agent availability and anything causing SLA breaches. Using this dashboard, they’re able organize their workload more efficiently.
Agents also use this dashboard to monitor the state of the current queue so that they’re able to take their breaks around less busy periods in the day. Feedback is included to motivate everyone with only positive comments being displayed.
All the data on this dashboard comes from Zendesk Support.
Browse other popular examples
A helpdesk dashboard gives support managers a real-time view of ticket volume, queue status, agent performance, and customer satisfaction across their helpdesk tools. It's used by teams running IT service desks or customer support functions to track workload, spot backlogs, and keep service quality consistent.
Geckoboard is a live dashboard tool that connects to Zendesk, Freshdesk, Help Scout, and other ticketing platforms to give helpdesk teams a real-time view of service performance. Dashboards update automatically and can run on a team screen or be shared as a link with stakeholders.
Key metrics include open tickets, tickets resolved, first response time, average resolution time, SLA compliance, CSAT score, and backlog trend. IT service desks also track tickets by category and priority.
Building a custom helpdesk dashboard is straightforward with Geckoboard's dashboard builder. Connect Zendesk Support, Freshdesk, or Help Scout depending on your helpdesk platform, then pick your metrics and build the view you need. Share with your team as a TV dashboard, shared link, or scheduled snapshot. Start a free trial or learn more about how Geckoboard works.
Use it to track customer service performance live so support managers can see the queue building and redistribute workload before SLAs are breached. It also helps give agents and managers a shared view of the day and how the team is tracking against targets.