Support agent dashboard examples
A support agent dashboard shows individual agents how they're performing against their KPIs — response time, ticket volume, CSAT — so each person can manage their own numbers without waiting for a manager to tell them. Visibility creates accountability without micromanagement.
Support team leaderboard dashboard
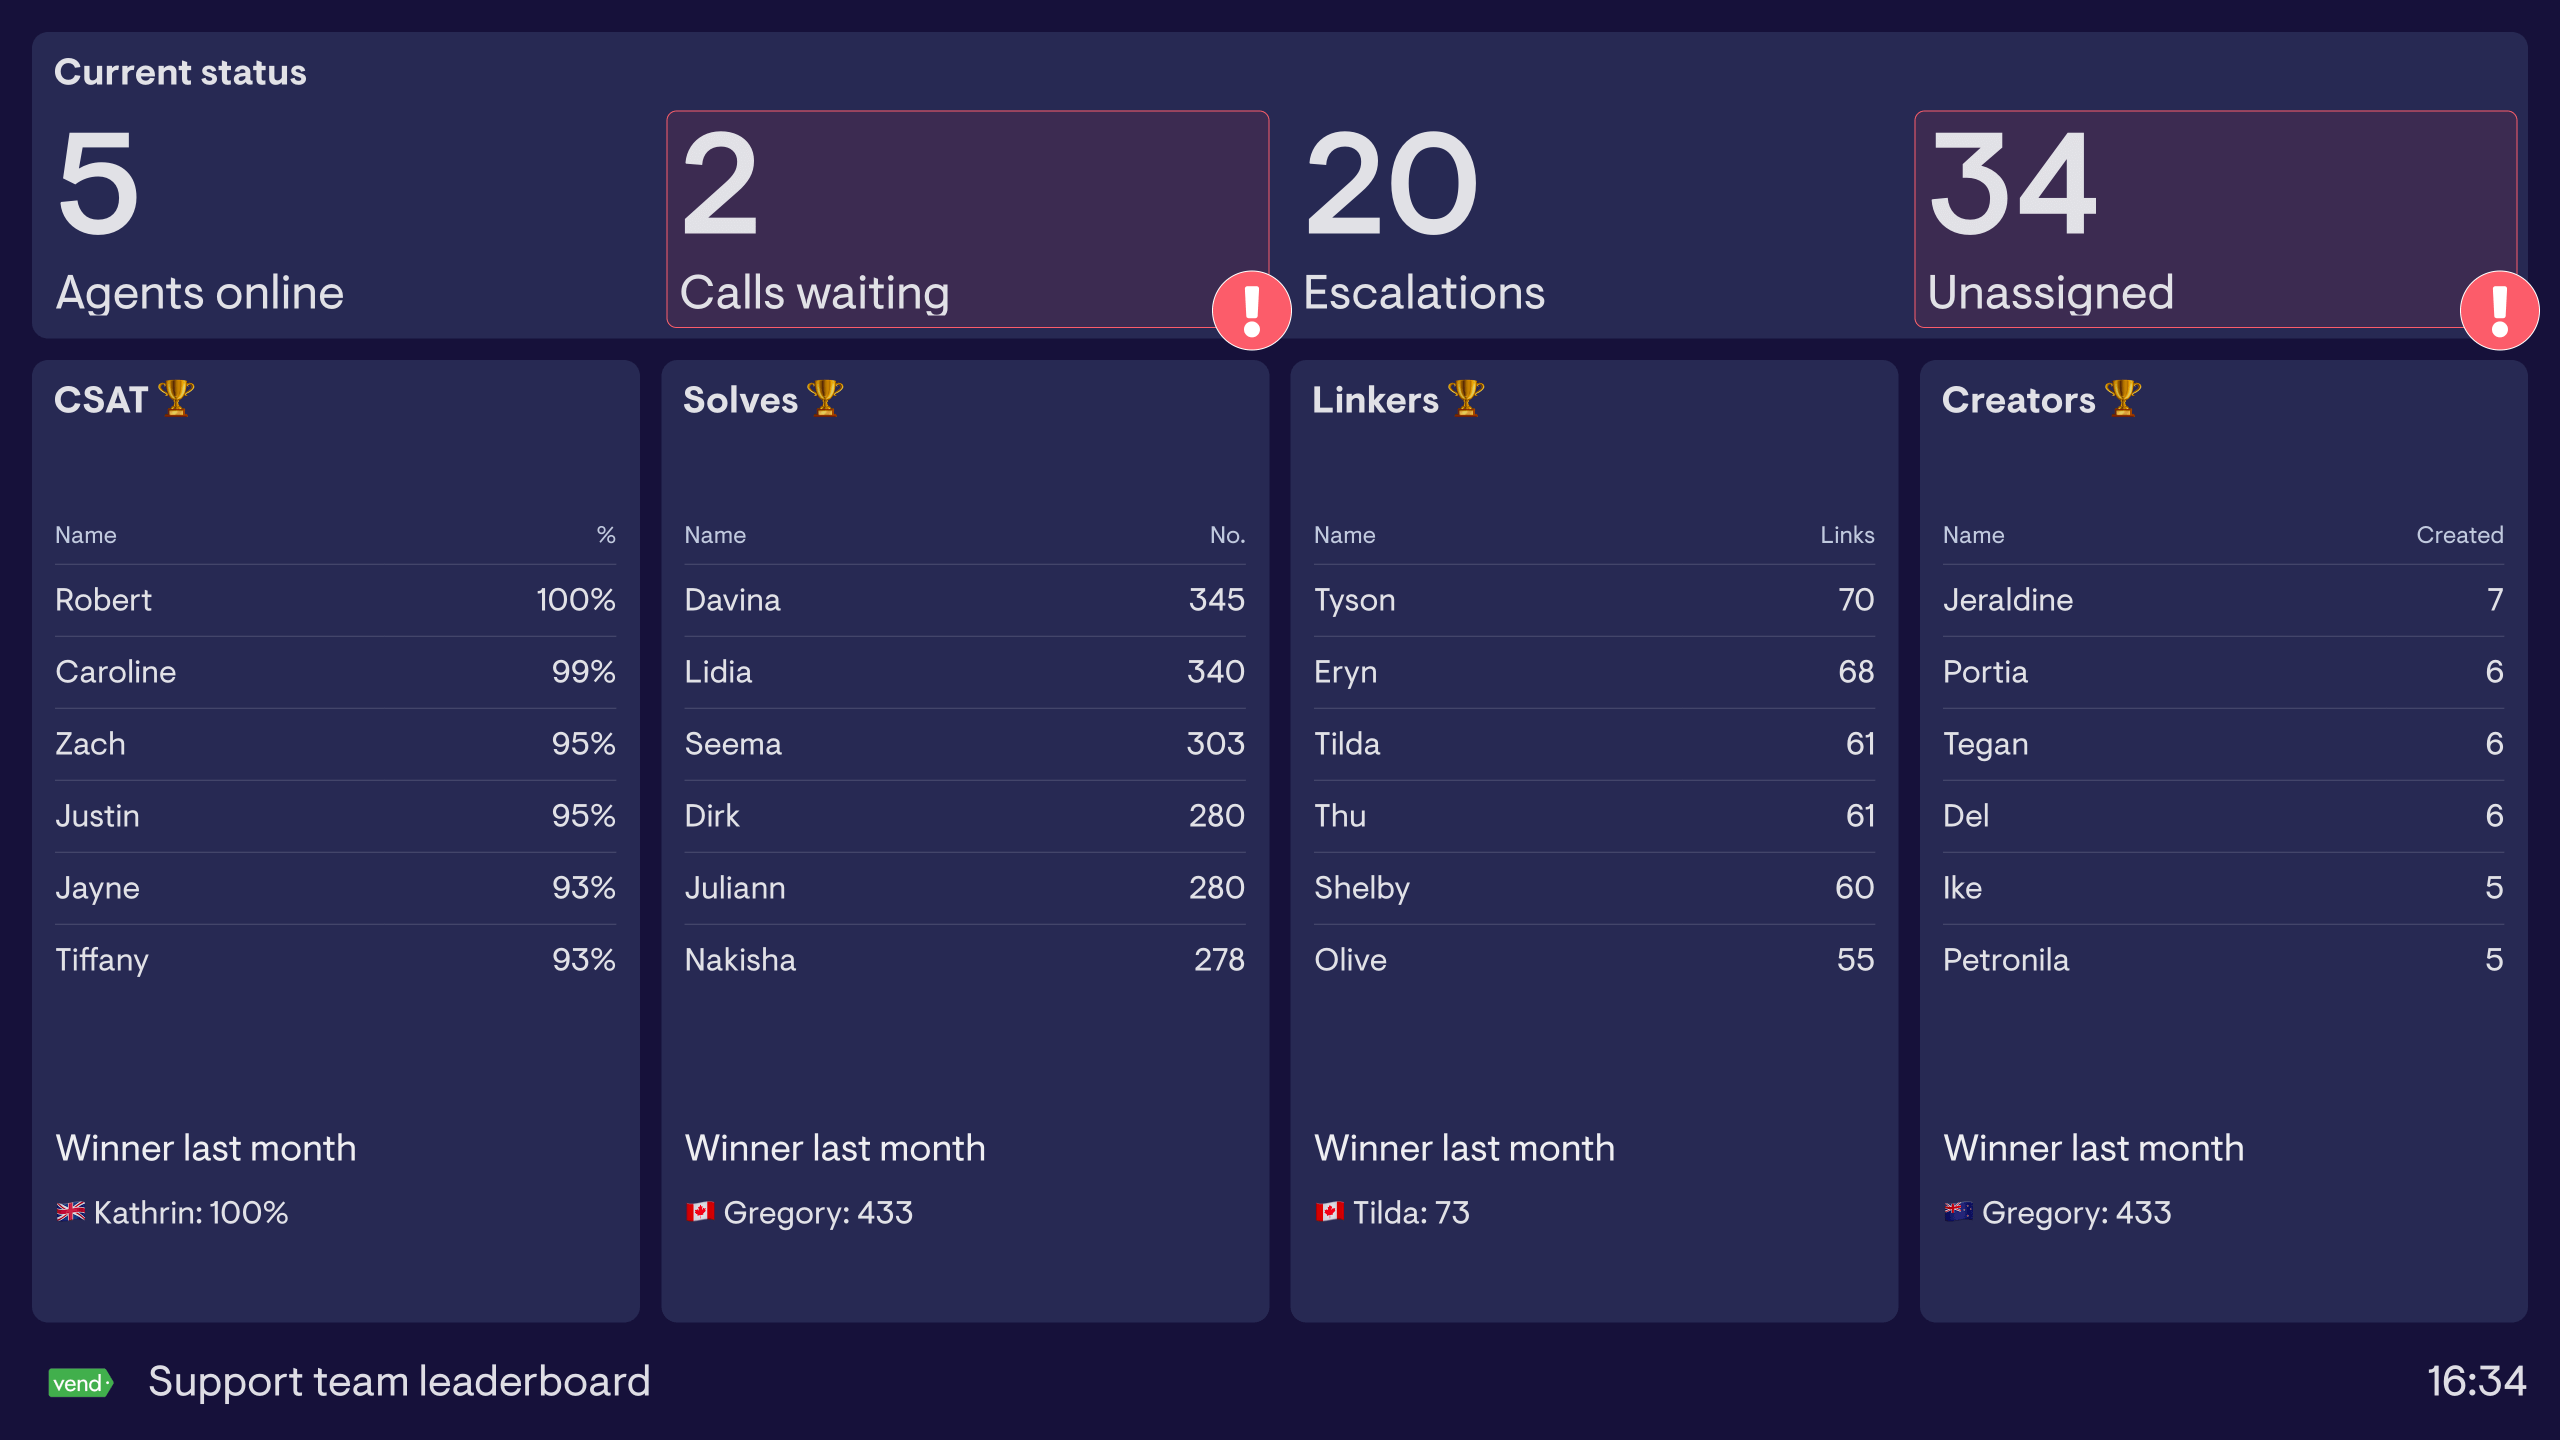
This dashboard has been created by the software company, Vend. As well as showing how different teams and individuals are working towards monthly goals, it includes a leaderboard feature, which promotes competition.
In the words of Jack Harrison-Sherlock, Vend’s Senior Continuous Improvement Lead:
“We have a sweepstake going between our offices over which team can dominate all areas of our support, so it’s a powerful way to spark a bit of friendly competition. It also improves transparency across all the teams about who’s doing what, and reminds everyone of the goal we’re all contributing to.”
“The competition this dashboard has created has evolved quite organically. One month we had someone from the Auckland office dominating three of the leaderboards, but they were denied a clean sweep by someone in the London office. This kick-started a bit of rivalry between the teams, starting with a Slack conversation about how one team thought they could beat the other. Eventually everyone decided that if one of the offices could get a clean sweep of all the leaderboards, the losing teams would treat the winning office. It hasn’t happened yet, but it’s really motivating the team.
“Also, before the dashboards, no one really knew anyone in the other offices, and the leaderboards gave everyone a way to make a name for themselves.”
Agent dashboard
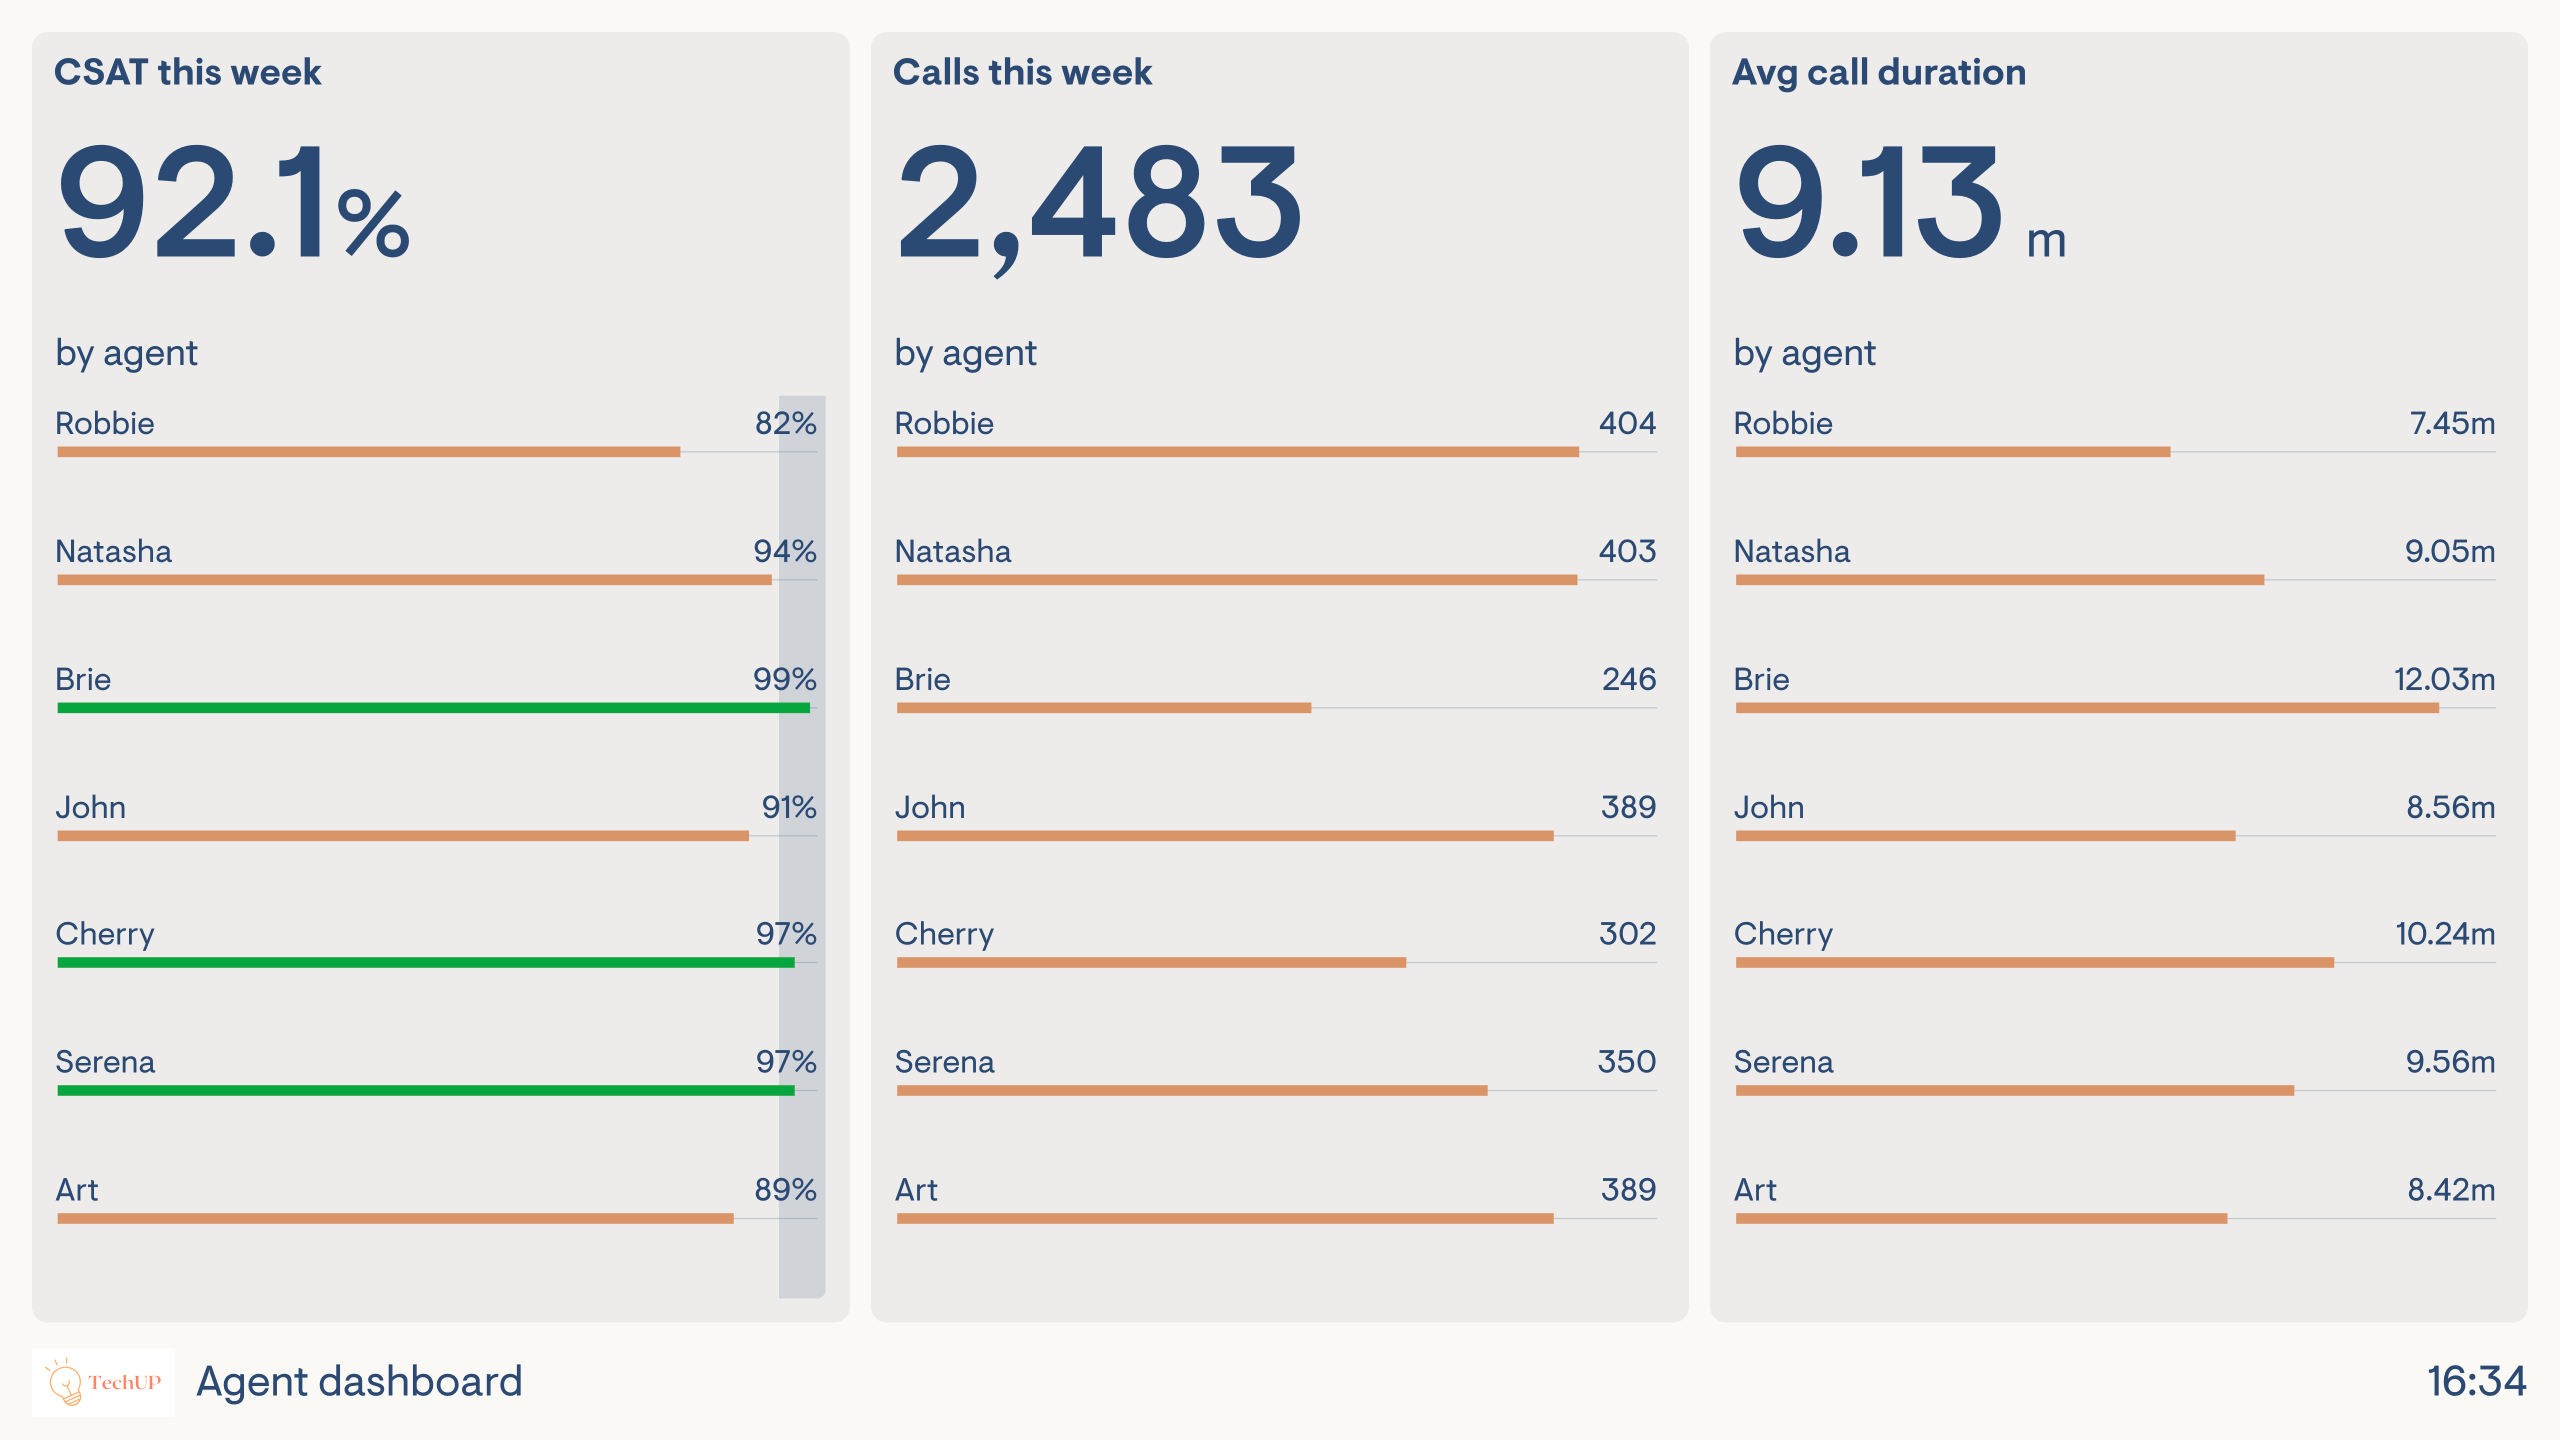
This dashboard is focused on individual performance, and reports on three KPIs for each agent within the team. This is a helpful aid for team leaders who can spot performance issues earlier on, and provide a greater attention to team members who might benefit from extra coaching and support.
Browse other popular examples
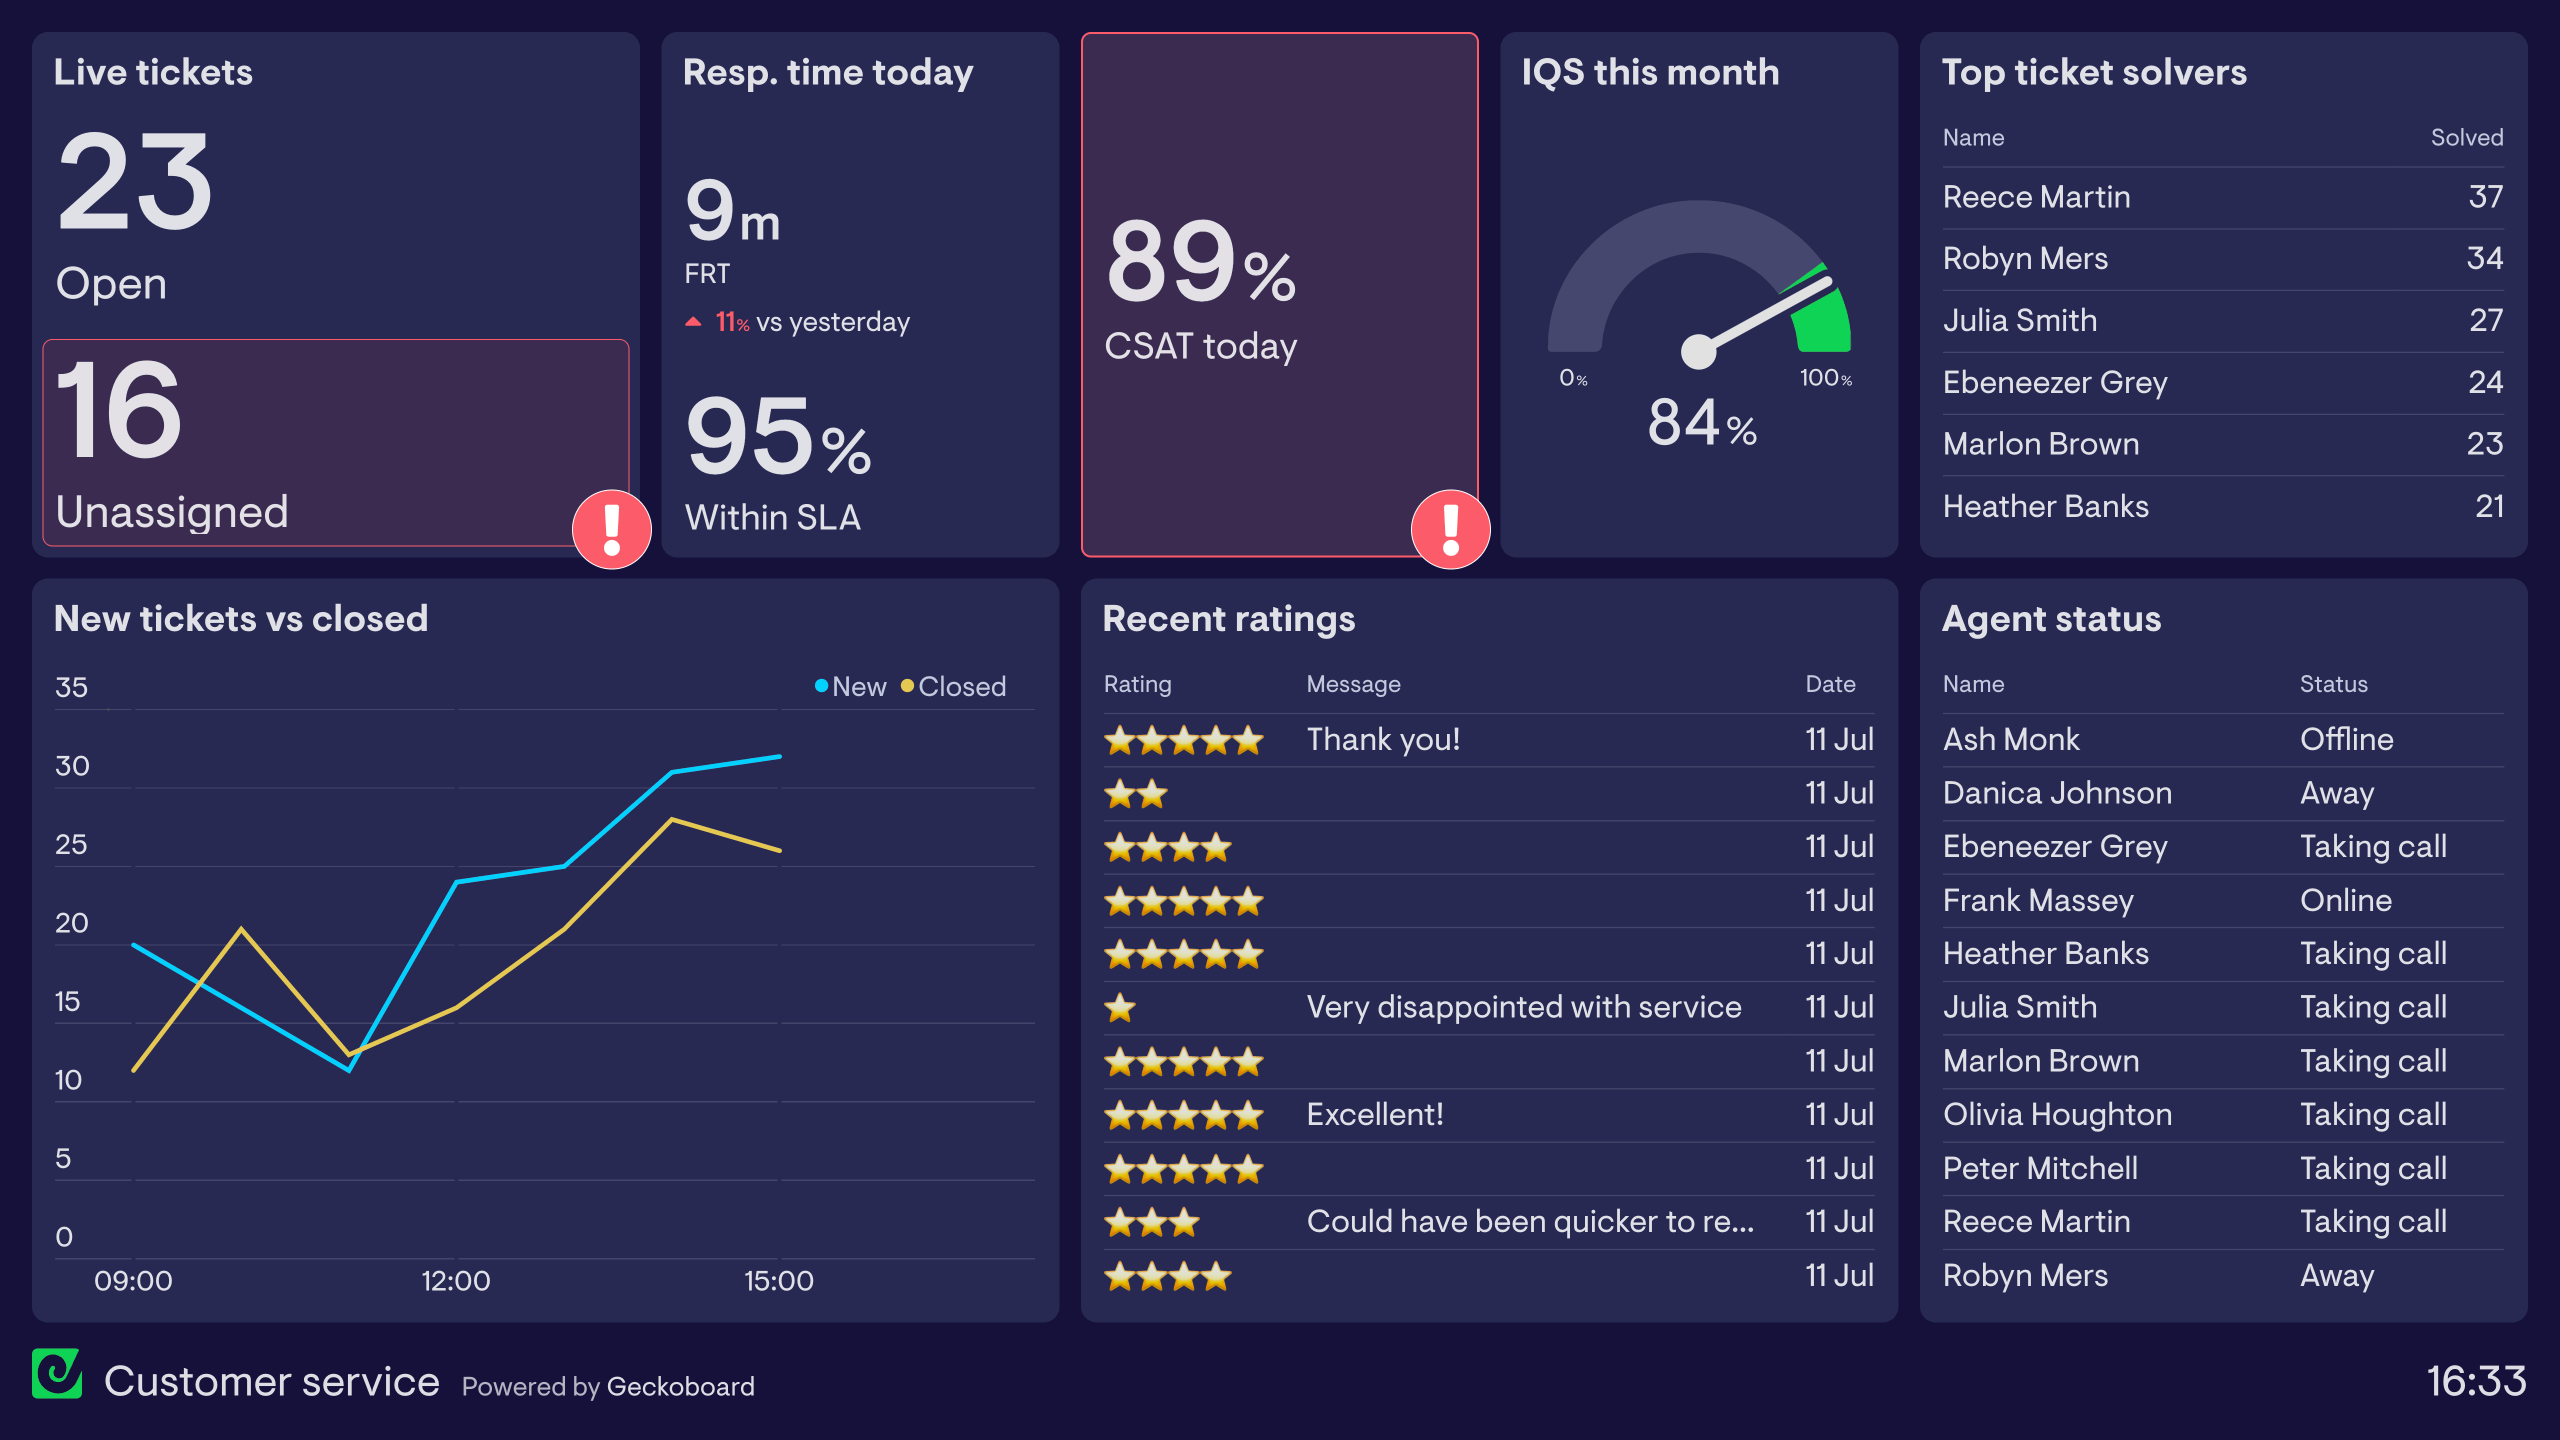
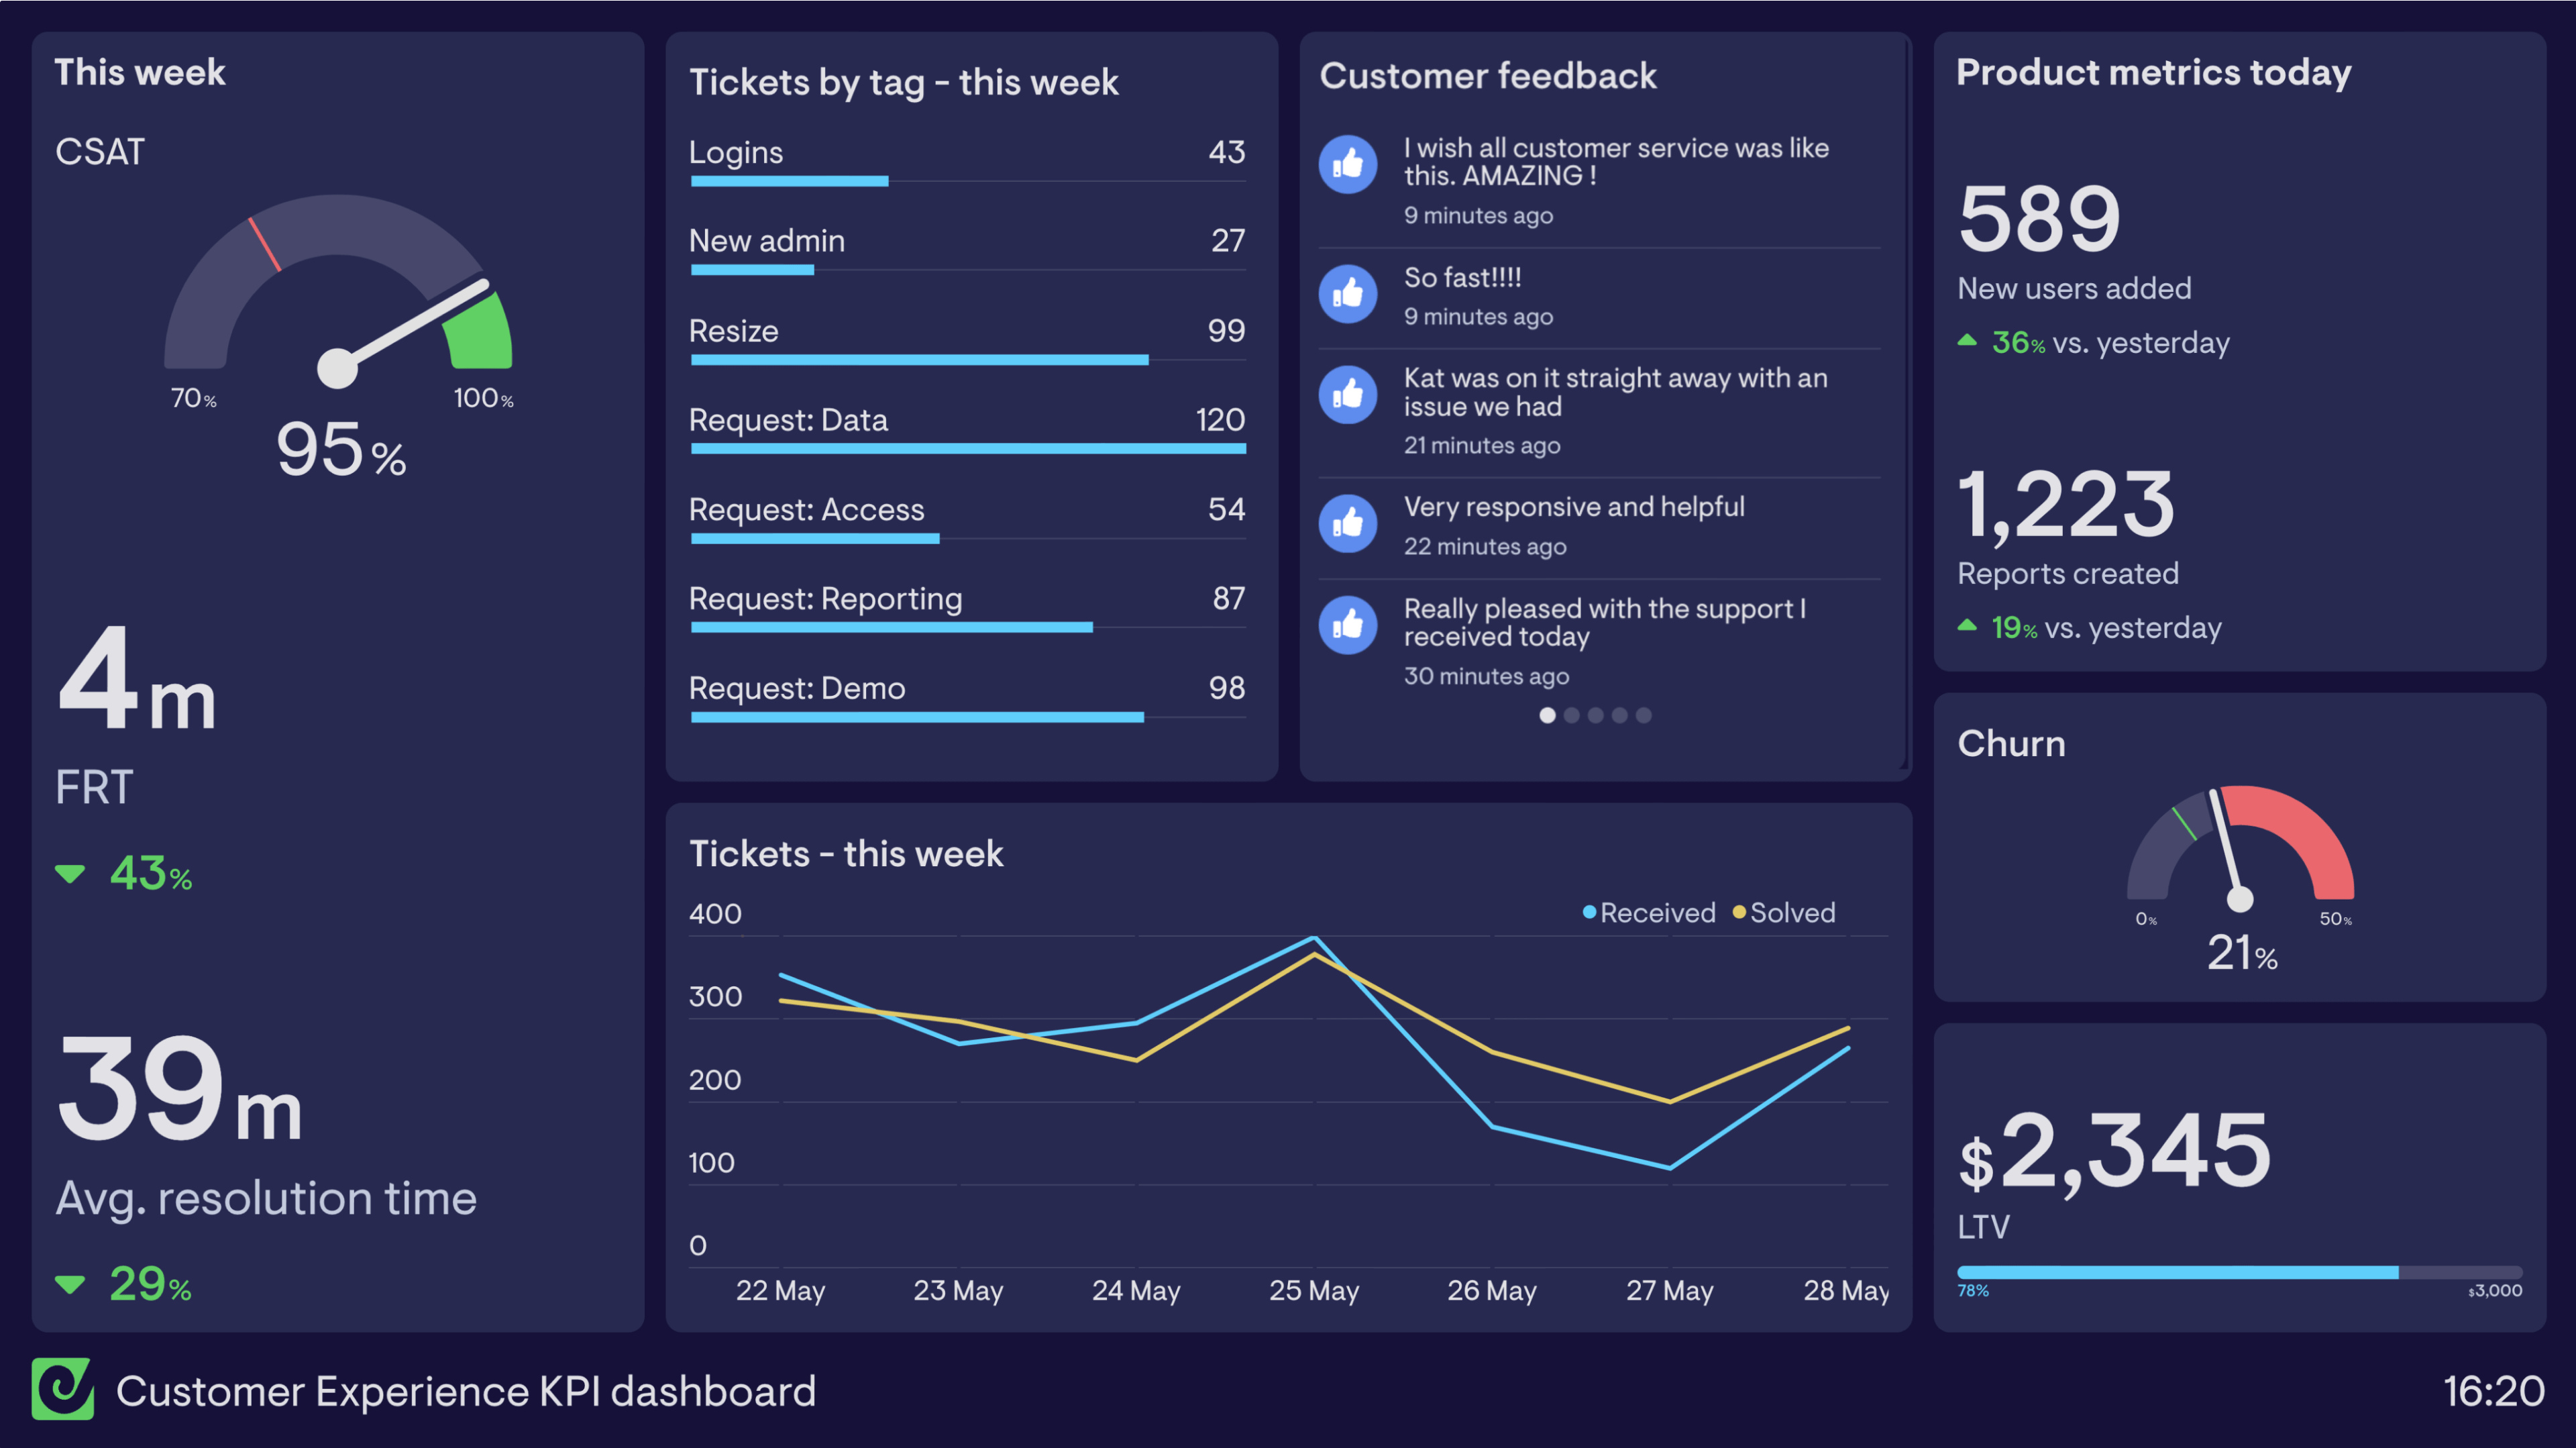
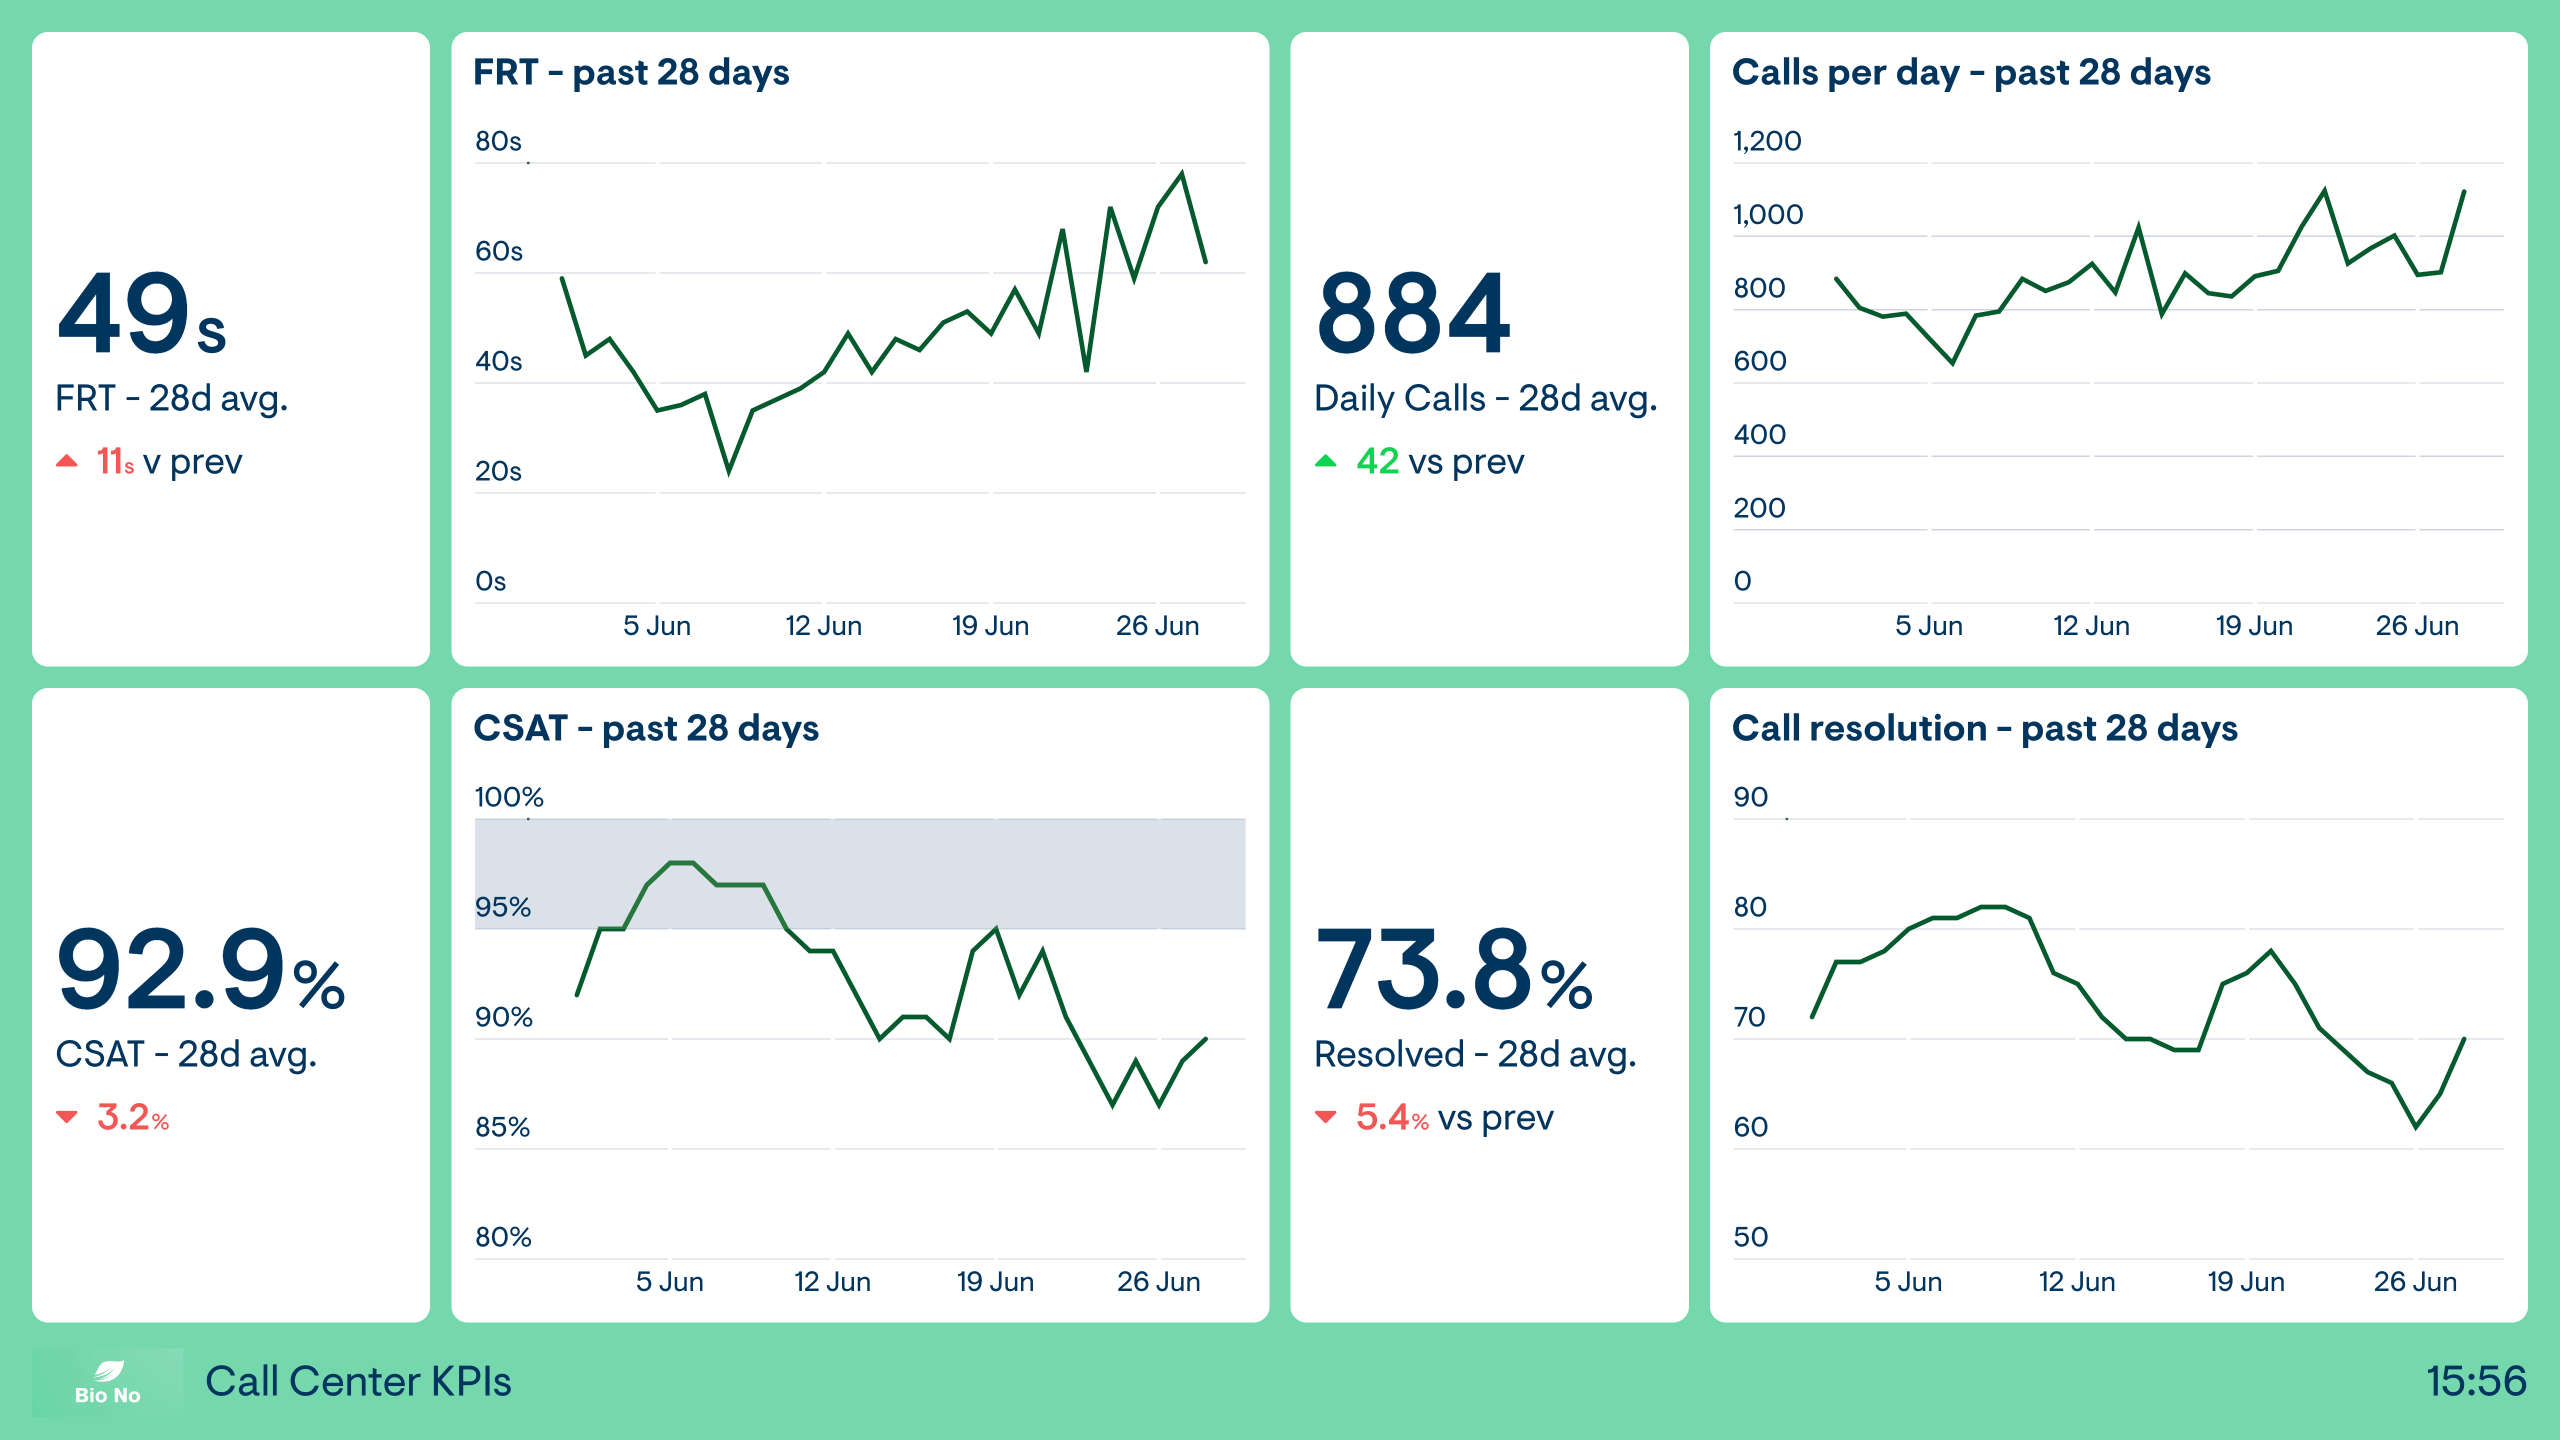
A support agent dashboard gives individual agents and their managers a live view of personal performance — tickets resolved, response times, CSAT scores, and activity versus team targets. It's designed to give agents clarity on how they're doing throughout the shift, so they can manage their own performance without waiting for a manager review.
Geckoboard is a live dashboard tool that connects to Zendesk, Freshdesk, Aircall, and other support platforms to give agents and managers a real-time view of individual performance. Dashboards are built to stay on a screen in the team's workspace — creating visibility and accountability without micromanagement.
Typical metrics include tickets resolved today, average first response time, CSAT score, tickets in queue, calls handled, and comparison to team average or personal target. Leaderboards add a team ranking element to drive motivation.
Building a custom support agent dashboard is straightforward with Geckoboard's dashboard builder. Connect Zendesk Support, Freshdesk, Aircall, Zendesk Talk, or Nicereply depending on your support stack, then pick your metrics and build the view you need. Share with your team as a TV dashboard, shared link, or scheduled snapshot. Start a free trial or learn more about how Geckoboard works.
Use it to display live agent stats on a support floor screen that keeps the whole team aware of individual and collective progress. It also helps track customer service performance live so team leads can see when an agent is struggling and step in before response times or CSAT scores slide.