
Snapshots and reports
Keep teams and stakeholders in the loop with an easy-to-understand dashboard report, sent regularly over email or Slack.
-
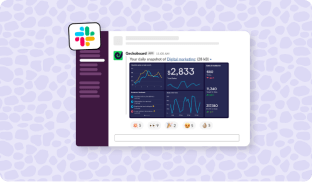
Slack snapshots
Keep KPIs top of mind for your whole team, wherever they’re located. Connect a Slack account to post regular snapshots of your dashboards to specific channels.
-
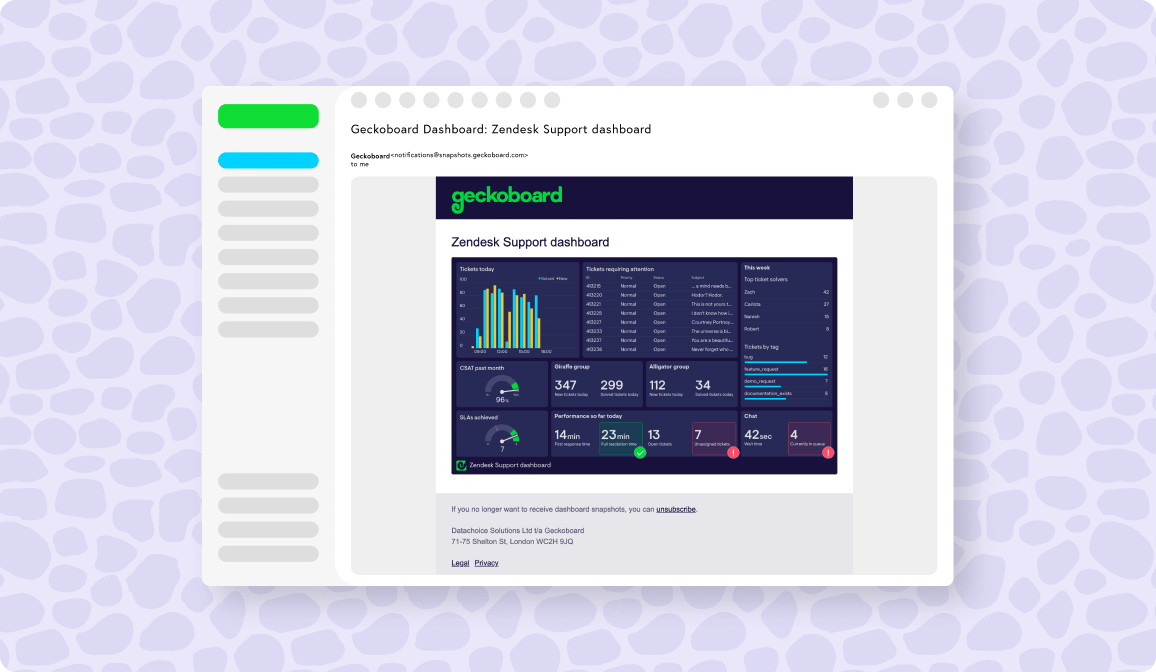
Email snapshots
Deliver regular updates to someone’s inbox by adding their email address and setting a schedule.
-
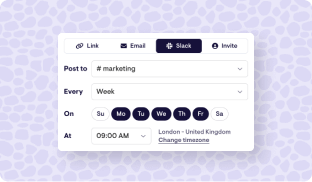
Automate reporting
Take the hassle out of your reporting by scheduling snapshots to be sent daily, weekly or monthly. On certain integrations, Geckoboard can automatically pull together data for ‘today’, ‘yesterday’, last week’ and ‘last month’, making it a breeze to package and send regular updates around your organization.


90+ data sources
Raise awareness of key metrics by making KPIs easy to access and understand, wherever they’re stored.


FAQ
Geckoboard
How do I set up a Slack snapshot?
Connect your Slack account to Geckoboard, and you’ll be able to pick a channel to send snapshots to, and set which day(s) and times you’d like them to go out. For more detailed setup instructions, head here.
How do I set up an email snapshot?
In the ‘share’ menu, you’ll be able to enter the email address(es) you’d like to send snapshots to, and set which day(s) and times you’d like them to go out. For more detailed setup instructions, head here.
How often can snapshots be sent out?
You can set whether to send snapshots on a weekly schedule - and pick which specific days they should be sent out - or monthly schedule (on the first day of every month, for example.). You can also choose the specific time.
Can I send email snapshots to addresses outside of my organisation?
Yes.
Which data sources support historical time periods?
Historical time periods are available for Shopify, Facebook Ads, Google Search Console, Matomo, YouTube, Zendesk Support.