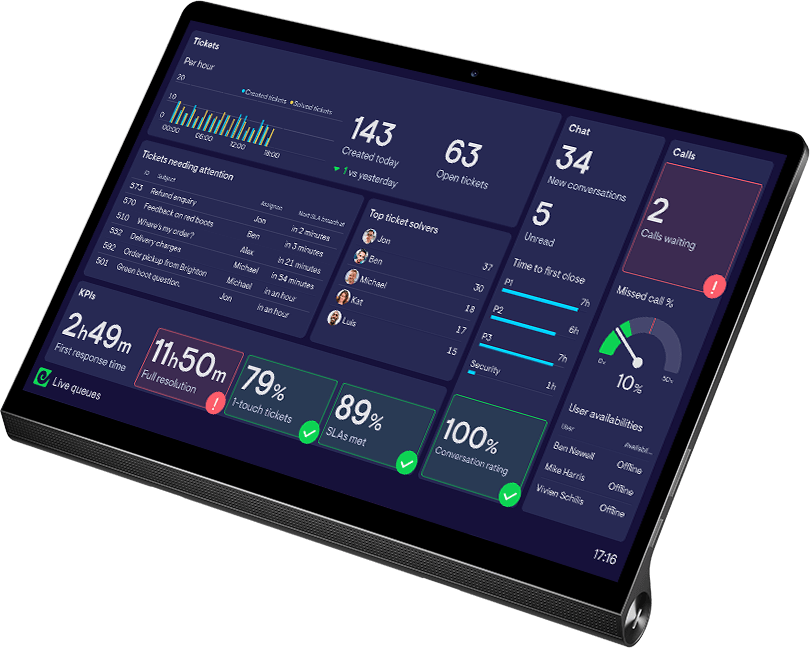
The Zendesk Explore alternative for real-time team dashboards
Geckoboard brings your live support metrics out of Zendesk, so your whole team can see what’s happening now, while there is still time to act.
- Works with every Zendesk plan
Trusted by 500+ Zendesk support teams • 4.5★ on G2 • 5★ on Zendesk Marketplace
Help your team act on what is happening now
Zendesk’s reporting tools are optimized for analyzing the past and designed for managers, not the wider team.
Geckoboard makes current performance part of the team’s day through wallboards, snapshots and individual agent views.
When teams see how they are performing in real time, they can tackle rising wait times, step in when customers are unhappy and prevent SLA breaches before it is too late.
Geckoboard vs Zendesk Explore (Analytics)


Built for historical reporting and detailed analysis


Built for live, team-wide visibility
Real-time monitoring requires a Zendesk Professional or Enterprise plan, and live reporting in Explore is being retired in January 2027
Fully customizable live dashboards on every Zendesk plan, including legacy plans
Difficult to learn and use. Formulas and calculated metrics are often needed to create even fairly basic custom reports
Easy to build and customize without specialist reporting knowledge, with pre-built metrics and powerful filtering
Standard reports refresh hourly or daily and can take longer to process when a lot of data is involved
Metrics refresh in seconds or minutes, regardless of how much data is involved
Limited to Zendesk data
Combine Zendesk with more than 90 other data sources, including Salesforce, Jira and Shopify, on the same dashboard
Dashboards live primarily inside Zendesk
Designed to put your data where your team will see it, with dashboards optimized for TVs, browsers, mobile, Slack, Microsoft Teams and email
Access and sharing depend on your Zendesk plan
Unlimited viewers without Zendesk seats, so executives and other teams can access dashboards directly
Most teams start with Geckoboard because they need better live Zendesk dashboards. Once they see how much easier it is to build, customize and share them, they often end up using Geckoboard for more.
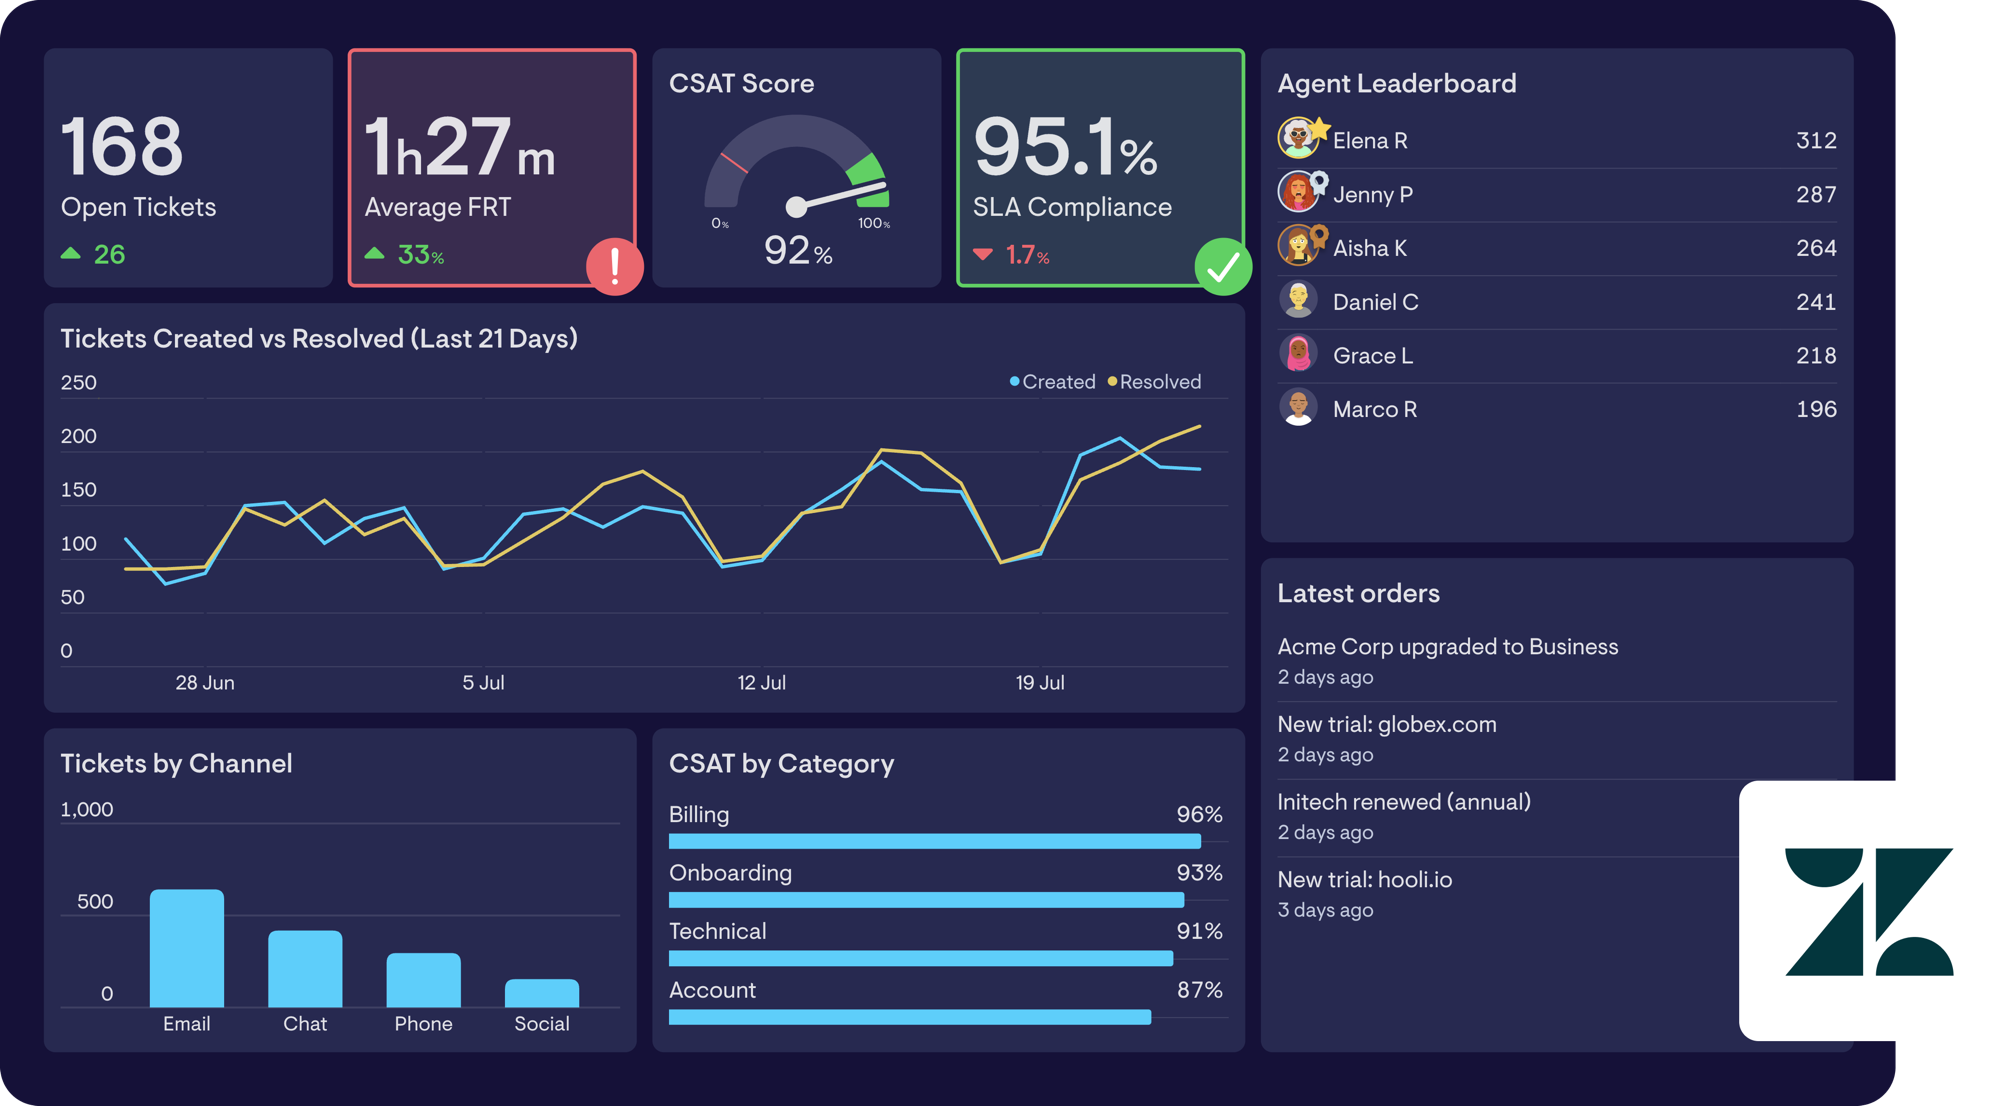
See how easy it is to build a live dashboard with Geckoboard
Connect Zendesk in a couple of clicks and start with a set of pre-built dashboards. Customize the metrics, add data from other sources and share the result with your team.
Geckoboard for ZendeskYour Zendesk data, inside ChatGPT or Claude
Ask questions in plain language and let your AI assistant investigate your Zendesk metrics alongside the wider context from your other data sources. Zendesk is developing conversational analytics, but Explore metrics are not available to external AI tools through MCP.
Why over 500 Zendesk teams choose Geckoboard

Being reactive is one thing, but being proactive is where we need to be. Having live Zendesk data at our fingertips, showing queue spikes and productivity right now, changed everything.

The information was critical, but it was stuck in Zendesk. We needed real-time insights that anyone could see, from agents to executives.

Should you use Geckoboard or Zendesk Explore (Analytics)?
For most support teams, the answer is both.
Use Zendesk Explore when you need to…
- Investigate historical performance
- Build detailed custom reports
- Analyze trends in depth
- Work only with Zendesk datasets
- Produce formal or periodic reporting
Use Geckoboard when you need to…
- Give the whole team a shared view of performance
- Keep queues, SLAs and workloads visible
- Build customized live dashboards
- Share Zendesk metrics without buying more seats
- Combine Zendesk with other systems
- Monitor several Zendesk accounts together
- Use your metrics through ChatGPT, Claude and other AI tools
Geckoboard replaces Explore for live, shared operational dashboards, not for every kind of analysis.
Most Geckoboard customers continue to use Explore for detailed historical reporting and investigation. They use Geckoboard for the metrics their team needs throughout the day.
Geckoboard works with every Zendesk plan, including Suite Team, Suite Growth, Support-only and legacy plans. Whatever plan you’re on, you can build fully customizable live dashboards, set up alerts and query your metrics in ChatGPT or Claude through Geckoboard MCP.
The only limits come from Zendesk itself. If your plan doesn’t include a feature, such as SLA policies, Zendesk doesn’t generate that data, so there’s nothing for Geckoboard to report on.
No. In Zendesk, real-time monitoring is limited to Professional and Enterprise plans, and upgrading means paying more for every agent. Instead, you can connect your existing Zendesk account to Geckoboard and get live dashboards, alerts and AI querying on the plan you already have.
Explore is a sophisticated reporting tool. Building custom reports can require an understanding of datasets, metrics, attributes, filters, calculated metrics and formula syntax.
Geckoboard provides dashboard-ready metrics and a simpler dashboard builder for operational use cases.
Standard Explore reports refresh hourly or daily depending on your Zendesk plan.
Geckoboard refreshes Zendesk Support every 10 minutes, Chat every minute, Talk and Agent Status every 30 seconds, and Messaging metrics instantly.
No. You can share Geckoboard dashboards with unlimited viewers through live links, TVs, Slack, Microsoft Teams, email and mobile.
Both provide a more conversational way to work with service data.
Zendesk Agentic Analytics works inside Zendesk and is currently available through an Early Access Program. It can answer questions, investigate trends, and help create reports and dashboards.
Geckoboard MCP makes the metrics used on your Geckoboard dashboards available in ChatGPT, Claude and other MCP-compatible tools. These can include Zendesk metrics alongside metrics from more than 90 other sources.
Existing Explore metrics are not currently exposed to external AI tools through a Zendesk MCP.
Yes. Geckoboard supports multiple Zendesk connections on the same dashboard and can display Zendesk metrics alongside data from more than 90 other sources.
Not on its own. A data warehouse makes Zendesk data available for analysis, but you still need to define the metrics, build and maintain reports, keep them current, and put them somewhere the team will actually see them.
Geckoboard handles that operational layer, turning Zendesk data into live, ready-to-use metrics and sharing them through dashboards, TVs, Slack, Microsoft Teams and more. You can also bring warehouse data onto the same dashboard when you need wider business context.
Yes. Zendesk has renamed Explore to Zendesk Analytics, but many teams, and much of Zendesk’s own documentation, still call it Explore. Everything on this page applies to both.
Zendesk is retiring live reporting in Explore on January 25, 2027. Live dashboards will be removed, and live components in custom dashboards will stop showing data. Zendesk is moving live monitoring into real-time monitoring, which is available on Professional and Enterprise plans.
If you want live dashboards without upgrading, or need them on TVs, Slack, Microsoft Teams or mobile, you can rebuild them in Geckoboard today.
Run your support operation with live Zendesk metrics
Build dashboards your whole team can see, understand and act on.