Real-time customer service performance, visible to every agent, team lead, and exec.


Trusted by 1,000s of support teams
The problem
When performance slips, the warning signs aren’t visible until it’s too late.
Agents can’t see what needs attention right now.
The queue changes by the minute, but support agents can only see what’s in front of them. Tickets age quietly, calls stack up, SLAs creep toward breach while everyone stays focused on their current work.
Team leads are stuck in slow reports.
You need to keep response times down and protect the customer experience — but you’re stuck refreshing clunky dashboards, scanning queues, and asking who’s available. By the time the warning sign surfaces, it’s already a problem.
Leadership’s questions land on the team lead.
Executives want to know whether customers are being looked after. The question goes down the chain. The answer takes time. And it’s always yesterday’s stale data.
Support data is spread across different tools, channels and browser tabs.
Nobody’s watching everything at once. That ticket that’s been open 47 hours, the call queue that spiked an hour ago, the CSAT that’s been drifting for a week — it’s all visible somewhere. Just not together, and not in real-time.
The solution
Live customer service performance, visible to every agent, manager, and exec
Geckoboard connects to Zendesk, HubSpot, Aircall, and your other support tools and shows queue health and team performance in real time. Set thresholds and get alerted before SLAs breach or wait times spike. Put the shared view on a screen so agents can see the bigger picture and self-manage. Team leads act instead of react, and leadership gets to see support performance for themselves.
For the team
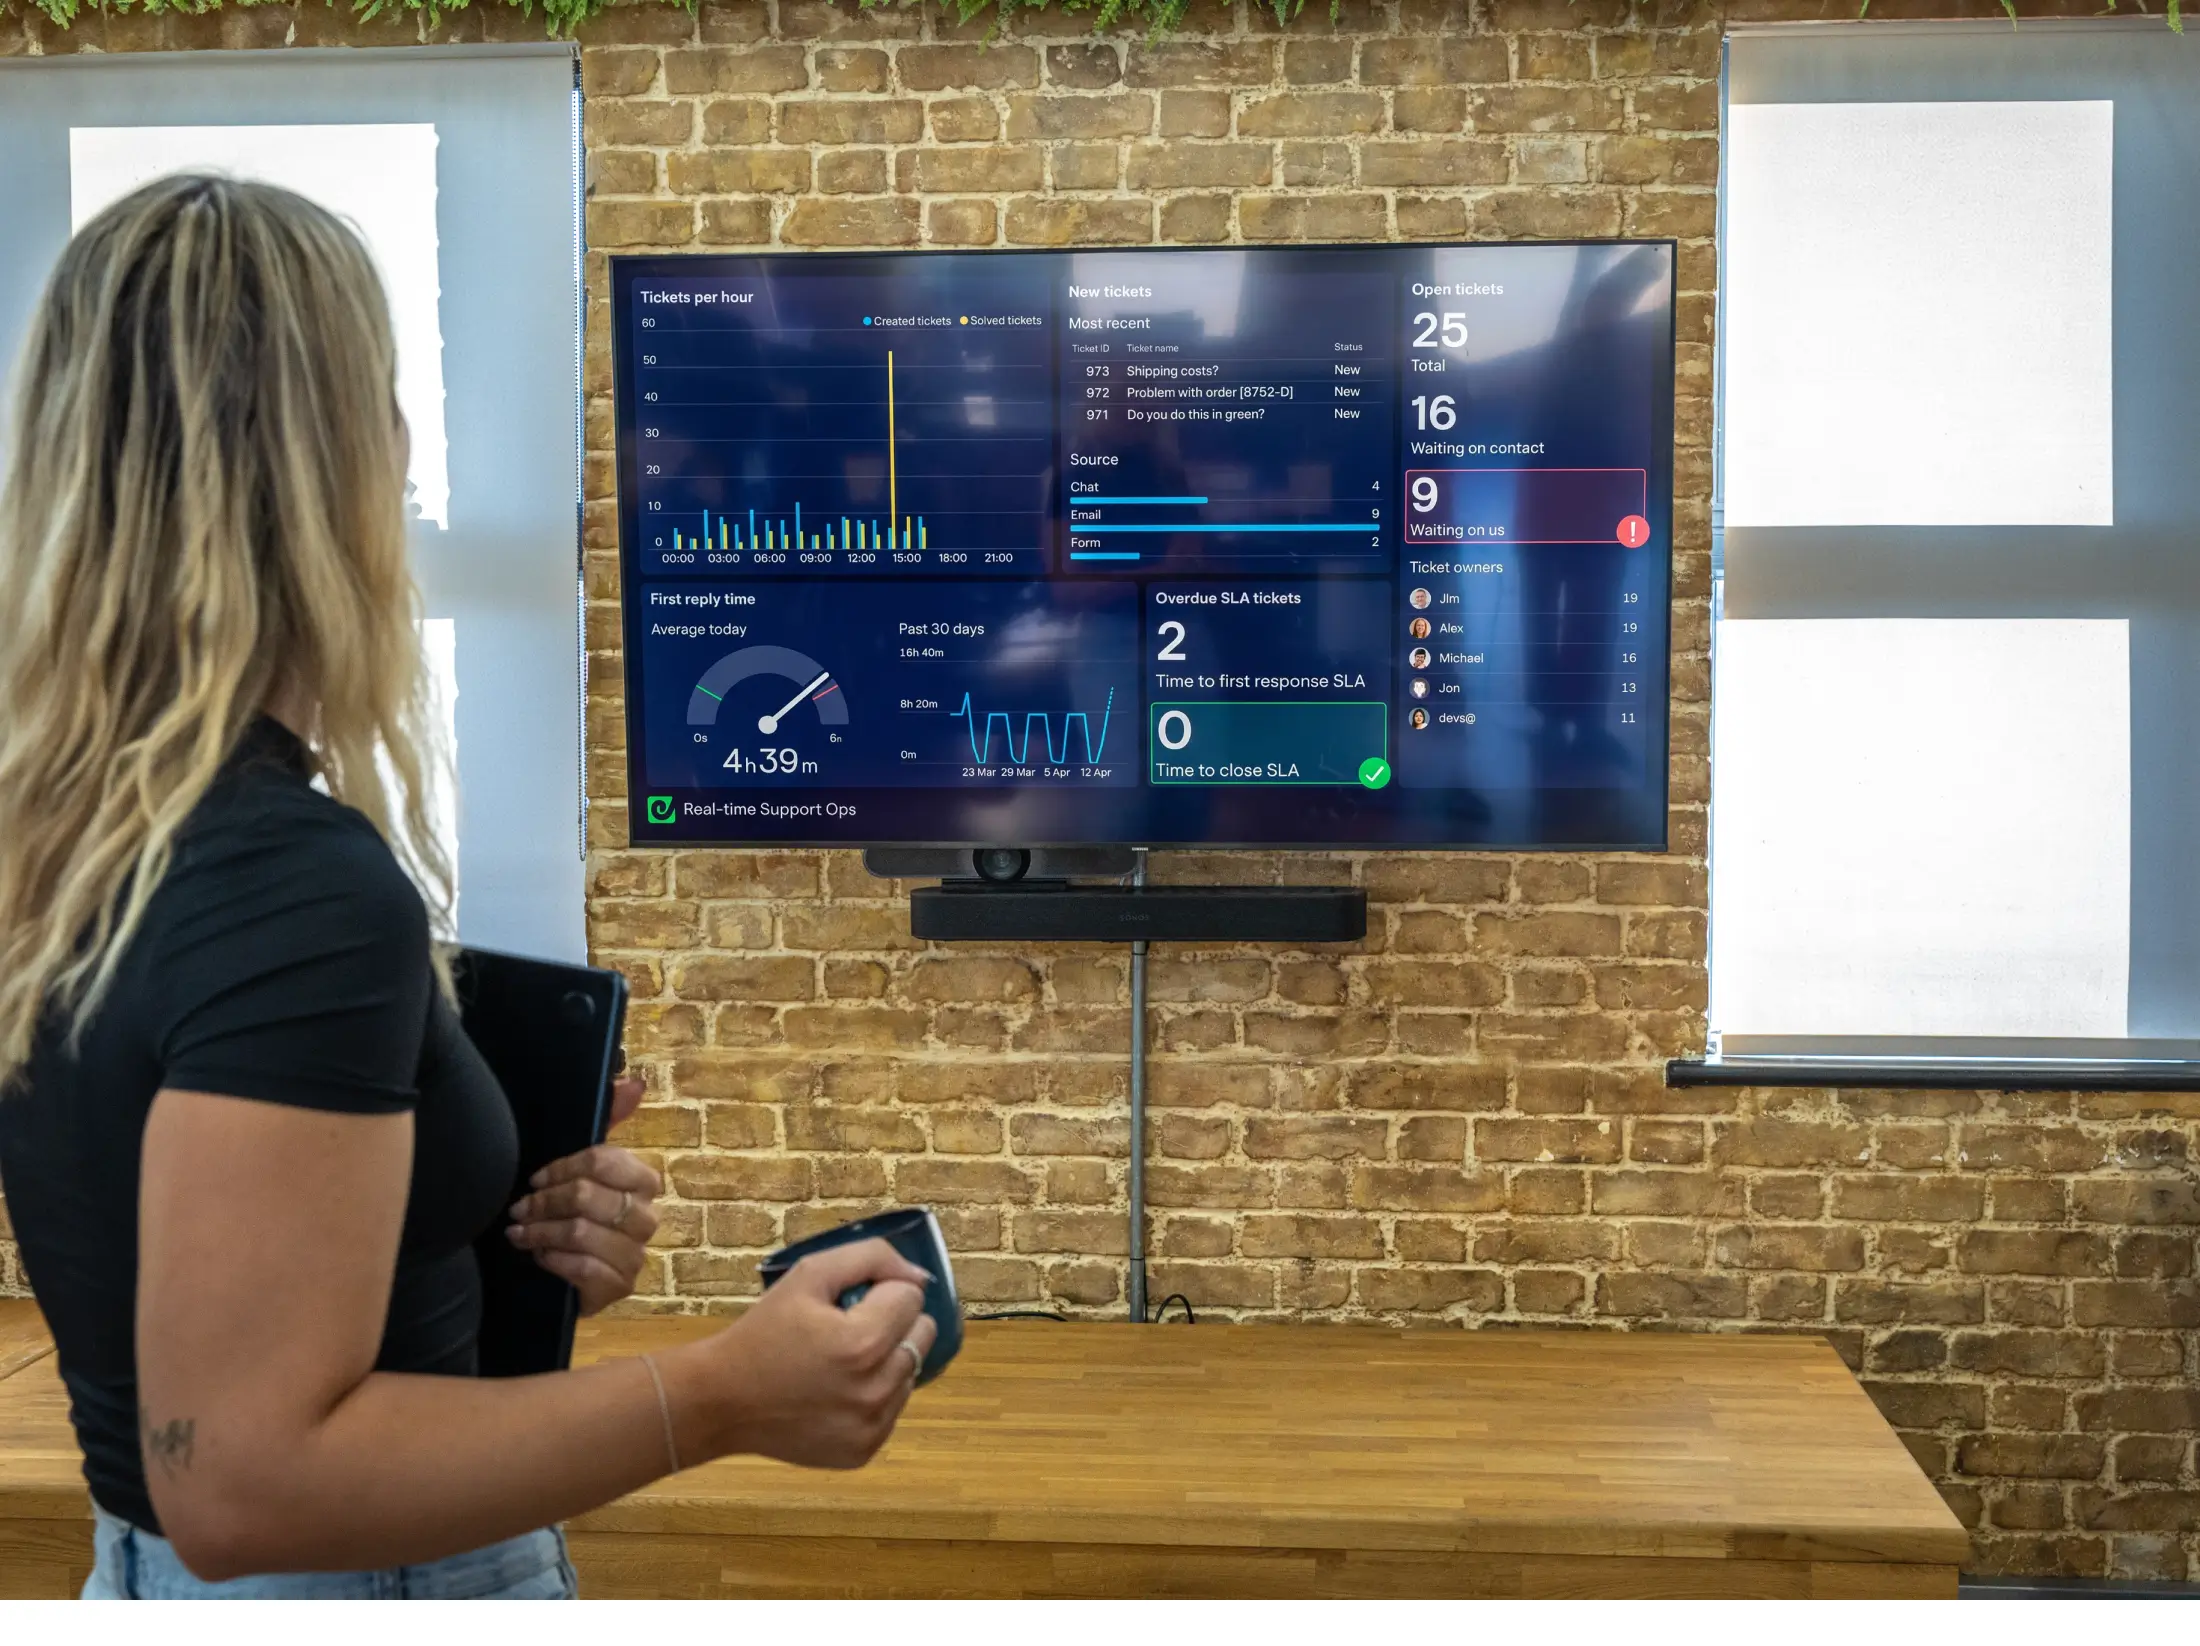
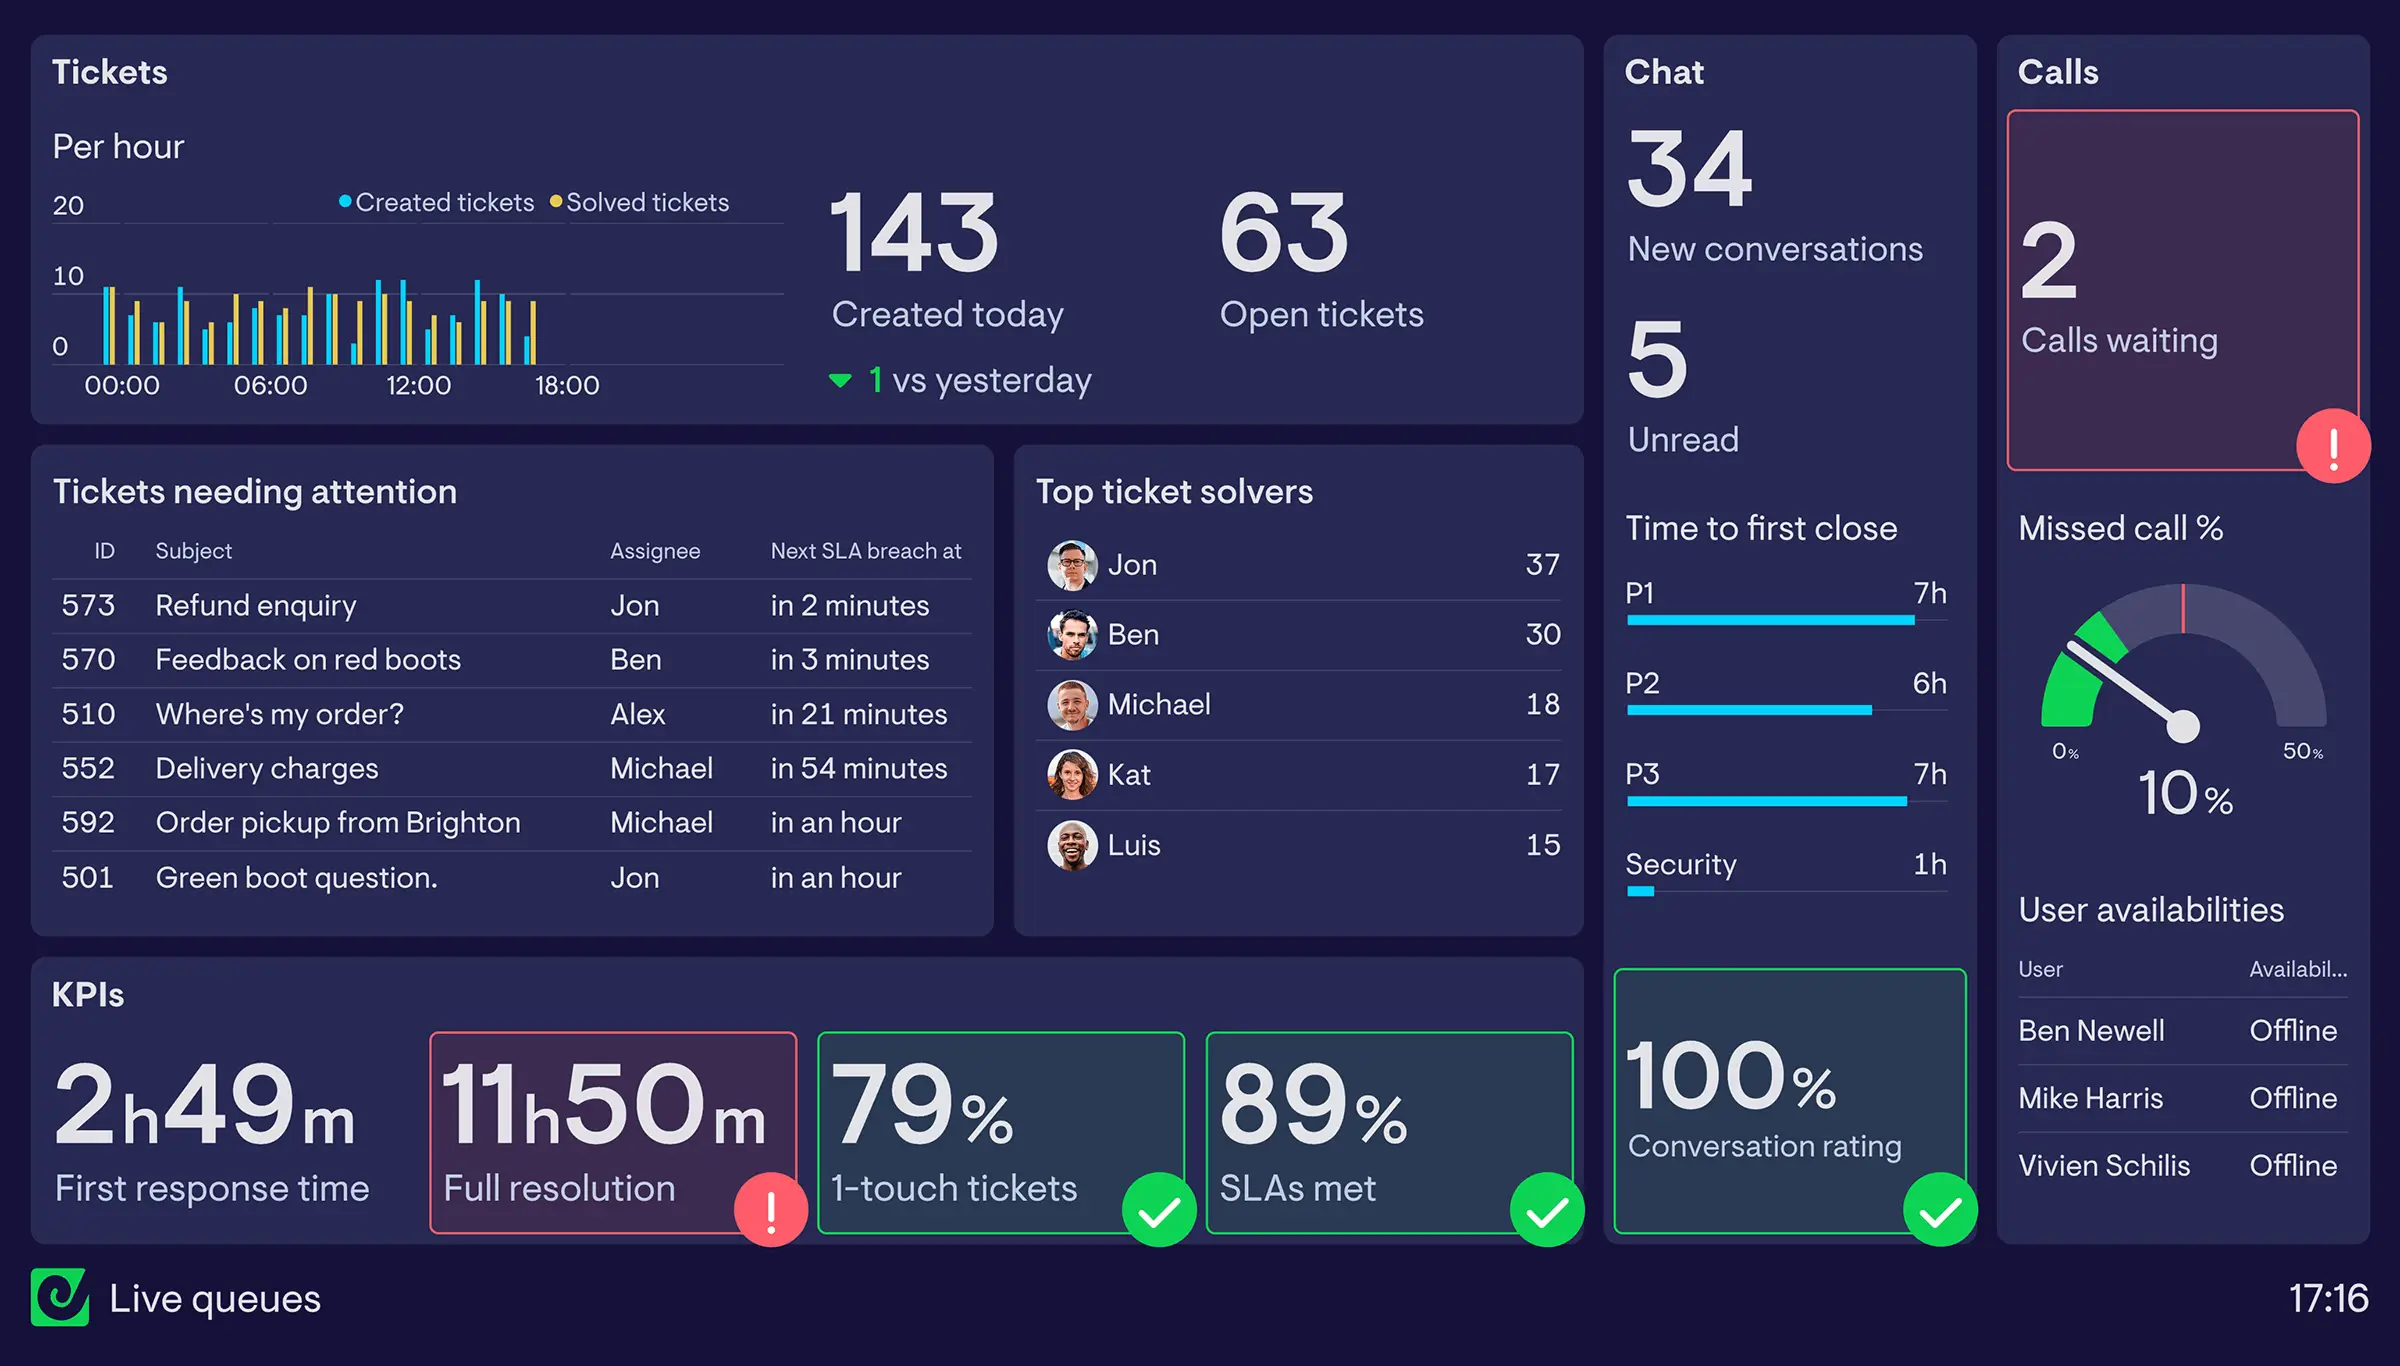
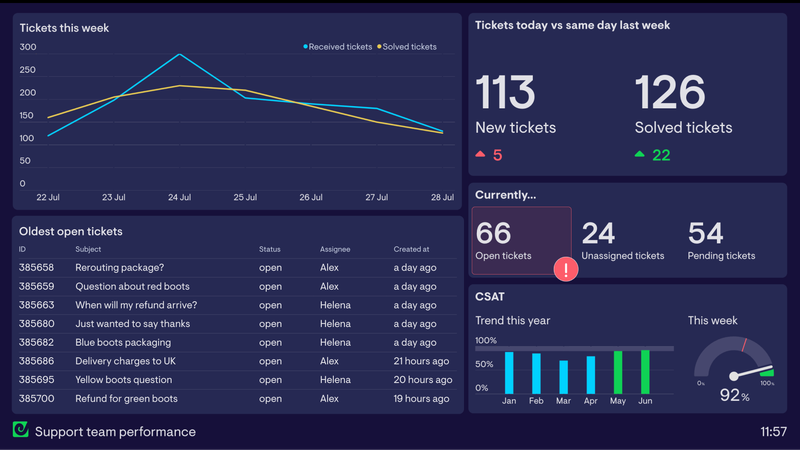
Live queue dashboards
Every agent sees ticket volumes, wait times, and queue depths across all channels in real-time. On TV screens in the office. In Slack or Teams. On a shared link. Key service metrics are front and center, all day, without anyone having to ask or dig around to find them.
Agent dashboards
Each agent has their own up-to-date view of open tickets, first reply times, CSAT and any other metric that’s important to them. They can see exactly where they stand — and what needs attention — without waiting for a manager to tell them.
Briefings and handovers
Run shift handovers and daily standups off live data, displayed on a screen, or from snapshots sent to your support channel. No one prepares anything. No more screenshotting.
For managers and leadership

Manager dashboards
Live tickets, call queues, agent availability, and performance metrics across your whole stack in one place. Open Geckoboard and your full picture is there.
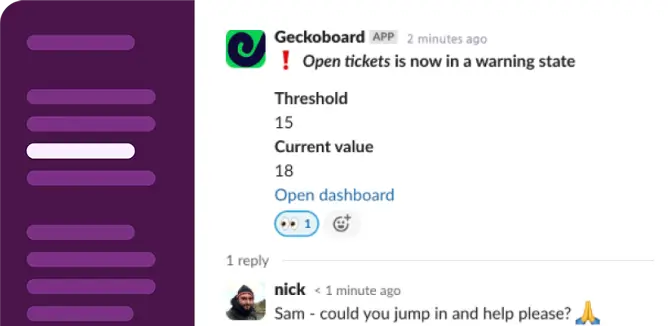
SLA and aged ticket visibility
Breached SLAs, overdue tickets, and backlog spikes get highlighted automatically. Agents self-correct and team leads have fewer fires to fight — without having to constantly nudge anyone.
Exec and leadership visibility
Leadership sees CSAT trends, SLA health, and team performance without needing extra licenses to tools, a training session, or a report request. Available 24/7 and always current.
Automated reporting
Shift summaries and period-end performance reports reach leadership inboxes, Slack, and Microsoft Teams on the schedule you set. No more end-of-day report building.


I used to spend an hour at the end of every day preparing reports. Now Geckoboard automatically updates the senior leadership team with a snapshot.
Connect every tool your support team runs on
Our integrations turn customer service performance data into meaningful metrics you and your team can rally around. Built for secure, reliable, real-time monitoring.


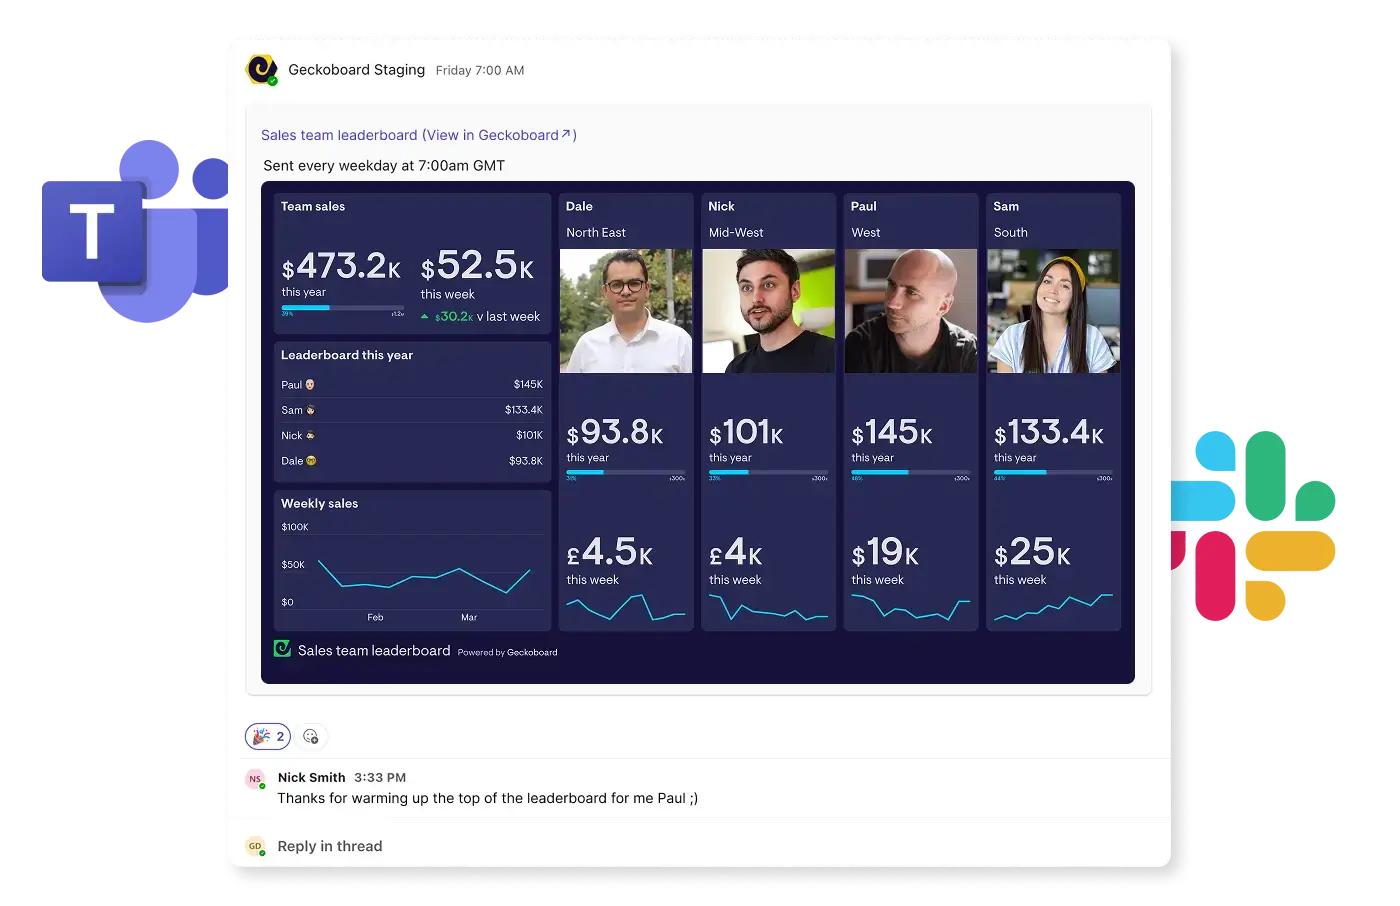
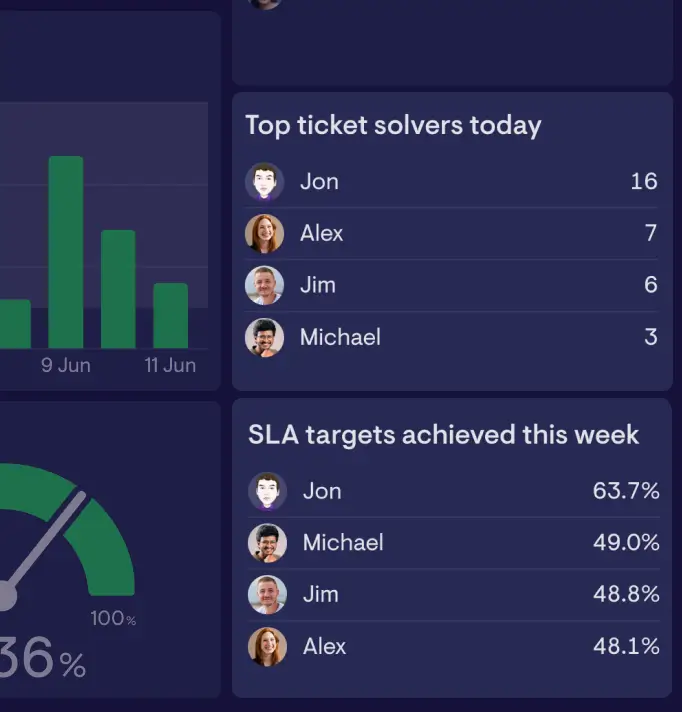
Agent leaderboards that unlock team performance
Geckoboard’s leaderboards are used by teams that want to spark some frienedly competition with a live view of agent performance — based on virtually any metric — shared where agents can see it. Everyone sees where they stand in real time, without anyone having to update a whiteboard or post an update.
- Rankings update automatically as data changes in your ticketing, chat or phone platform — no manual refresh
- Display on TV screens in the office, in Slack, or access on mobile
- Track CSAT, tickets closed, SLA achievement rate, call answer rate, QA scores and more

It allows us to make a series of business decisions in very quick succession. We can move people around, add capacity, or spot when we need to push, all without waiting for a report. It probably saves me an hour a day. That’s five hours a week that I’m not sitting there pulling data.
Customer story
How Woolworths MarketPlus got critical support data out of Zendesk and in front of their whole team
It’s more than gamification. It’s identity. The teams actually bond with their dashboards. Team performance has improved, customer satisfaction improves, and we see higher team satisfaction too.
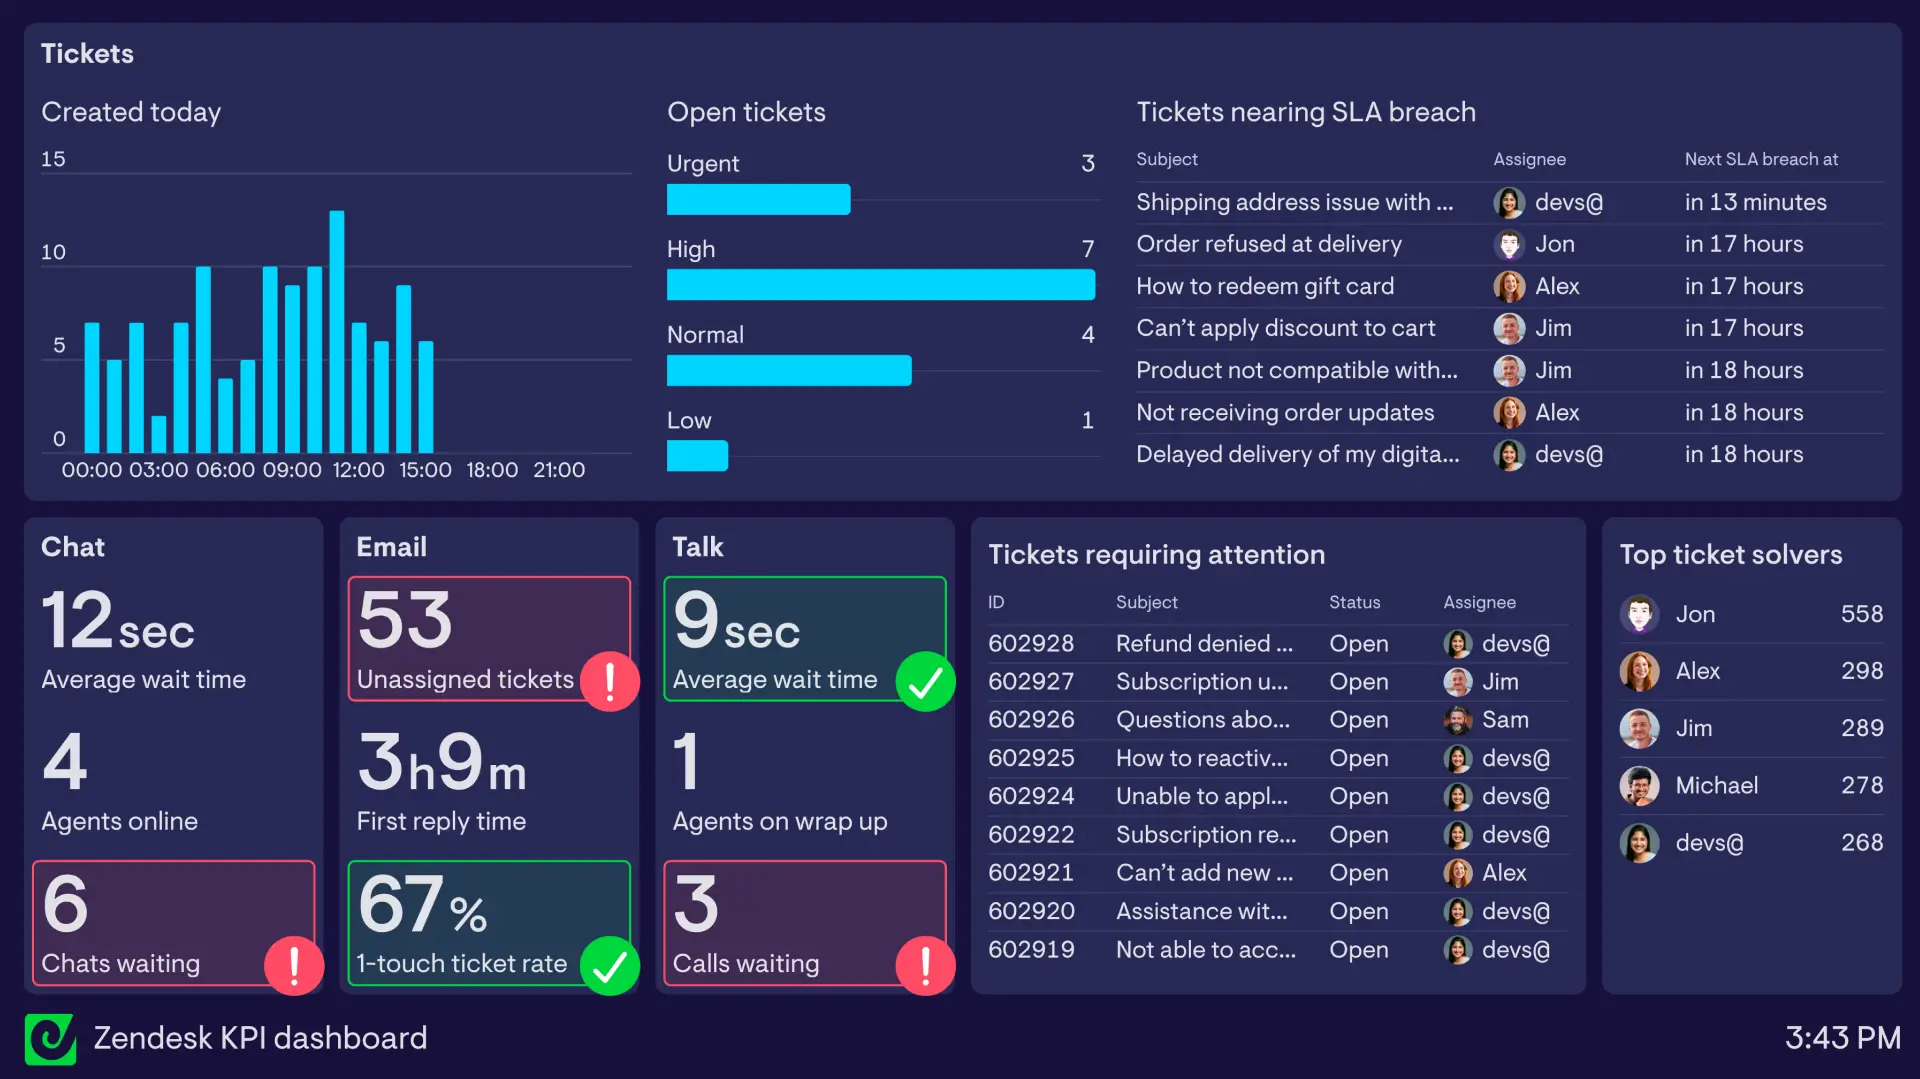
Example customer service dashboards
Zendesk support dashboard
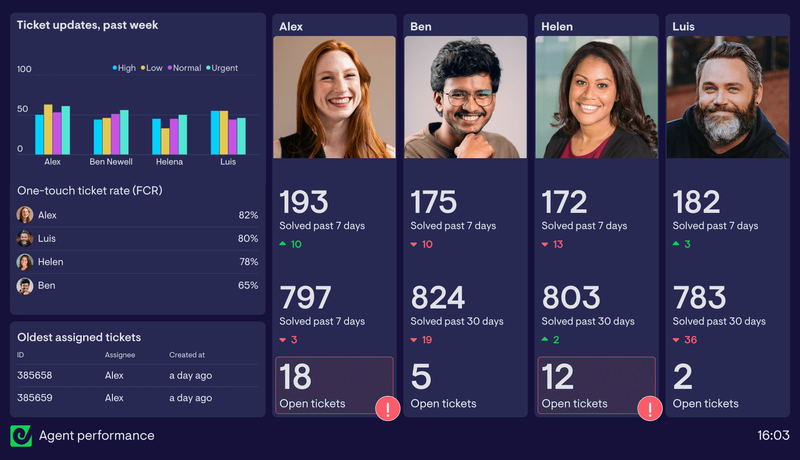
Agent performance dashboard
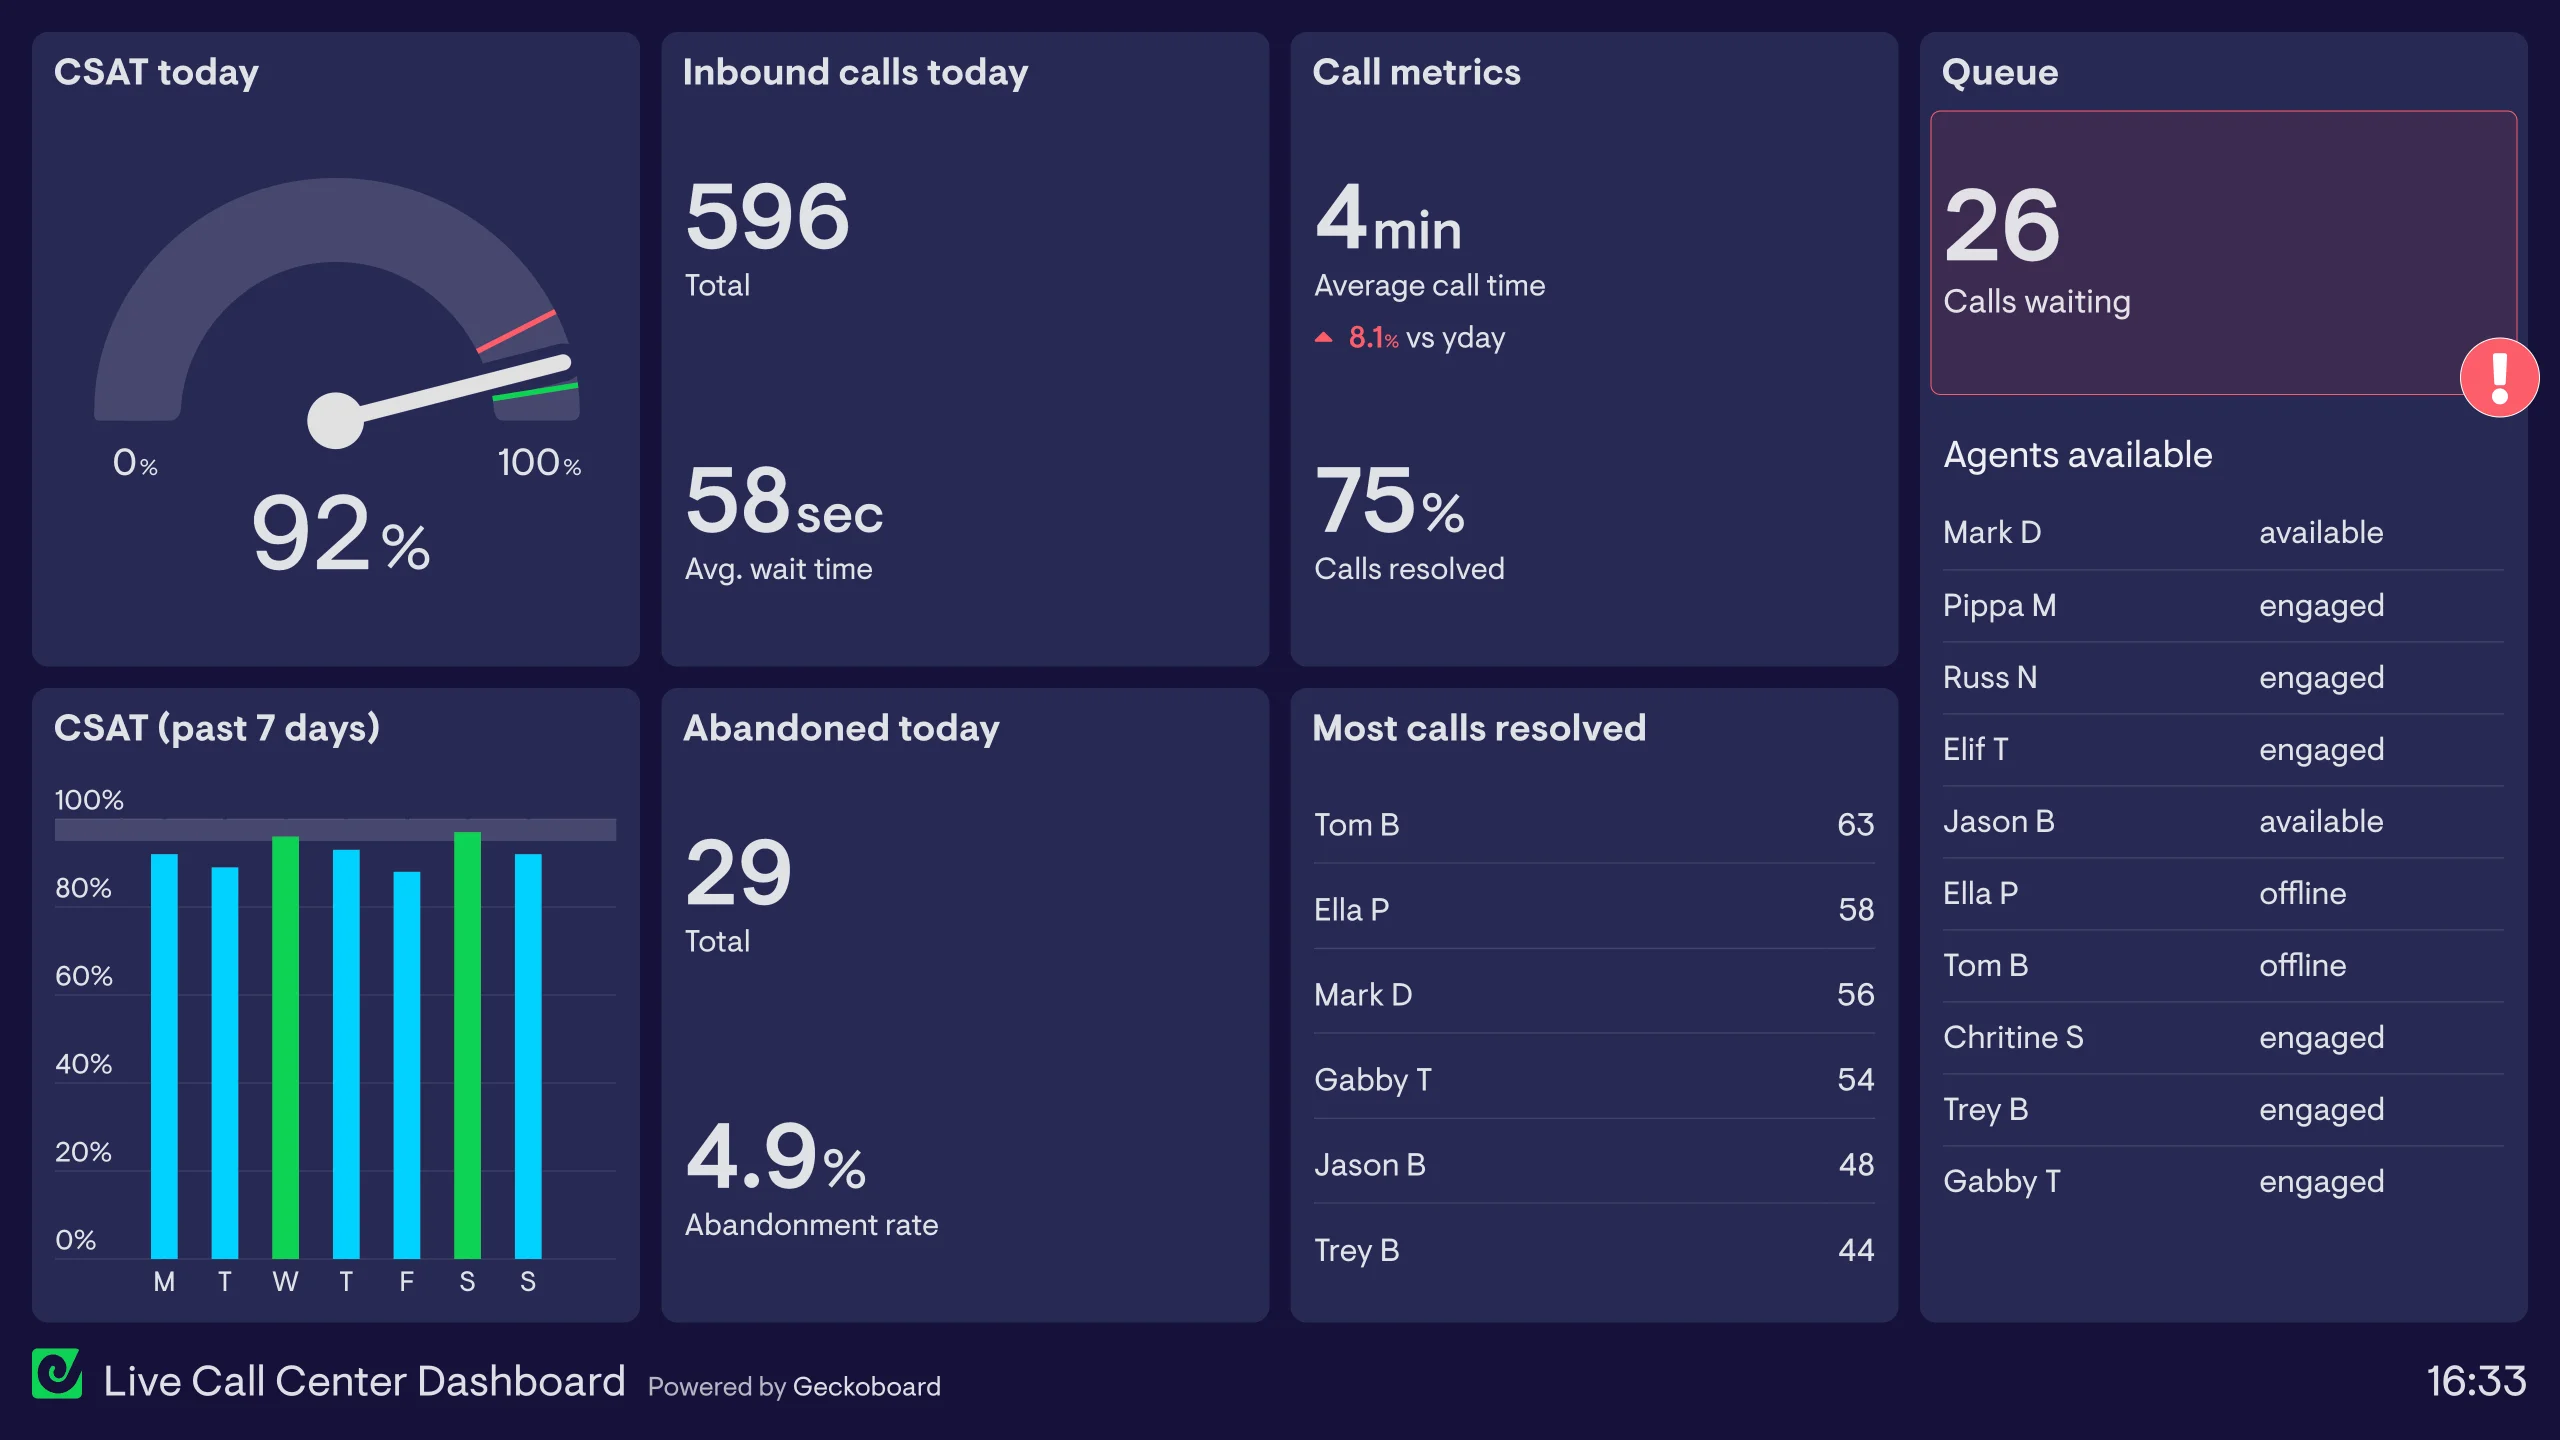
Contact center dashboard
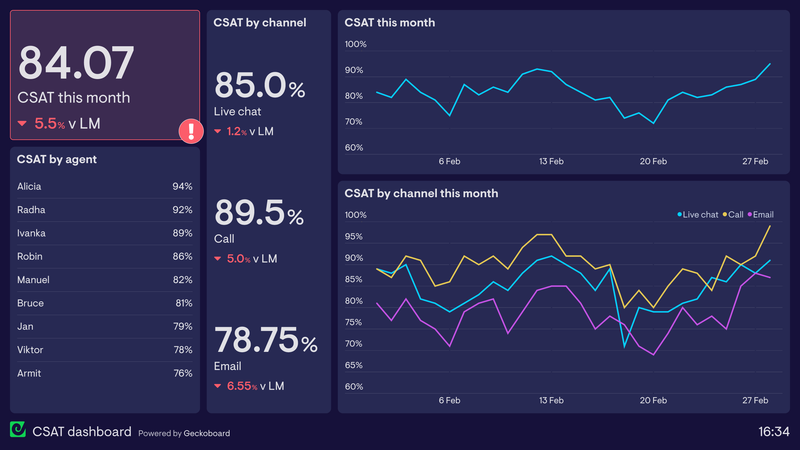
CSAT trends dashboard
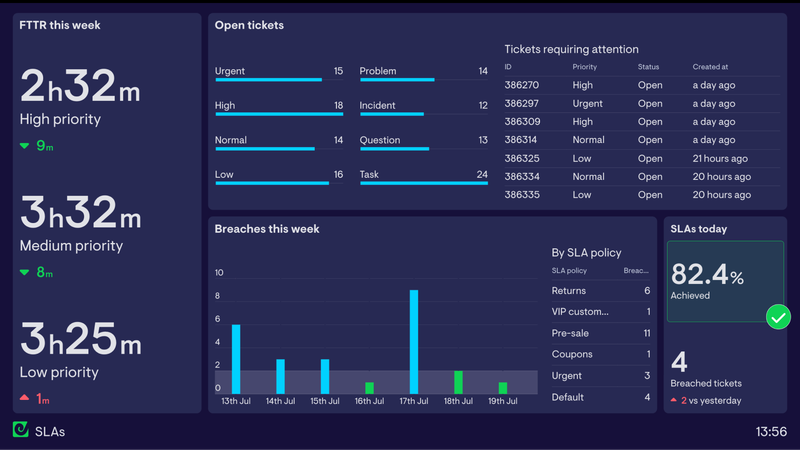
SLA monitoring dashboard
Multi-channel support dashboard
Put live customer service performance in front of your whole team
Connect your support tools and have your first customer service dashboard live today.