Salesforce dashboard examples
A Salesforce dashboard takes your CRM metrics out of Salesforce and into a view that works for the whole team — on a TV, alongside data from other tools, and visible to people who don't have a Salesforce license. It stays current automatically, without any manual reporting work.
Salesforce dashboard
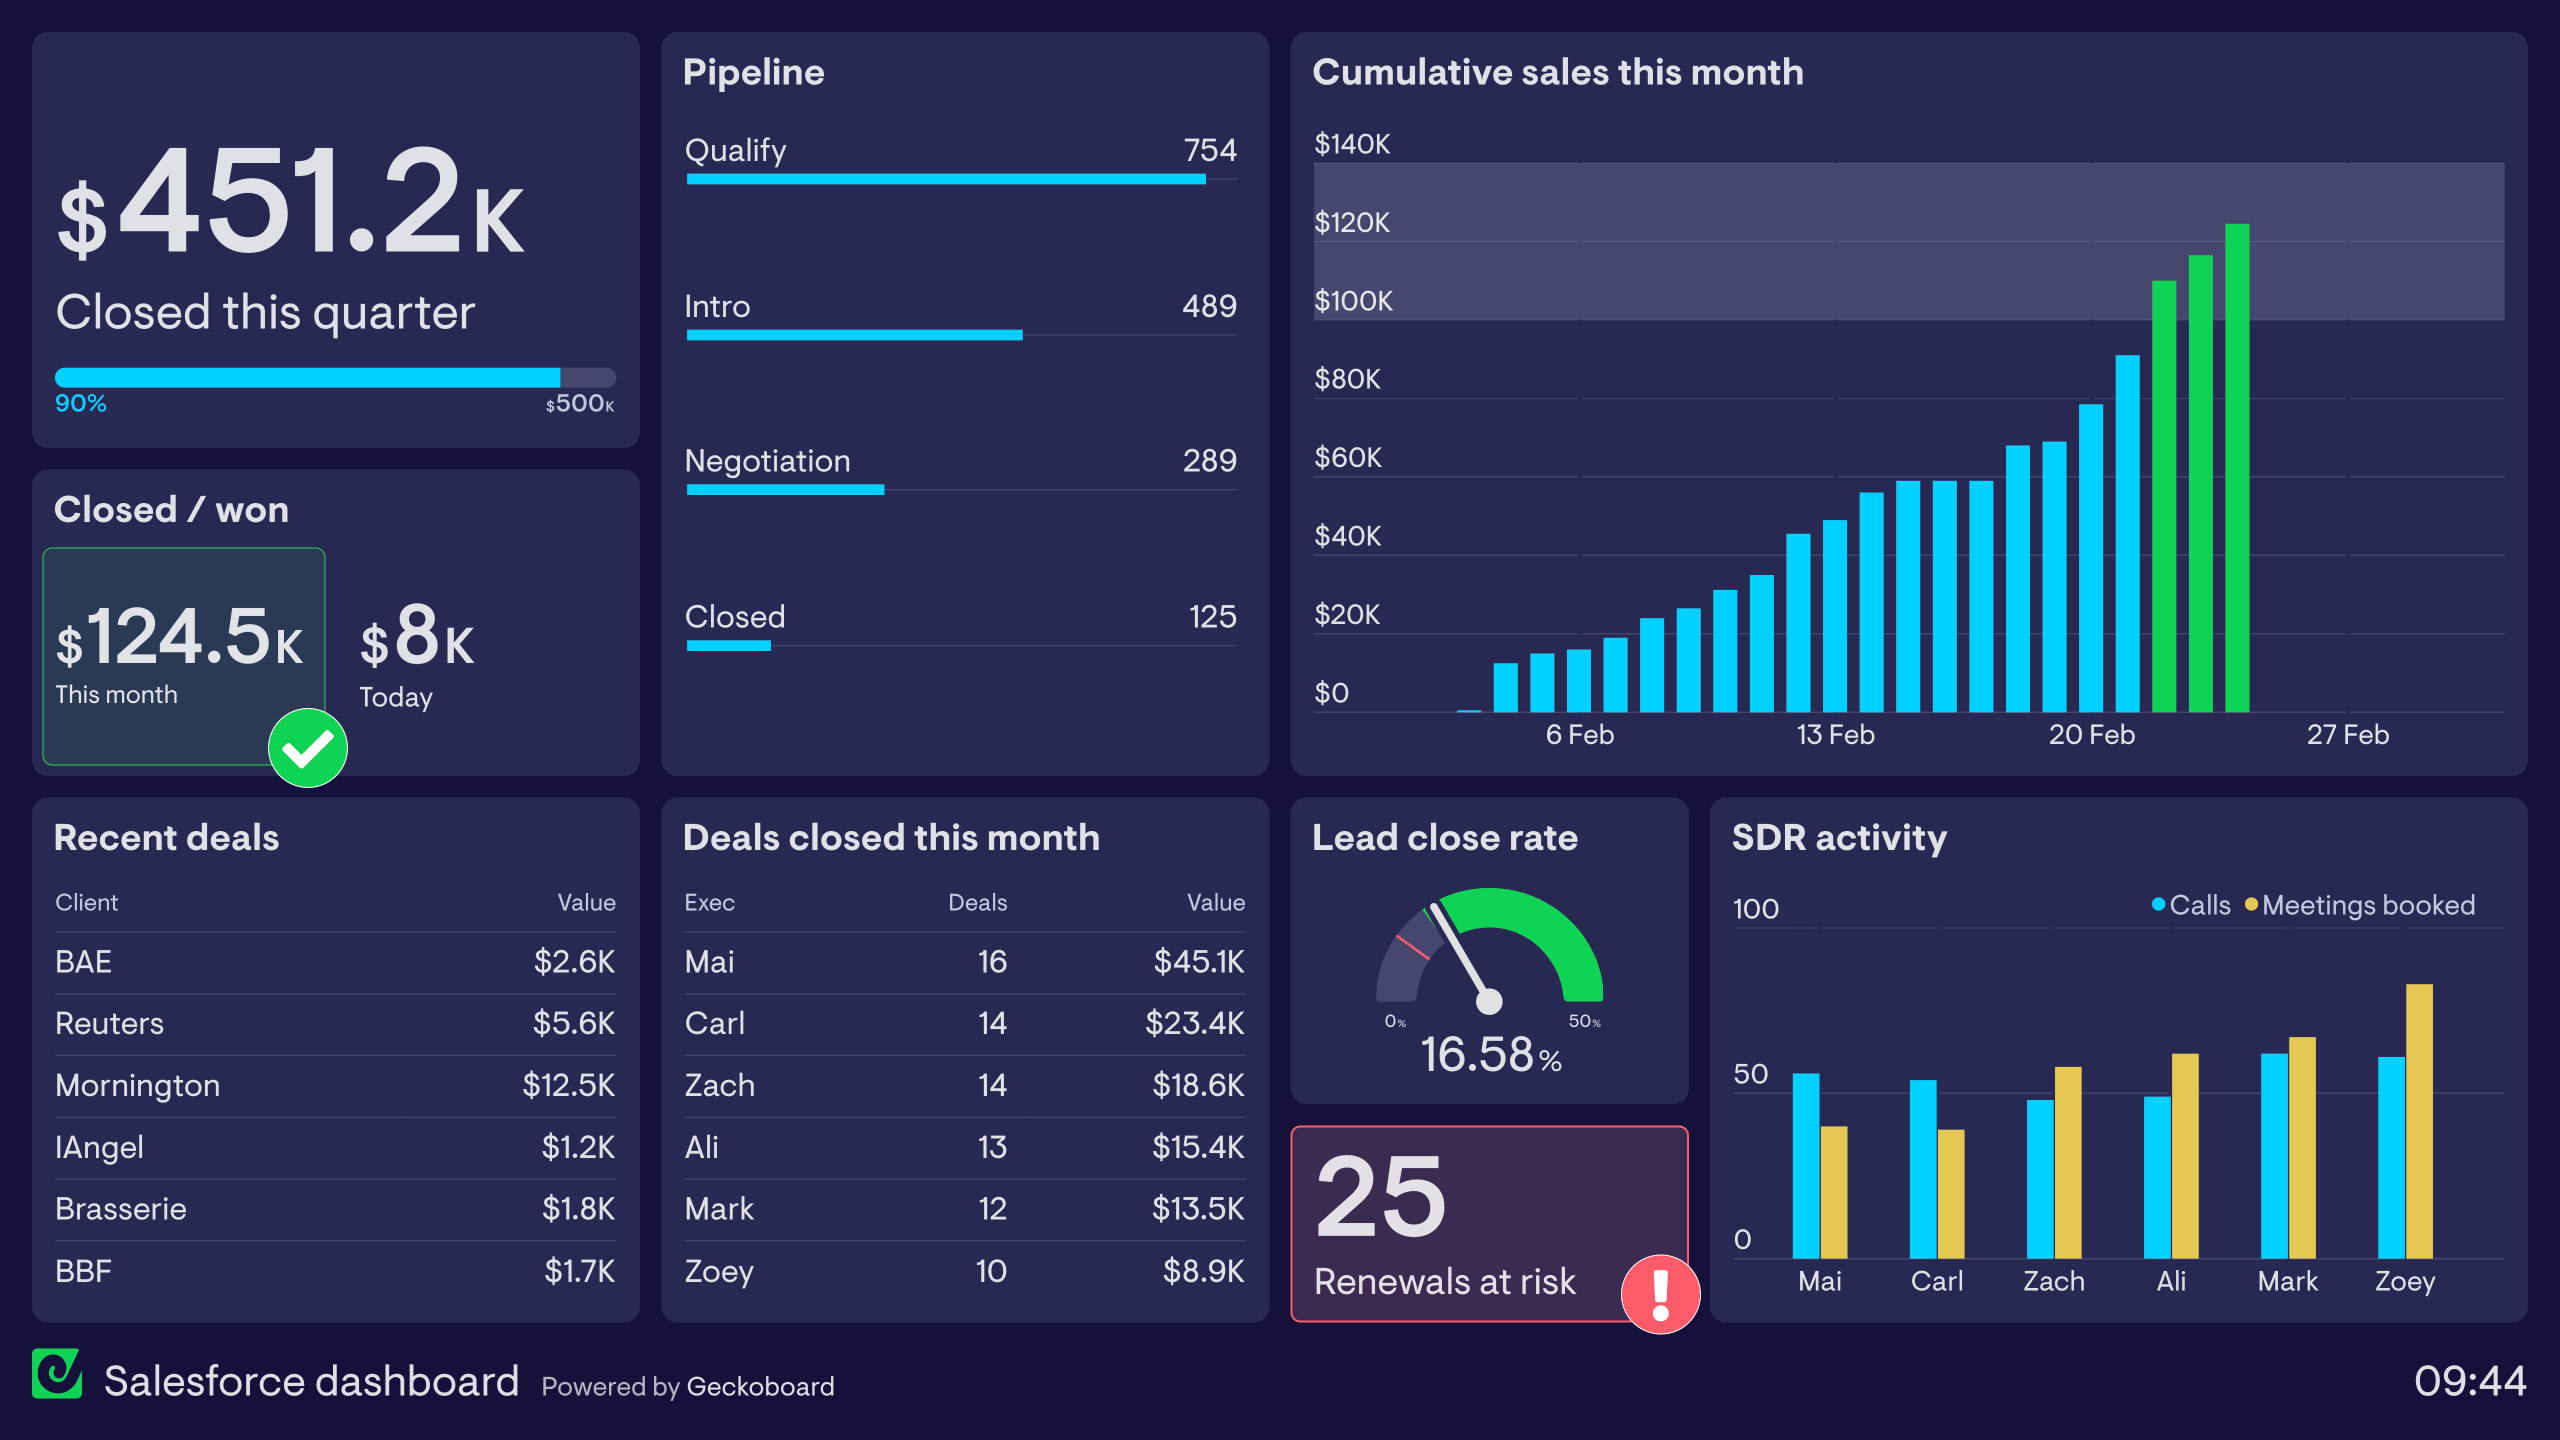
This dashboard is designed to provide a clear overview of your company’s business KPIs, from revenue figures to activity in the sales pipeline. It pulls data from several Salesforce reports, and visualizes those metrics in a way where it’s easy to see your company's progress. It’s the perfect dashboard to displayed on a TV in the office where all members of the team can see it.
In the top left hand corner, the dashboard displays the business’ quarterly revenue figures, against their overall quarterly target. This north star metric helps to keep the entire team on track, and focused on their main goals.
Other metrics like pipeline data, biggest deals and top performing sales executives encourages engagement and helps everyone to stay aware of how their work is positively impacting the business.
Salesforce and Google Analytics dashboard
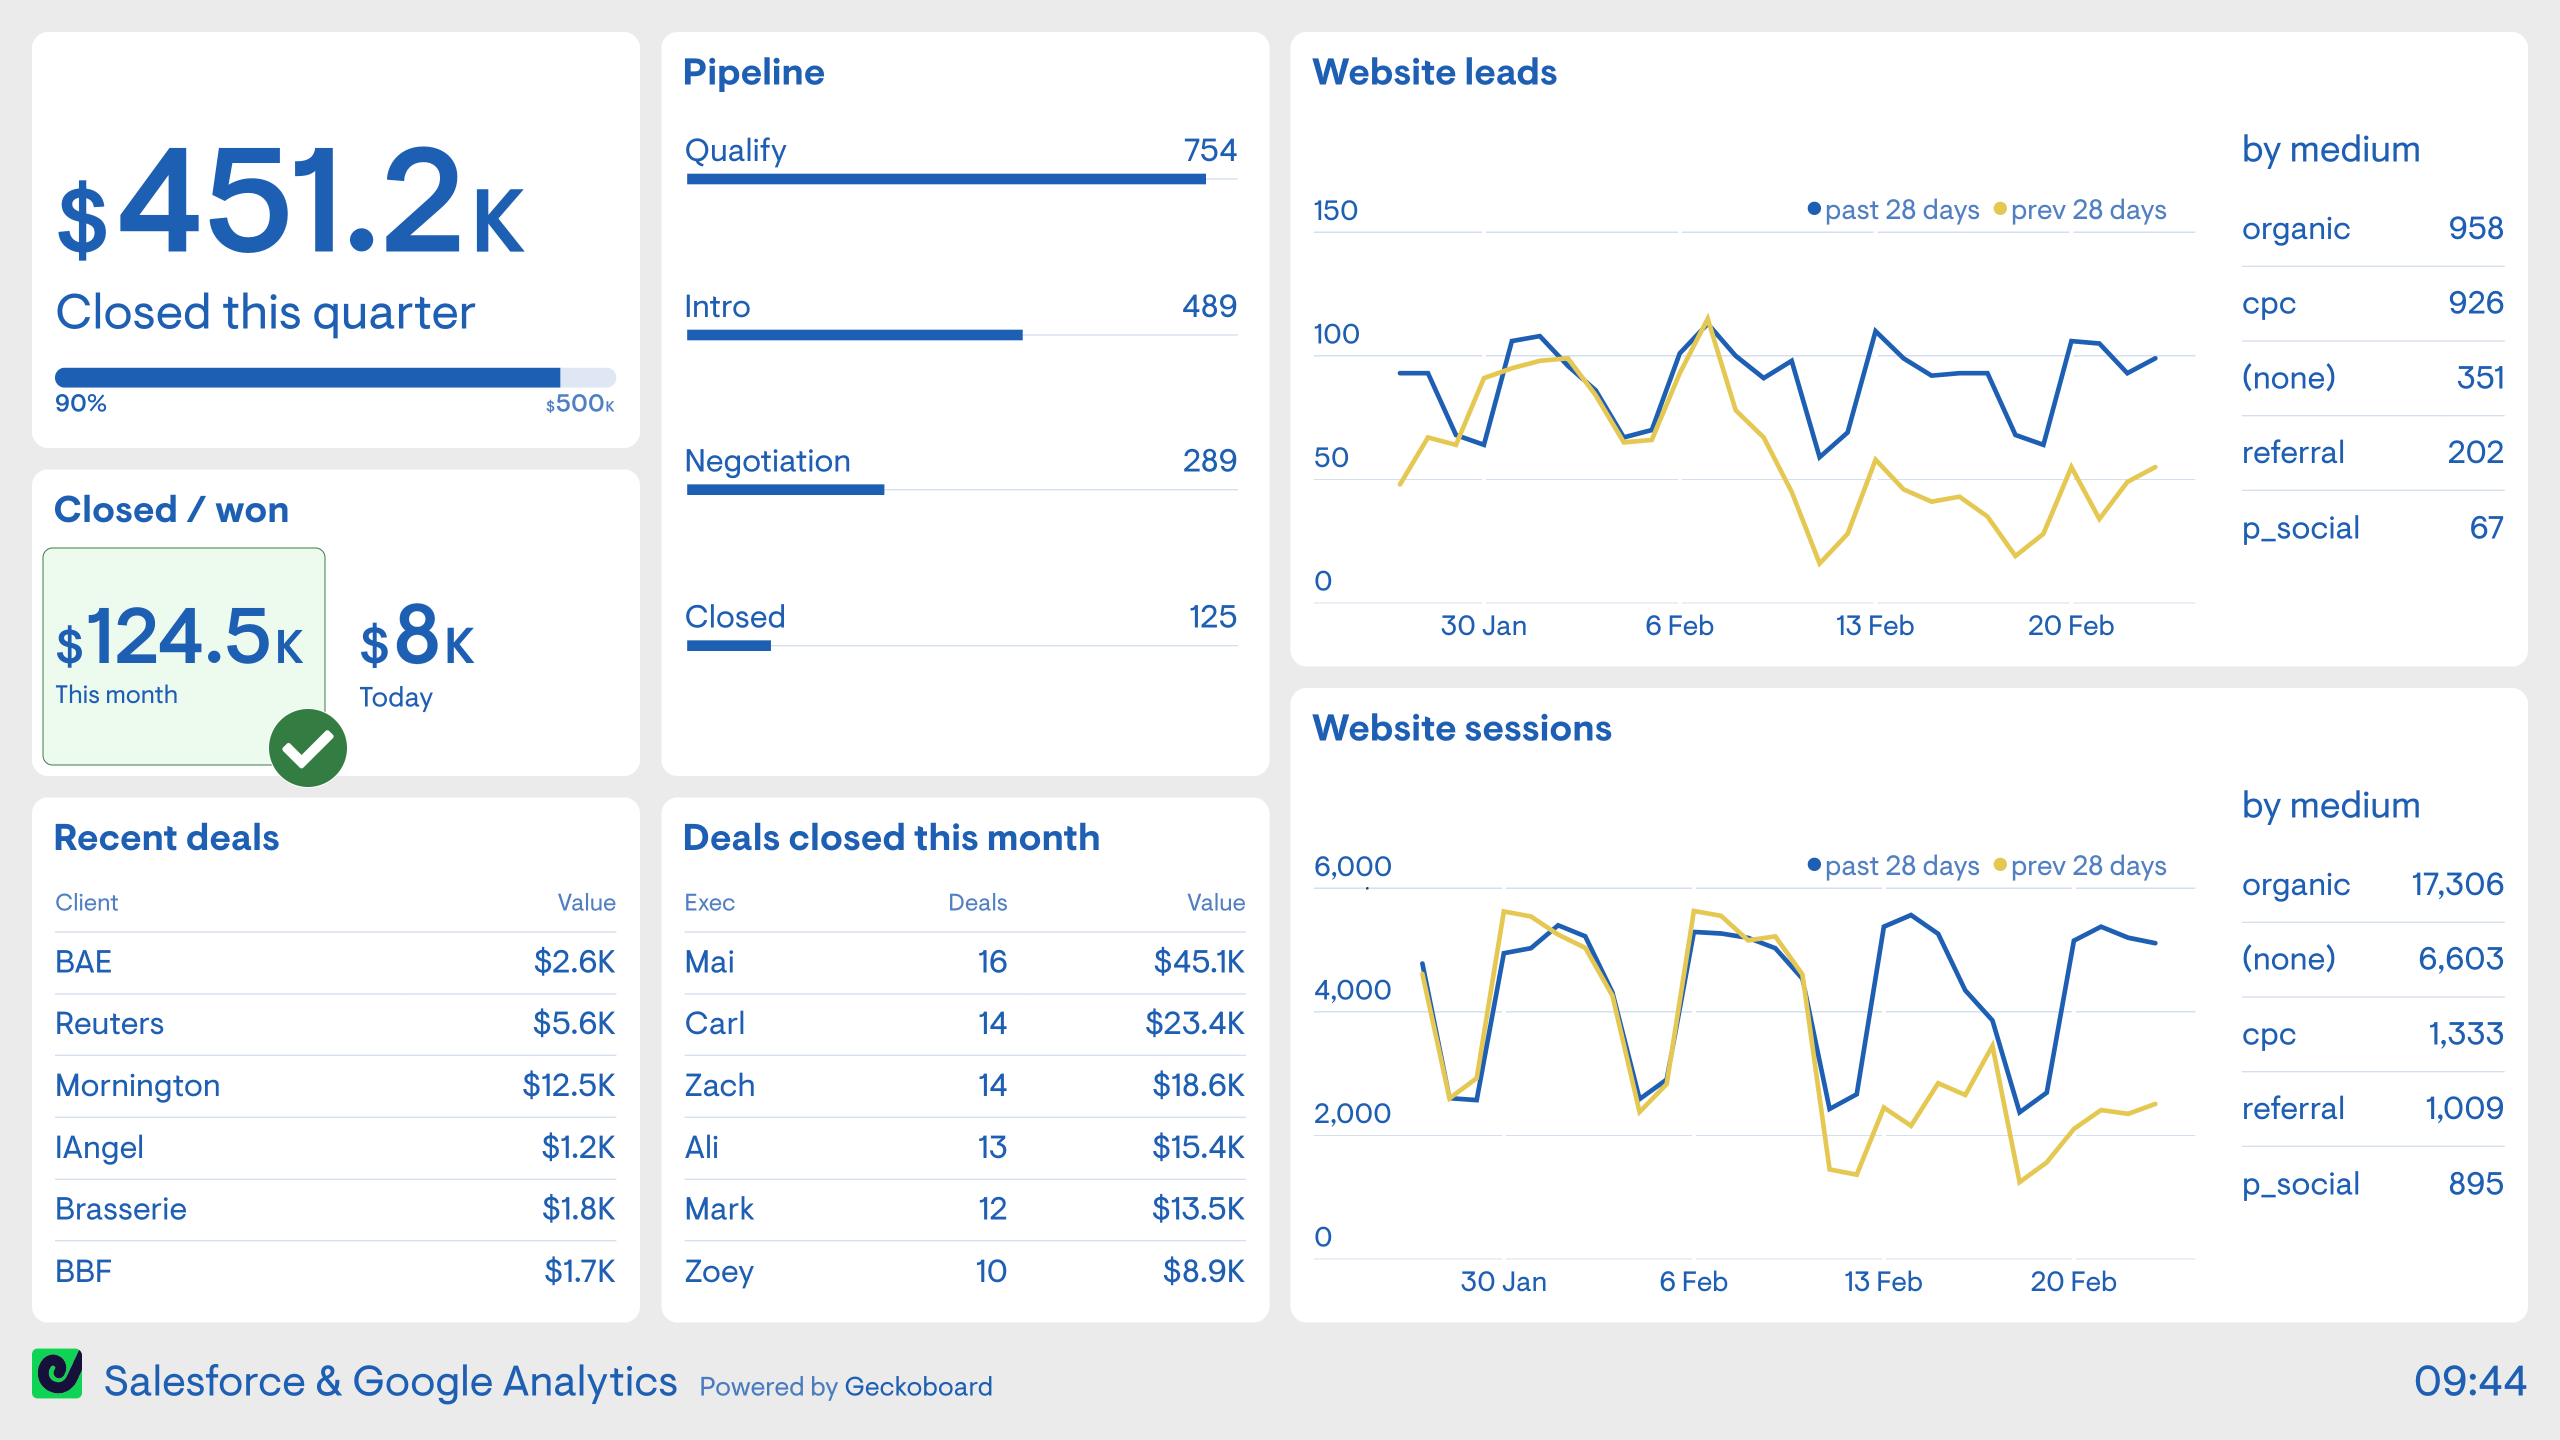
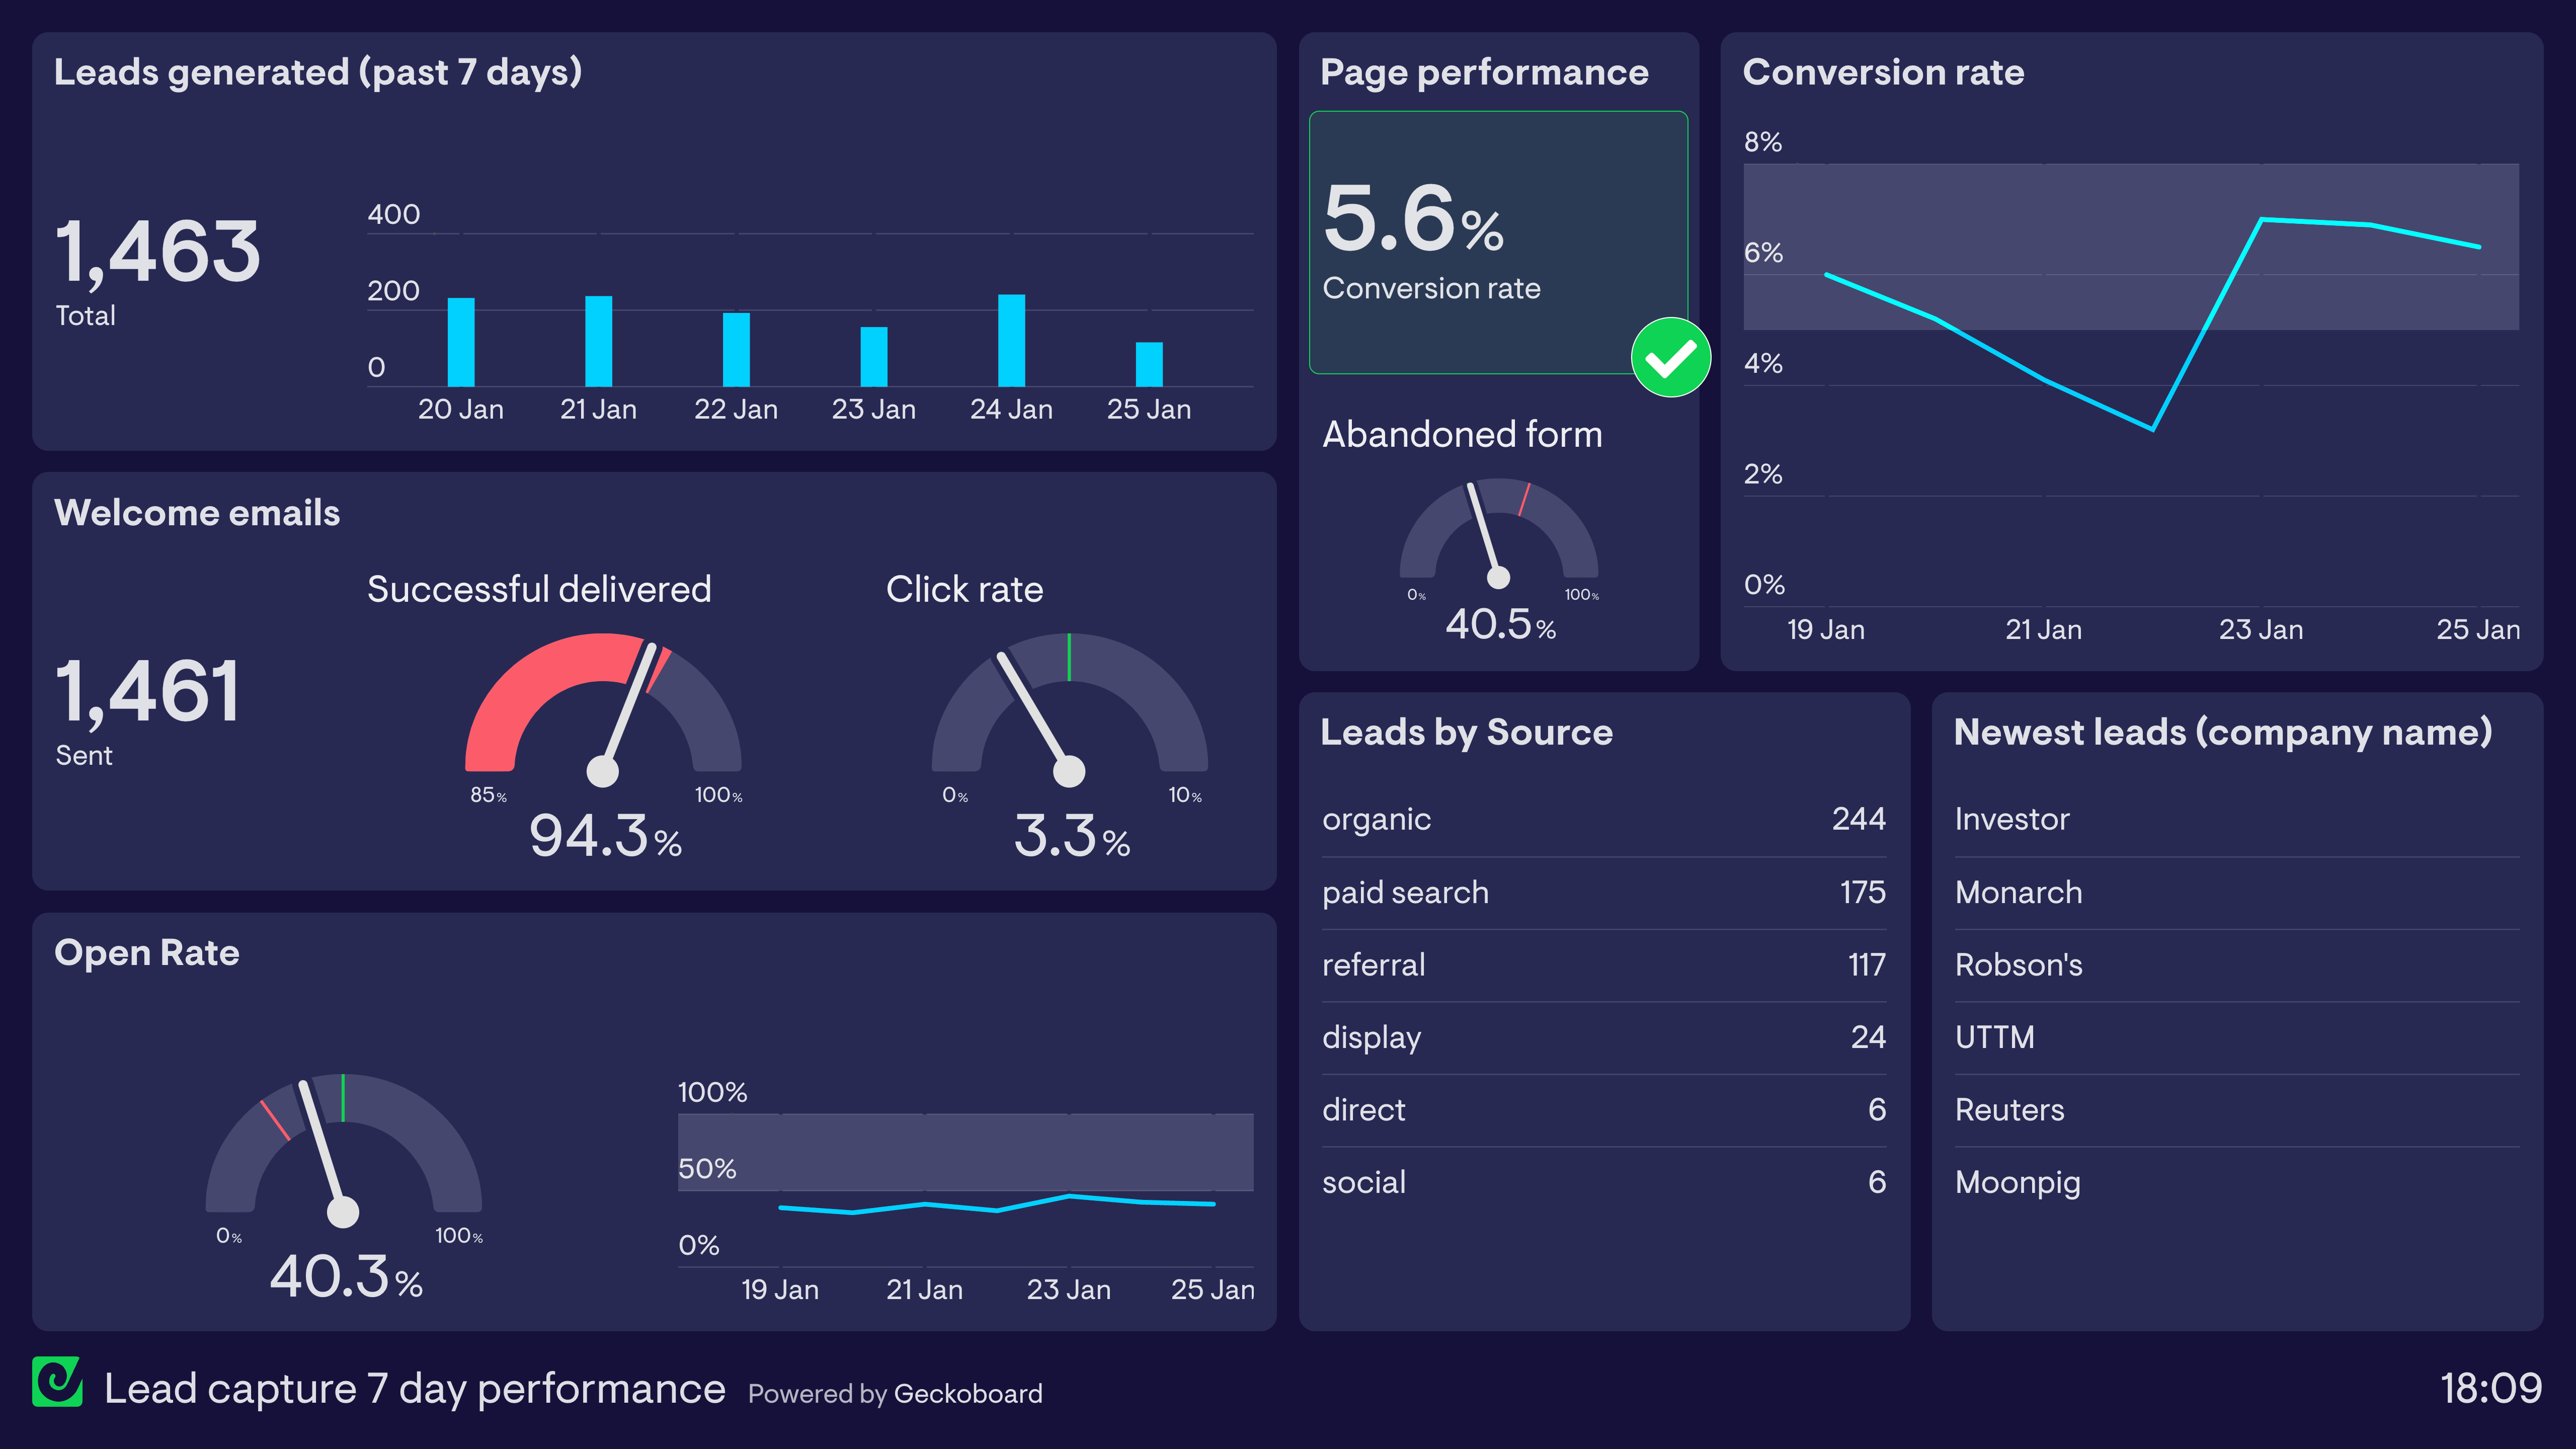
This dashboard shows how, with Geckoboard, your Salesforce data can be displayed alongside data from other sources, such as Google Analytics. As well as some of the Salesforce metrics that were visible on the previous dashboard, we can also see website analytics metrics such as website traffic and new online leads.
Without a dashboard to bring all these metrics together, it’s common for teams to only be exposed to KPIs related to their individual area of work. For example, often, many salespeople do not have access to Google Analytics, and many members of the marketing team do not have access to Salesforce.
Whereas, this big-picture dashboard helps members of both the sales team and marketing team gain a deeper understanding of how the business is performing at every stage of the funnel.
Salesforce and Shopify dashboard
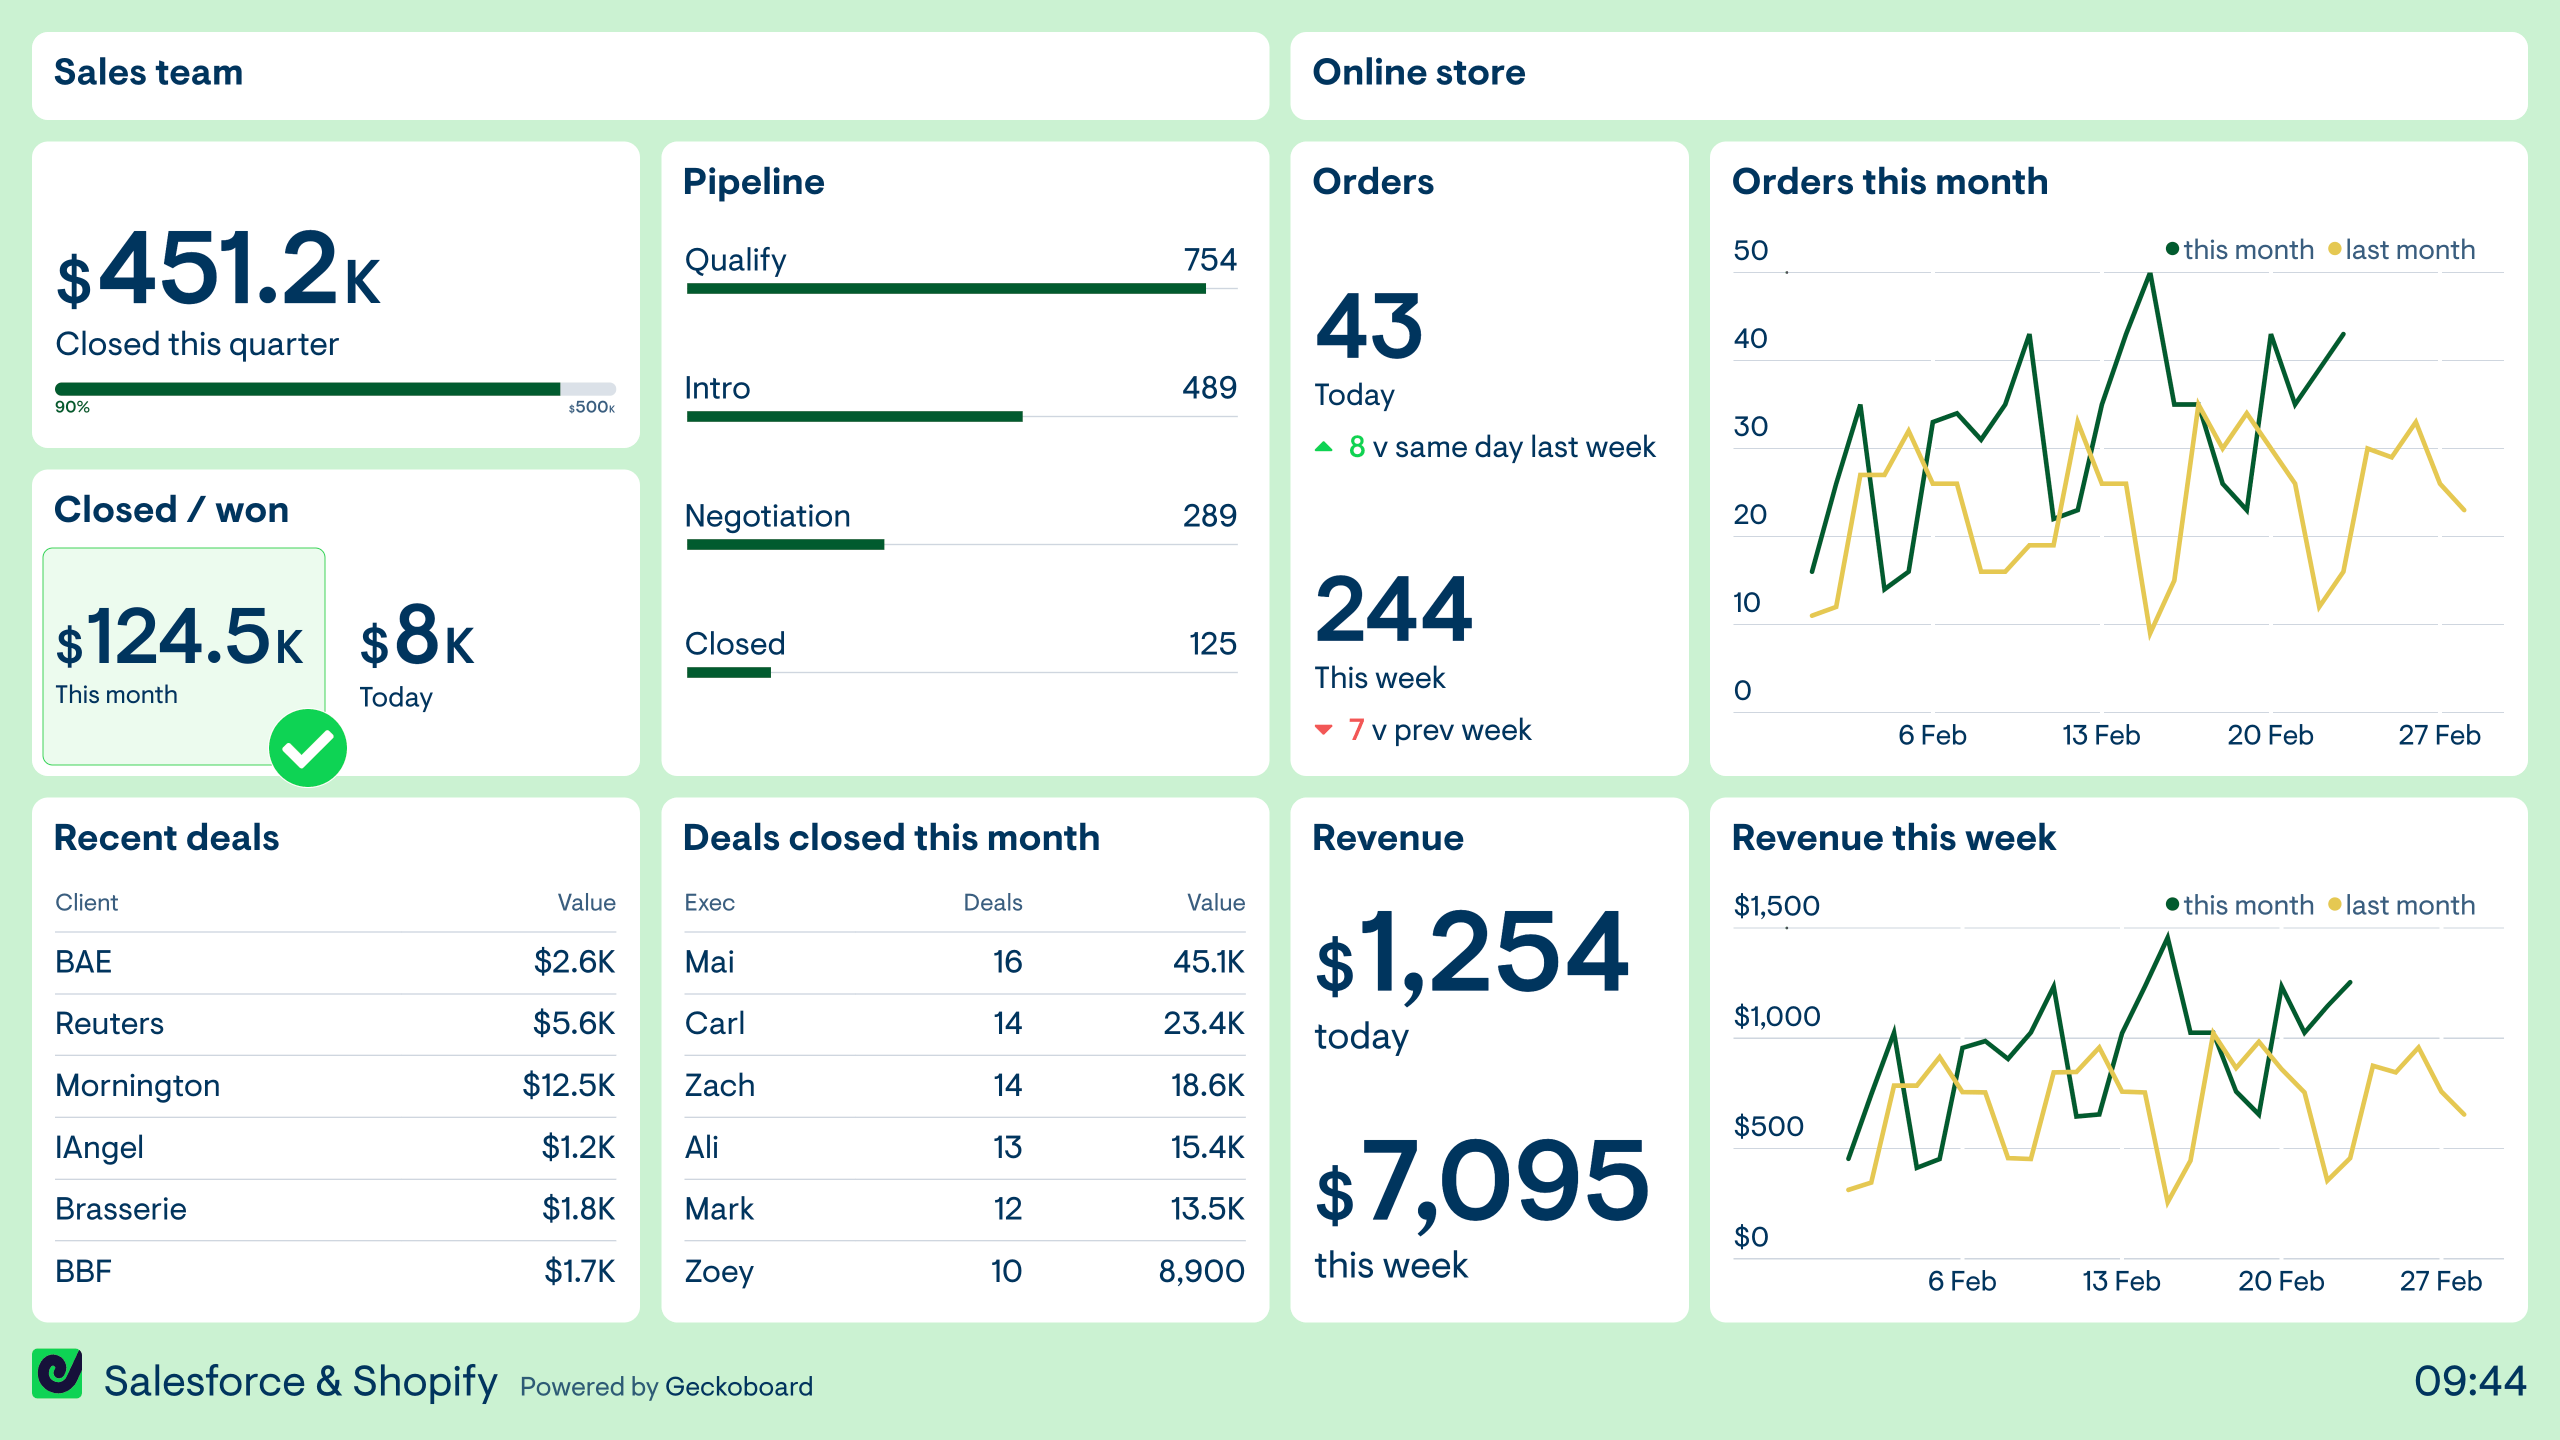
Like the previous dashboard, this dashboard example shows how you can visualize metrics from different data sources in one place. In this case, the company is visualizing metrics from the Sales team who use Salesforce, alongside an online store, powered by Shopify, which is a separate source of revenue for the business.
Being able to see key metrics from different data sources helps teams develop a more holistic awareness and understanding of how the business is performing over time.
Browse other popular examples

A Salesforce dashboard pulls deal, pipeline, and activity data from Salesforce CRM into a live display that teams can monitor without logging into Salesforce. Sales managers use it to keep the team focused on targets and give stakeholders a current view of pipeline without exporting data or building custom Salesforce reports.
Geckoboard is a live dashboard tool that connects directly to Salesforce and your other business tools — Google Analytics, Shopify, HubSpot and more — and turns them into a shareable, TV-ready view. It's designed for teams who want metrics visible to everyone, not just those with a platform licence.
Key metrics include pipeline value by stage, deals won, leads created, conversion rate, revenue vs. target, and activity by rep. Teams connecting Google Analytics or Shopify can layer in web and ecommerce data alongside CRM metrics.
Building a custom Salesforce dashboard is straightforward with Geckoboard's dashboard builder. Connect Salesforce as your core CRM data source, then add Google Analytics or Shopify if you want to combine sales data with web or ecommerce metrics. Pick your metrics and build the view you need, then share with your team as a TV dashboard, shared link, or scheduled snapshot. Start a free trial or learn more about how Geckoboard works.
Use it to monitor sales performance in real time, giving managers and reps a live CRM view without everyone needing to check Salesforce throughout the day. It also helps combine Salesforce pipeline data with marketing and ecommerce metrics in a single dashboard.