Instagram Business data source
We’ve shipped a whole new Instagram Business data source, opening up a range of possibilities for tracking the growth and reach of your Instagram account with Geckoboard.
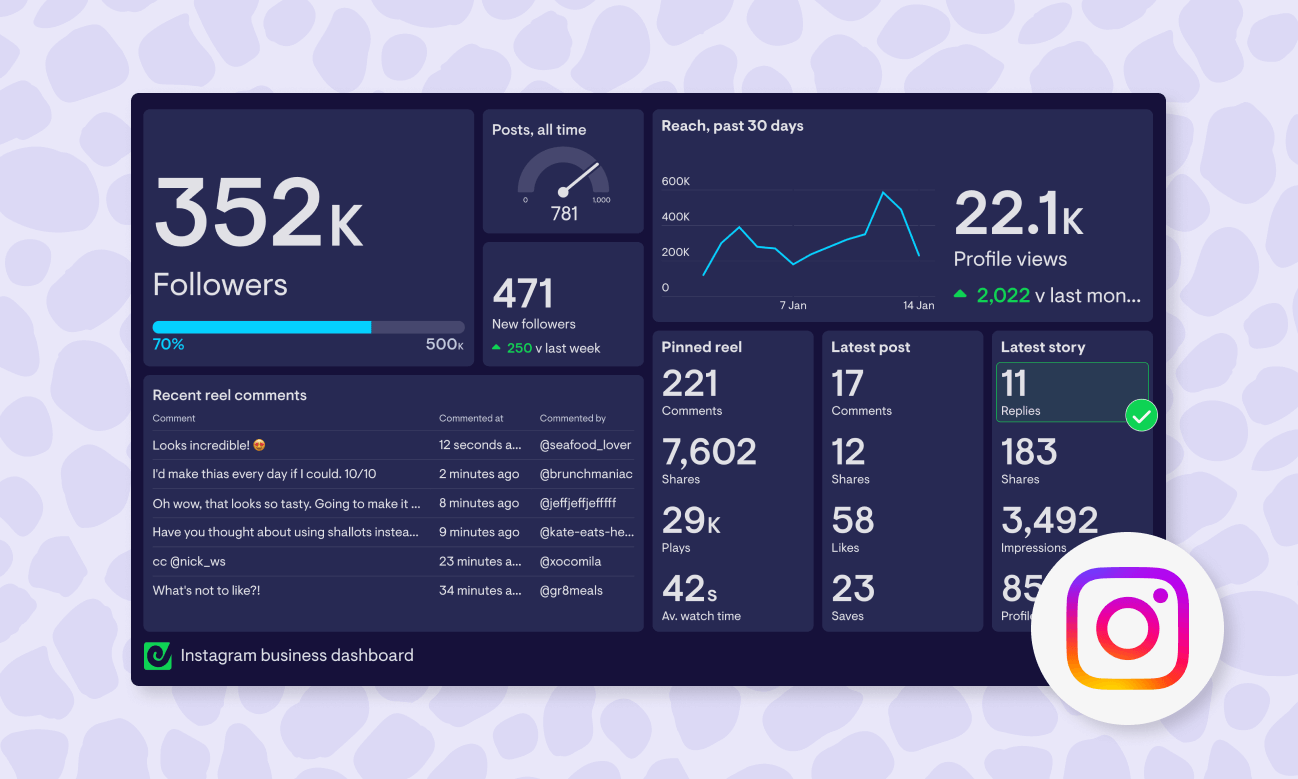
Connect your Instagram Business account and you can now visualize live metrics relating to the performance of your account, as well as individual posts, stories and reels. These include:
- Current total followers
- New followers for a given time period
- Profile views
- Total number of posts
- Post reach (a specific post, or set to most recent)
- Story impressions (specific story, or most recent)
- Average watch time for a specific or most recent reel
- Number of comments on specific or recent posts and reels
- A feed of comments from posts and reels
- …and many more.
The new data source also now takes advantage of many of the other features we’ve rolled out across Geckoboard in recent months, including:
- A more intuitive widget-building experience, allowing you to preview your widget before adding it
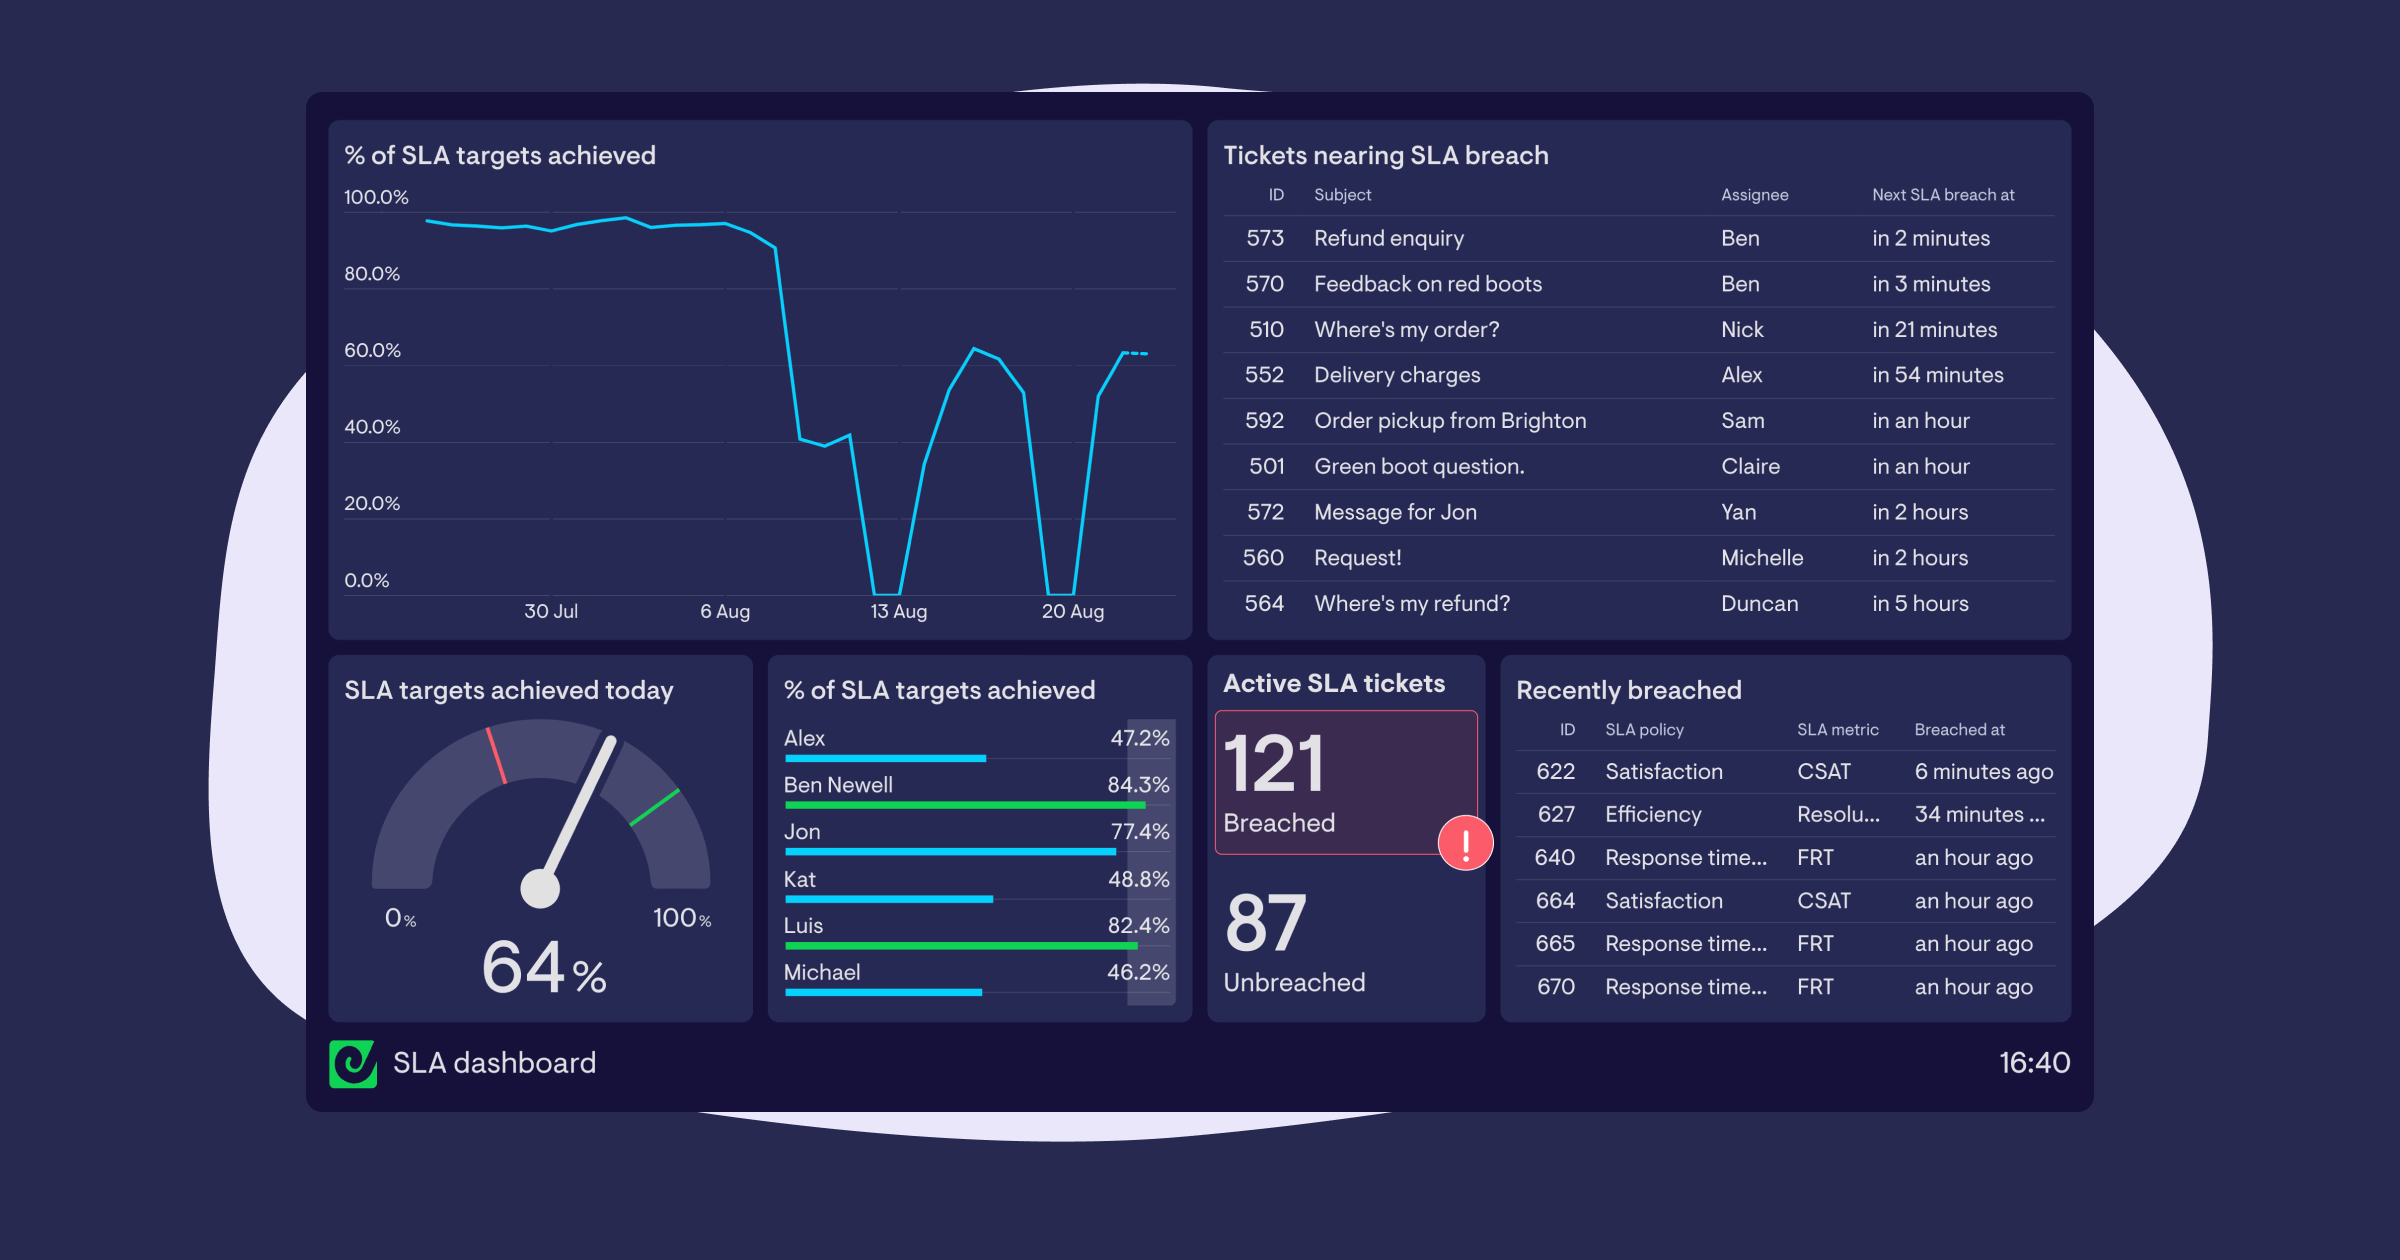
- Support for more visualization types
- Presets for popular metric and visualization combinations
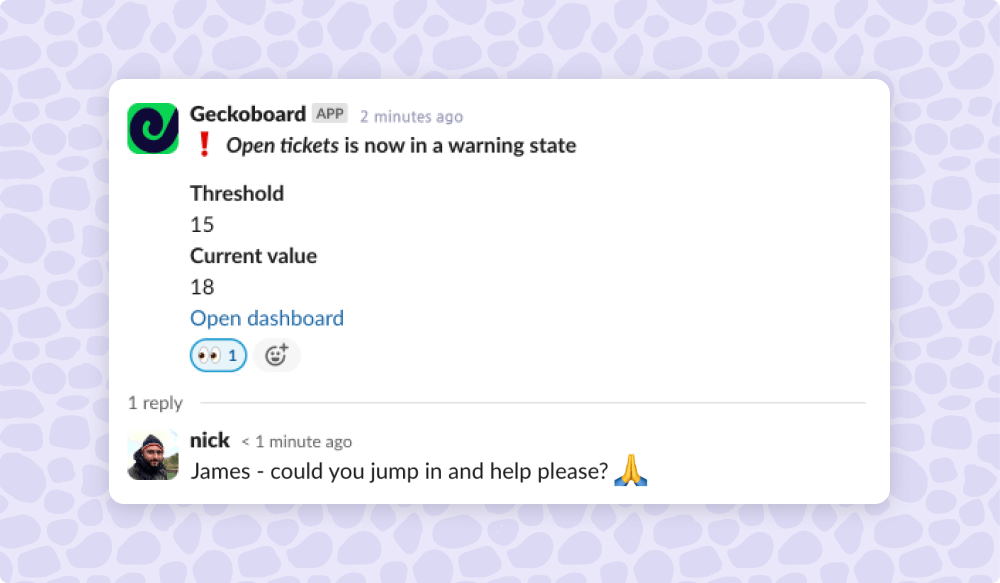
- Support for Slack notifications when your Instagram metrics improve or drop-off
Log in to your Geckoboard account and select Instagram Business to give it spin!
NB: This data source supports Instagram Business accounts only.