Product updates
Add avatars to HubSpot leaderboards and tables
Make your HubSpot dashboard an even more powerful motivator with user avatars.
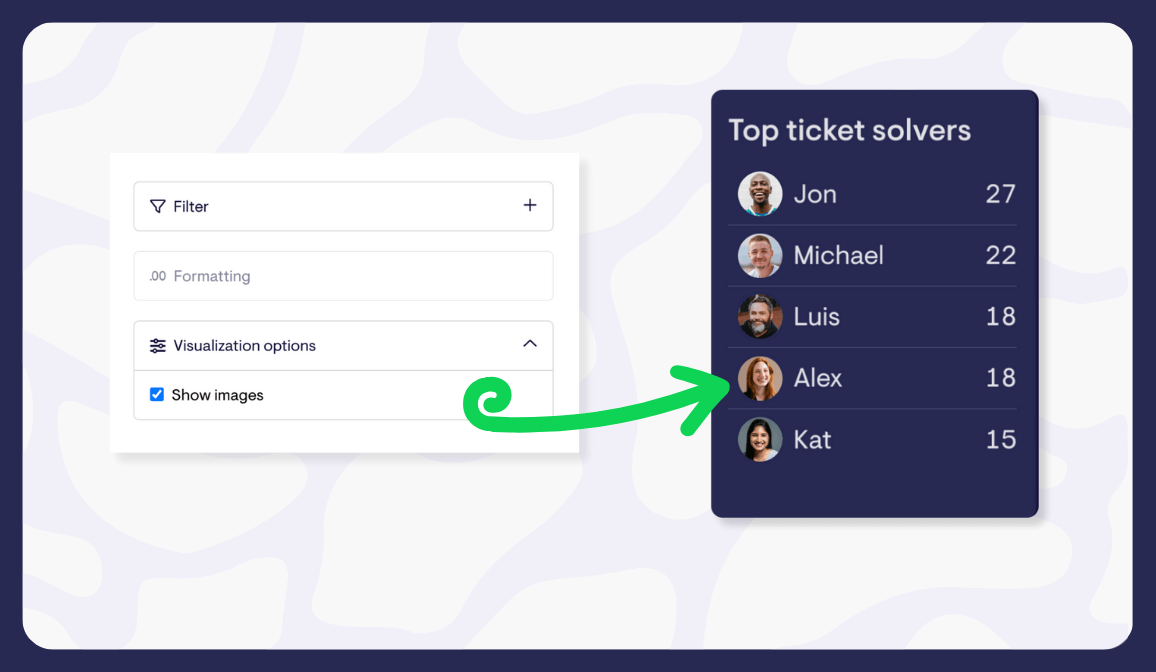
Live leaderboards and table visualizations built with Geckoboard's HubSpot integration now have a new option to 'Show images' that appears when your data relates to deal assignees, owners and creators, and ticket owners.
![]()
Spark some friendly competition between teammates by toggling this on or off to show the profile images of individual reps or agents that have been uploaded to HubSpot. Learn more about how to add team images here.
Company metrics and metrics from custom properties added to HubSpot
Custom properties are core to many people’s use of HubSpot, and often some of a team’s most important metrics are based on them.
We’ve long supported filtering on custom properties, but now you can create metrics from any numeric or currency custom property on a Deal. For example, if you track Commission as a custom deal property, you can now show the total commission earned by rep as a leaderboard on your dashboard.
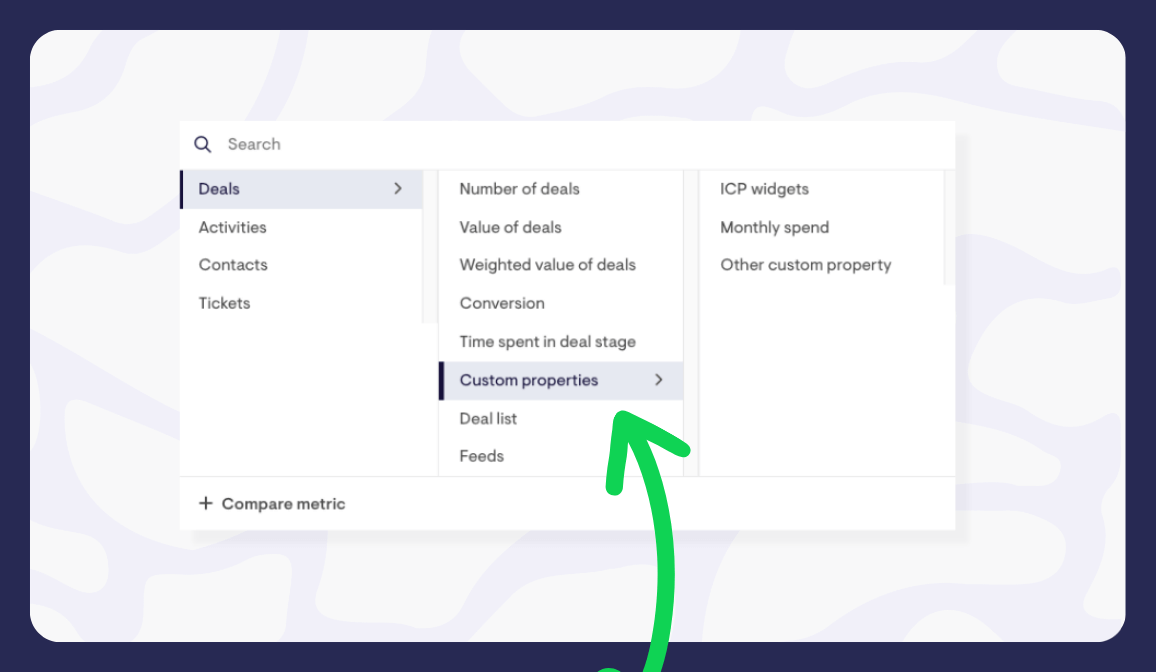
We’ve also introduced support for Company-related metrics, plus you can now filter your Deal metrics on Company information, offering a more complete view of your HubSpot data.
HubSpot ticket metrics now supported
Hot on the heels of our recent re-launch of our HubSpot integration, we’ve added a whole new category of metrics you can bring into Geckoboard from HubSpot: ticket metrics.
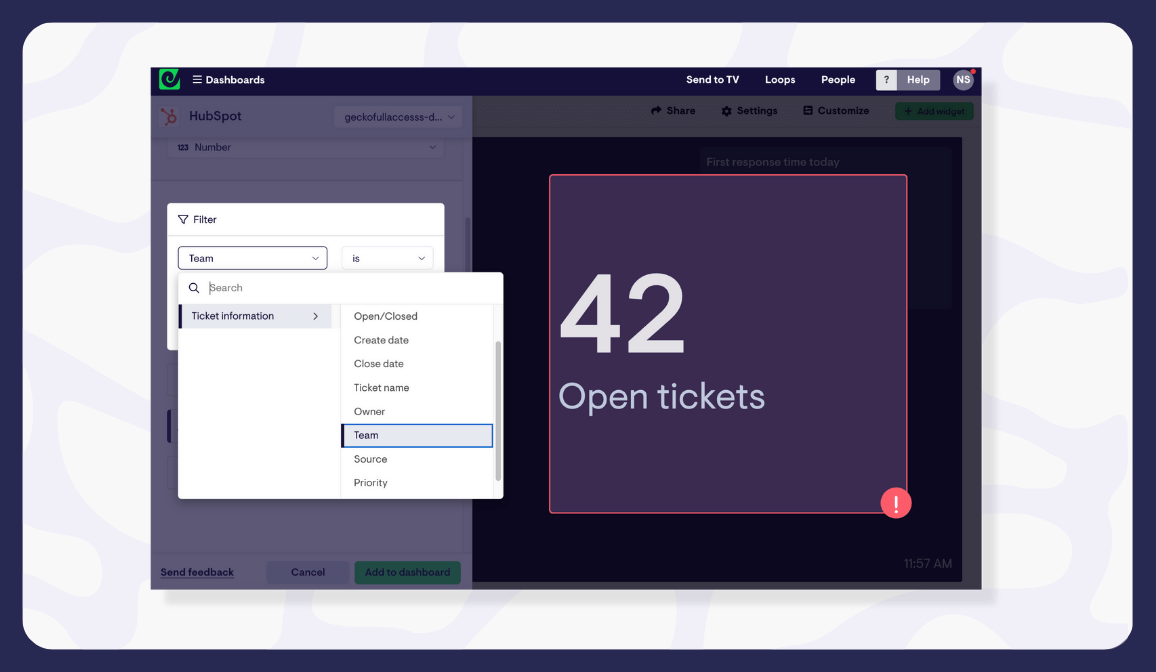
Teams who use HubSpot's Service Hub can now build real-time dashboards for monitoring metrics like tickets created, open tickets, tickets closed, average time to close and average first response time, as well as live lists of tickets.
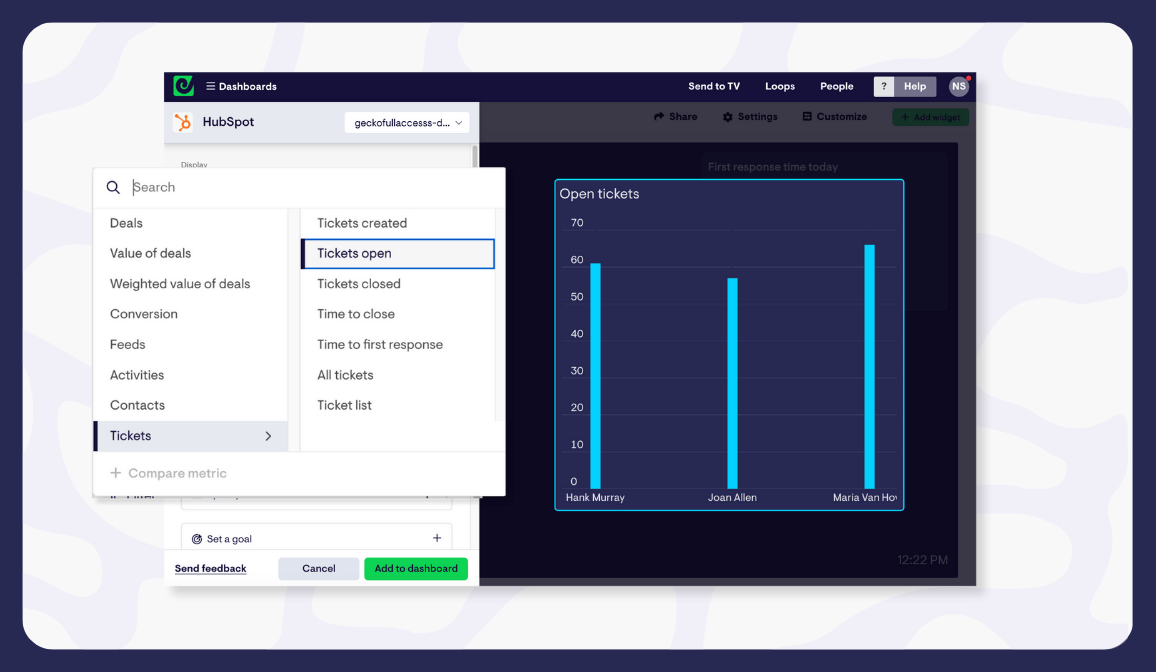
All of these can be filtered by pipeline too, and broken out by dimensions like ticket owner, team, ticket status, priority and source, meaning customer service teams can monitor and improve every aspect of their support operation.
Ticket metrics can be found alongside existing sales metrics within our HubSpot integration. A small number of users who connected HubSpot over the past few months may need to reconnect to HubSpot in order for us to pull through this new type of data. If they’re missing for you, click your initials in the top right of your Geckoboard account, head to Admin >> Connections and click the reconnect button next to HubSpot.
More time periods available when using our API
We've added support for 'Yesterday', 'Last week', and 'Last month' time periods when building widgets powered by our Datasets API.
Improved image and text widgets
Dashboards don’t always have to be full of mission-critical data. Sometimes an image or timely written message* can grab your team’s attention and keep them engaged with your dashboard like nothing else.
So we’ve shipped some quality of life improvements to our image and text widgets to make it easier to customize your dashboards with personal touches, useful messages, team photos, individual shoutouts… whatever’s going to get your team checking back over again.
Image widgets now support direct upload of images in jpeg, png, webp, svg and gif formats, up to a maximum of 5MB in size. We’ve kept the option to add a link to an image file hosted elsewhere, such as Dropbox, for more flexibility.
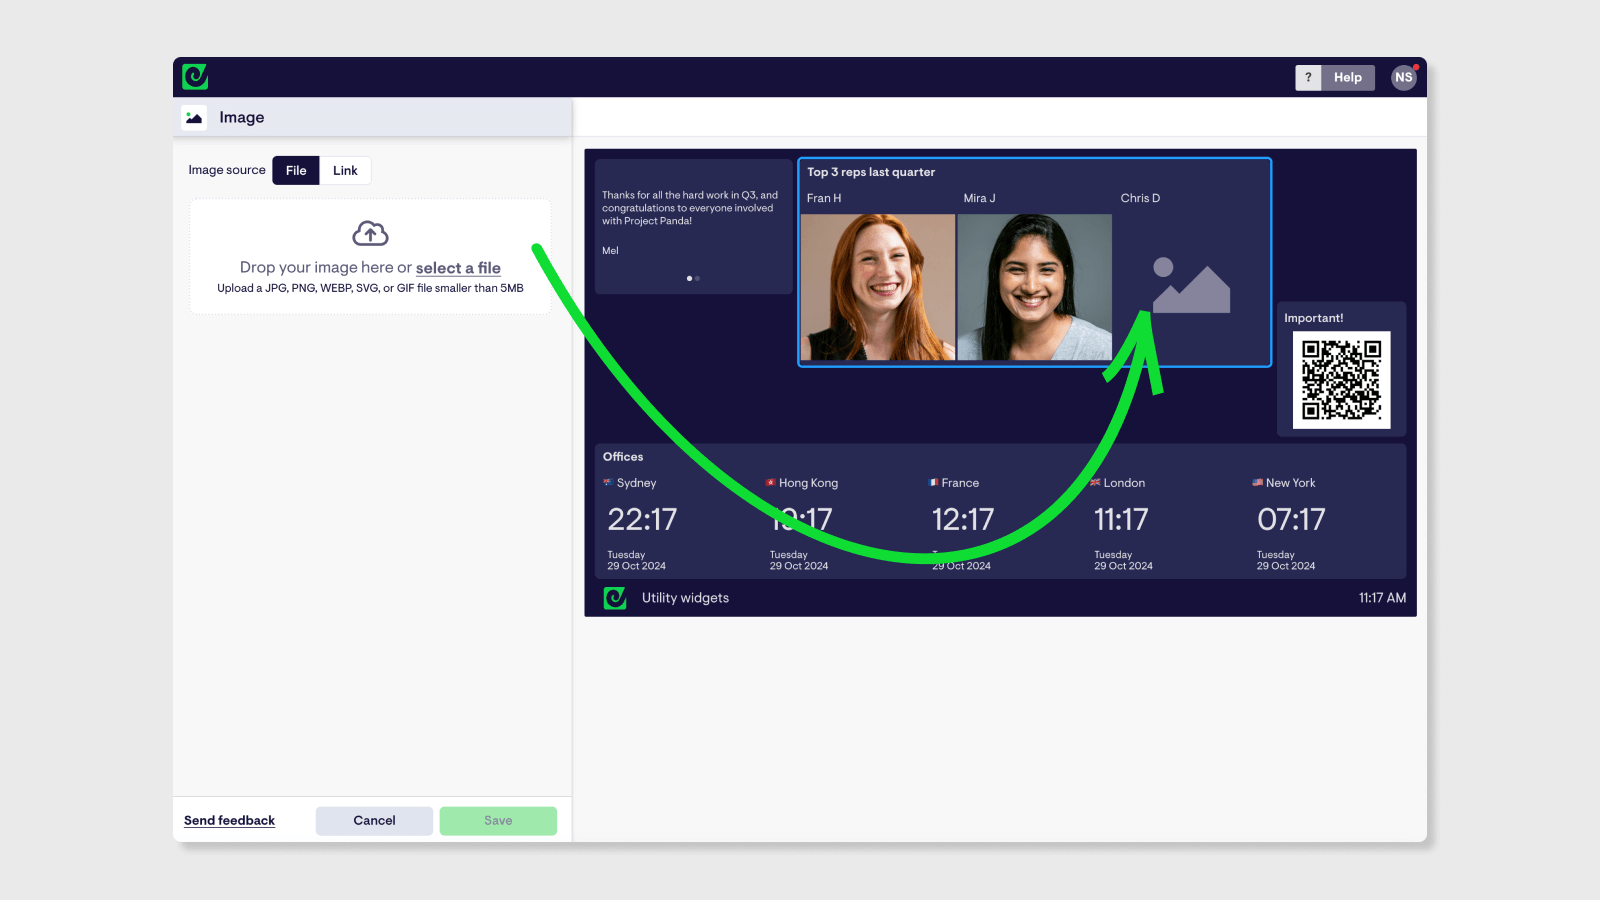
Text widgets are now easier to build, and Markdown is now supported. Check out our handy guide for how to format text to include links, lists, highlights, emoji and more.
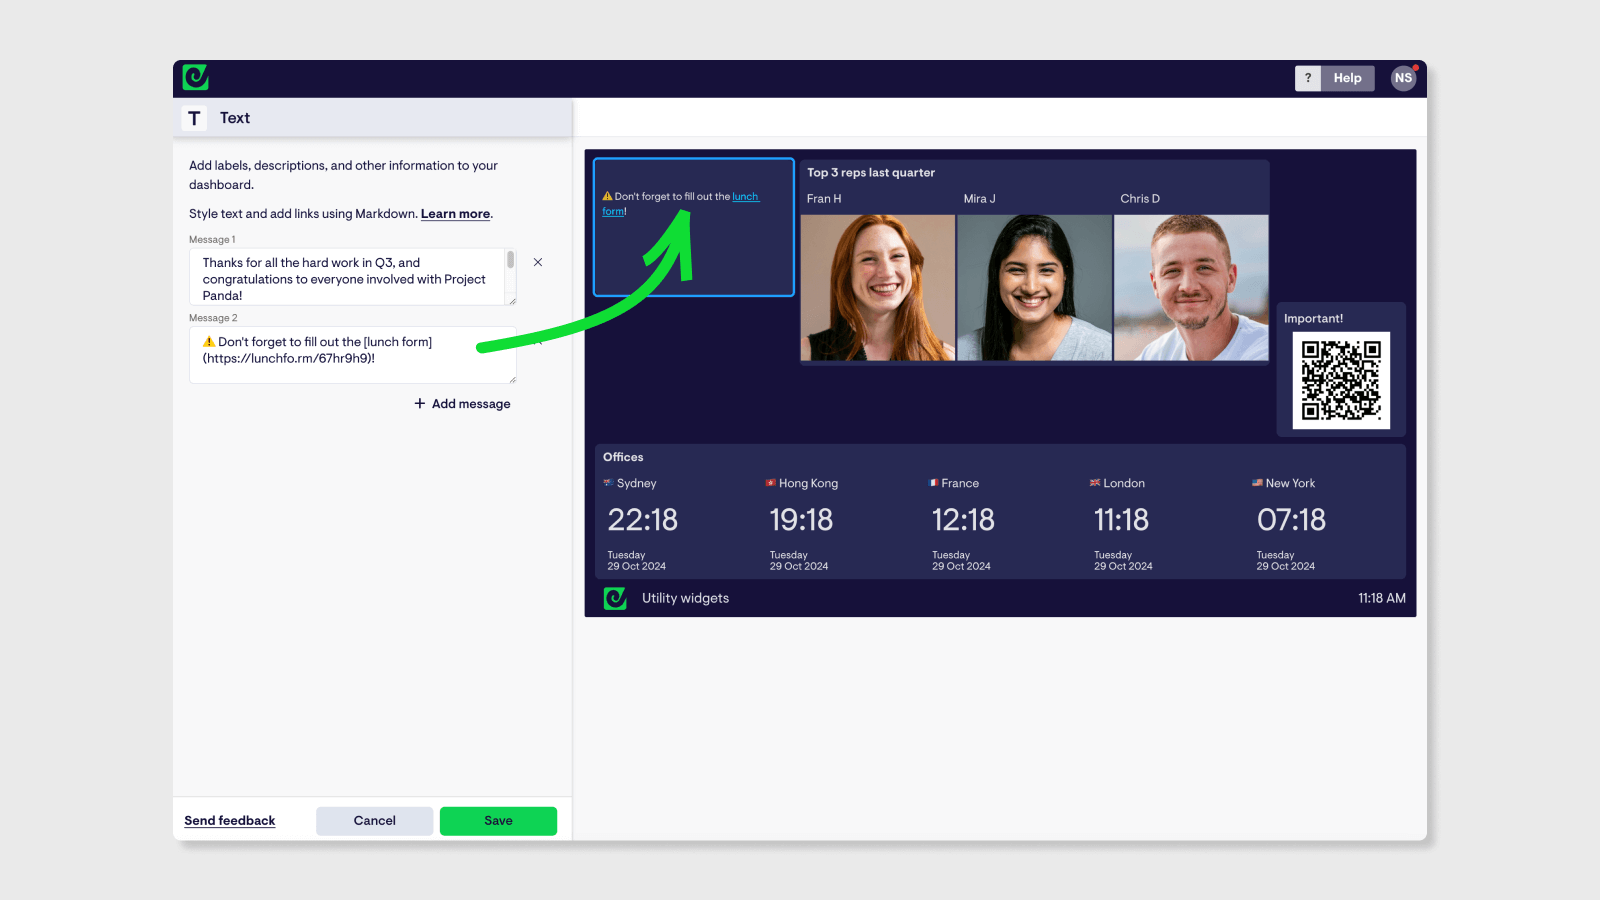
You can find our new image and text widgets - as well as QR code and clock widgets - under ‘Dashboard tools’ when adding a new widget.
--
*After nearly running out of money, one Geckoboard customer saved their startup by using a text widget to inject some urgency, by updating their team daily with how many days of cash were left in the bank...(!) Find some other inspiration in this post
Enrich tables and leaderboards with images [Zendesk and Shopify]
Leaderboards and tables built with our Shopify, Zendesk Support and Zendesk Agent Status data sources now have the option to toggle images on or off when displaying certain metrics.
Zendesk Support and Agent Status: See agent avatars when visualising metrics related to ticket assignees, agent status or workload. Examples of metrics you can rank agents by include tickets solved today, average first reply time this week, CSAT over the month and agent availability sorted by number of current work items. Ideal for understanding everyone's performance at a glance, and sparking a little friendly competition between agents.
Shopify: Display product images when showing metrics related to product variants, such as gross sales, average order value and unfulfilled orders. Useful for quickly understanding how specific products are performing.
Adding images to your own leaderboards and tables is as easy as ticking the new ‘Show images’ checkbox that appears when setting up compatible widgets.
Improved HubSpot data source
We’re thrilled to launch a brand new integration with HubSpot that offers a whole range of new sales metrics and filters, support for custom properties, and massively improved performance.
What’s new
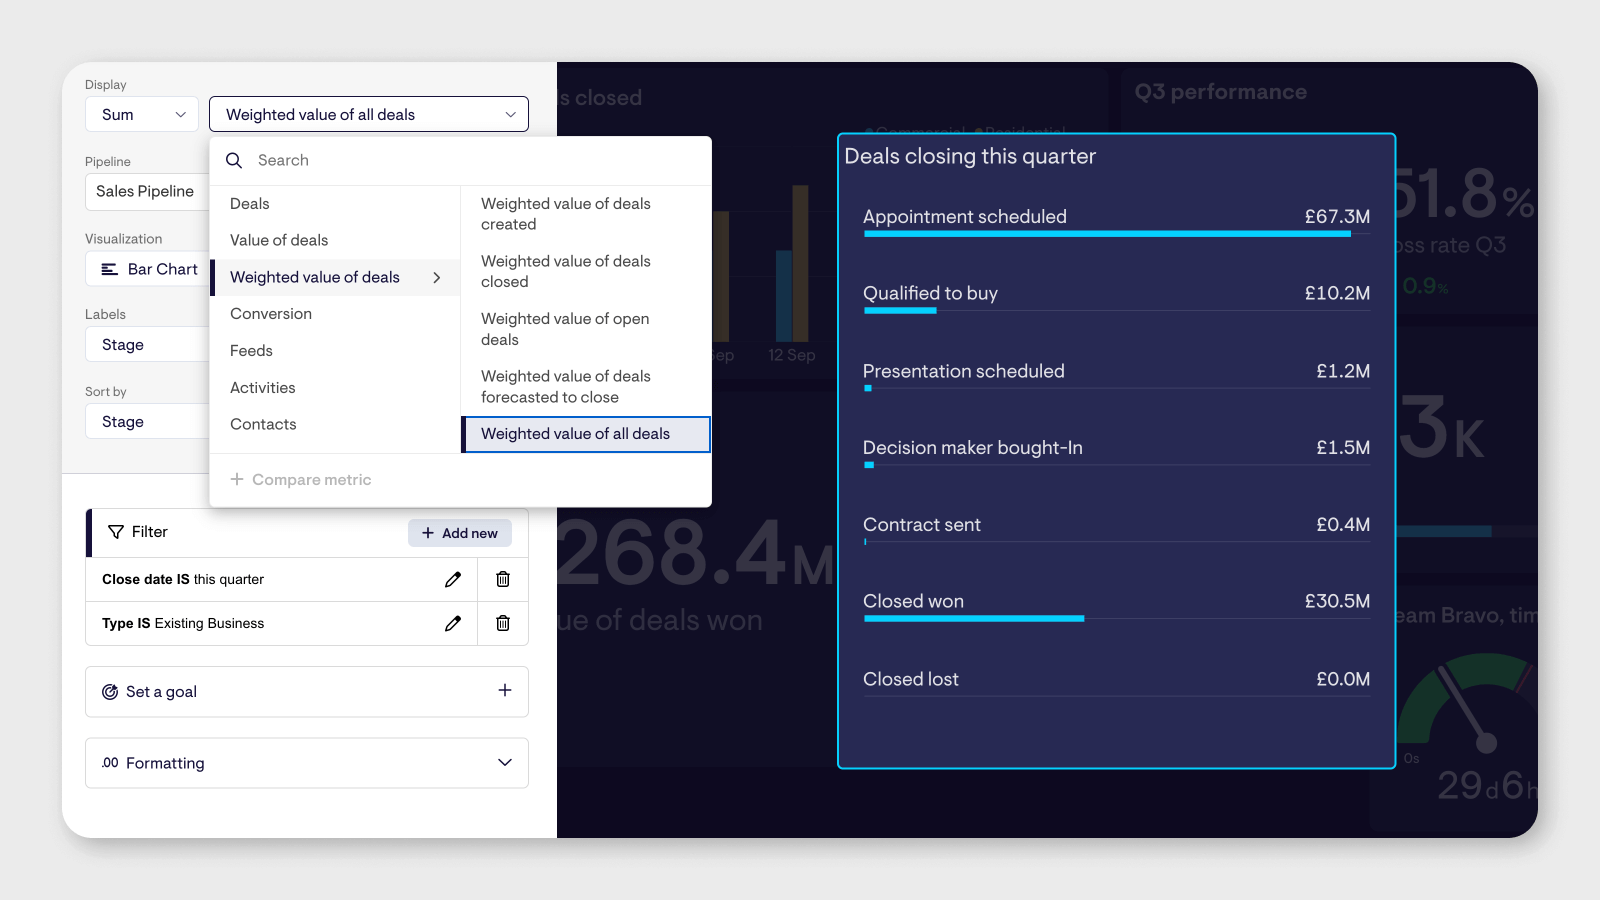
Access more metrics from HubSpot: You can now visualize many more sales-focused metrics from HubSpot, covering deals, deal value (including weighted value of deals), contacts and team activities. To give you even more flexibility, the integration now also supports a wider range of filters, including custom properties, and dates falling in the future are now supported too.
Improved performance: We’ve rewritten our HubSpot integration from the ground up to provide a much snappier and reliable experience when visualizing large amounts of HubSpot data. HubSpot widgets now update more frequently, with most metrics updating every 10 minutes, and some updating instantly when deals or activities are updated in HubSpot.
New widget-building experience: Creating HubSpot widgets got a whole lot easier. All the options you need are now laid out in a more organized way, and a live preview lets you fine-tune and adjust your widget before adding it to your dashboard.
We’re continuing to expand our integration over the coming months, so get in touch with our team if you have any requests or feedback.
How to access it
Create a Geckoboard account or log in, and select HubSpot from our list of data sources. If it’s your first time connecting Geckoboard to HubSpot, simply follow the instructions to connect your HubSpot account and access the latest version. More detail on that here.
If you're already using Geckoboard’s existing HubSpot integration, you’ll need to reconnect your HubSpot account the next time you create a HubSpot widget. Your old HubSpot widgets will continue to work, however we strongly recommend replacing them to use the new version over the coming weeks.
If you have any questions or need help doing this, just drop us a line!
Adjust the sort order of tables, bar and column charts
We’ve added the ability to customise the sorting behaviour on tables, bar charts and column charts.
From a new ‘sort order’ dropdown you can choose which dimension you want to order your data by in your visualisation, and adjust whether the values are shown in an ascending or descending order.
This has been rolled out across the following data sources: Aircall, Facebook, Facebook Ads, Google Ads, Google Analytics 4, Google Search Console, HubSpot, Instagram, Intercom, LinkedIn, LinkedIn Ads, Matomo, Pipedrive, Shopify, Stripe, YouTube Analytics and Zendesk Support.
Share snapshots of dashboards in Slack whenever you need to
Want to give your dashboards more visibility in Slack, without waiting for a snapshot to trigger? We’ve updated our Slack integration so that any sharing link pasted into Slack can automatically take a snapshot of your dashboard, and display it then and there, making it even easier for teams and stakeholders to see your important numbers.
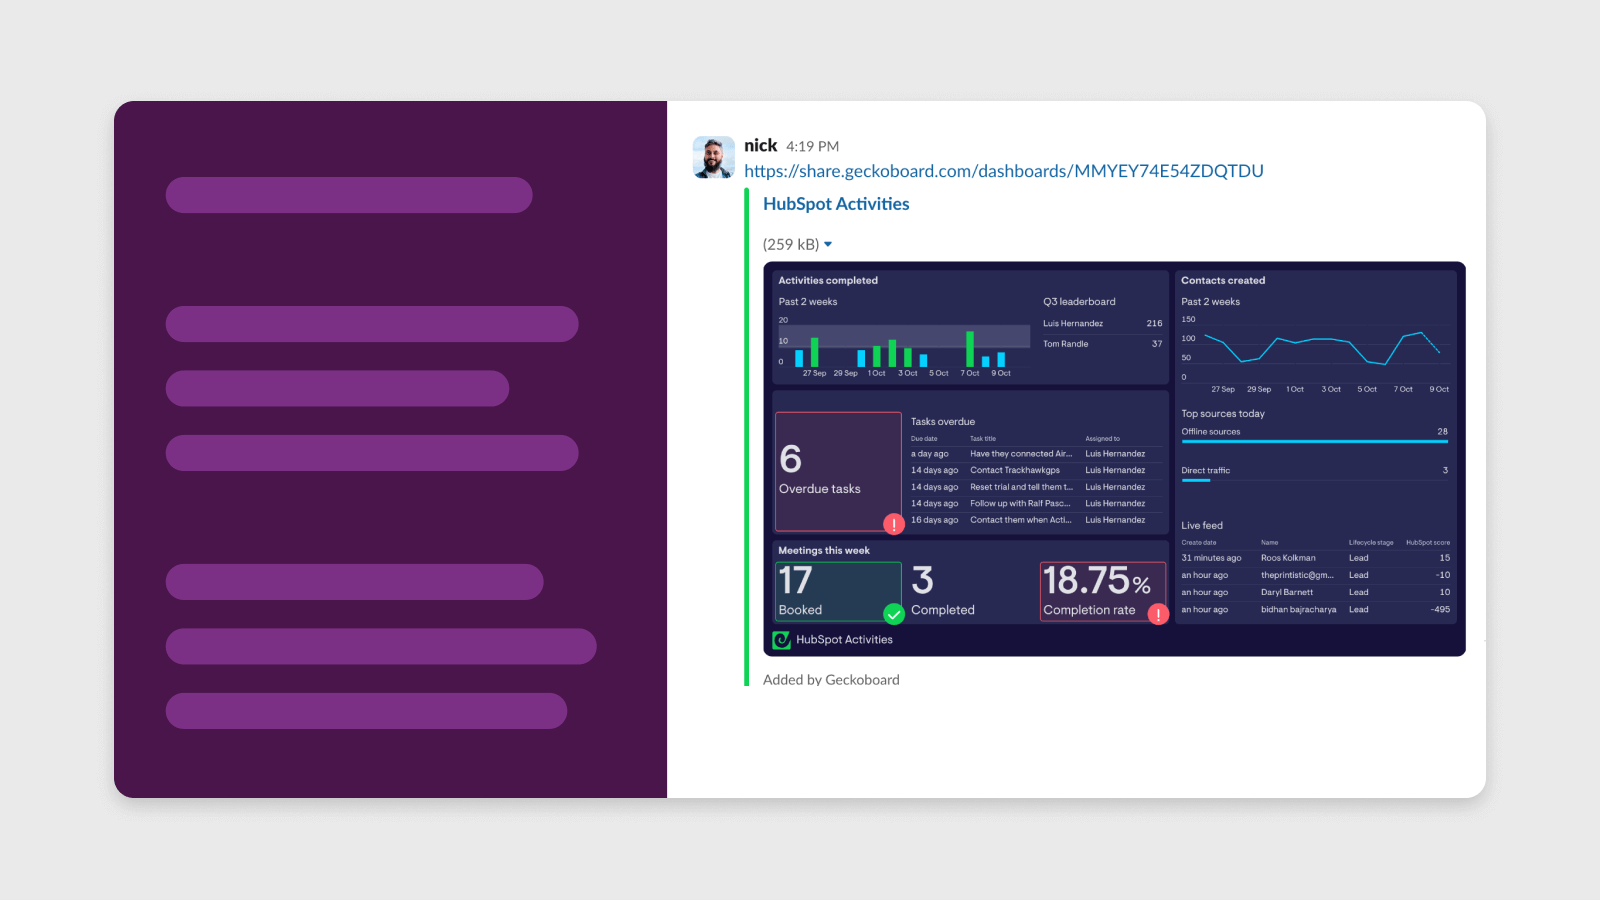
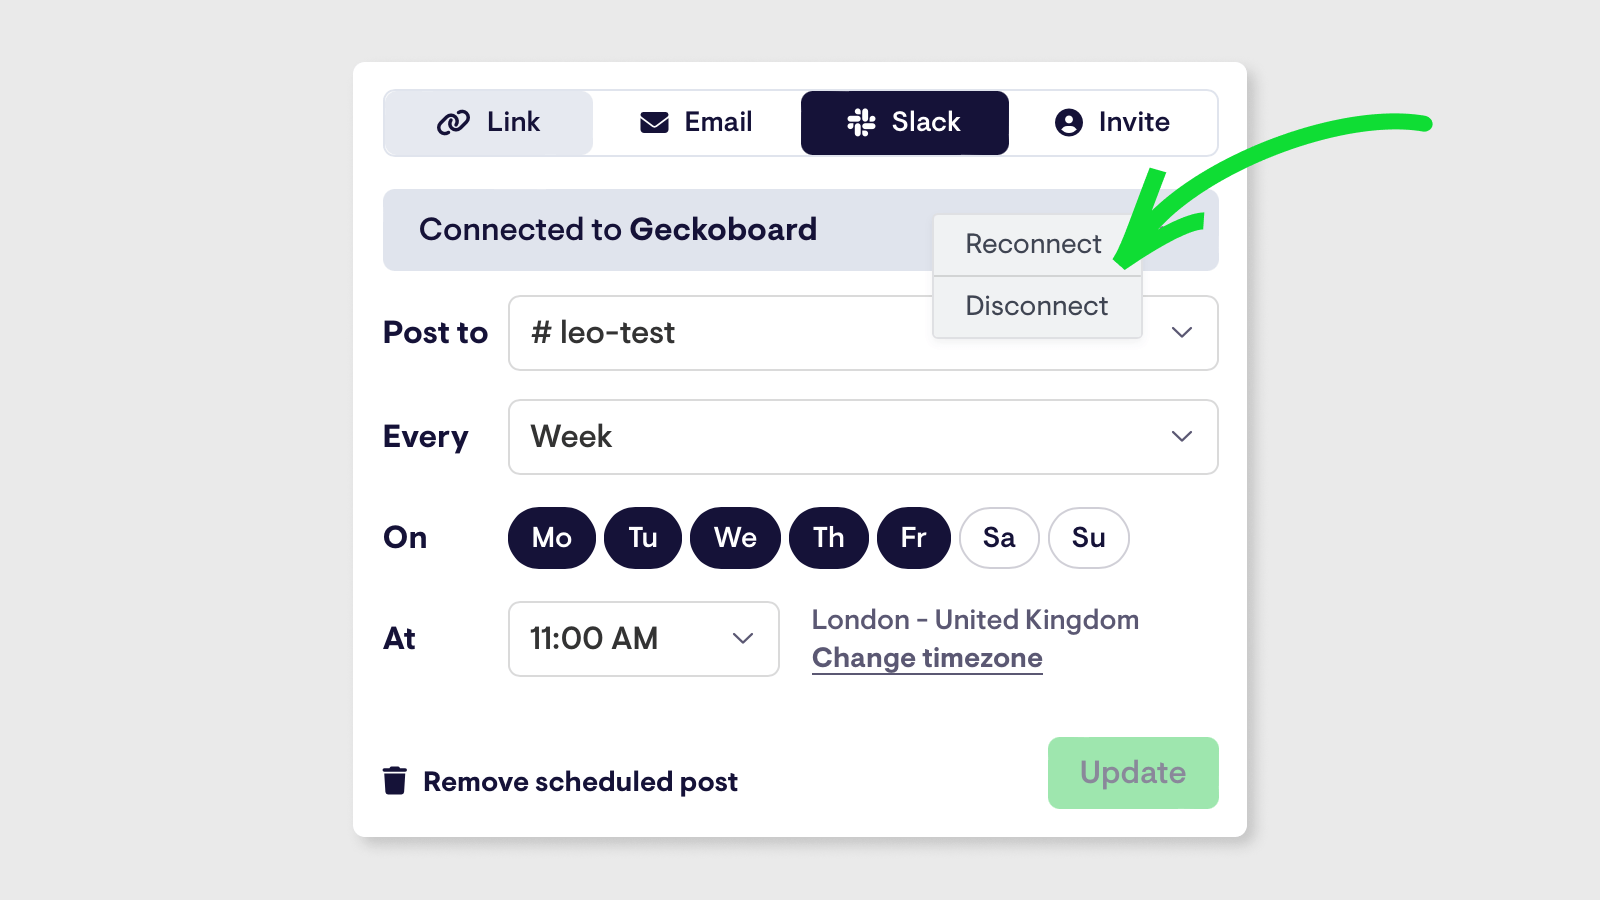
New Slack connections will benefit automatically from this update. If you’ve previously connected Slack to Geckoboard though, you’ll just need to update your connection by clicking reconnect in the Slack snapshot menu.
Database connections can now be edited
We’ve made it possible to update existing database connections on your account. If you’ve connected one of the database engines Geckoboard supports, you’ll find the connection listed at the bottom of the Connections panel, within the Admin section of your account.
From there, click Edit connection to update and save your settings.