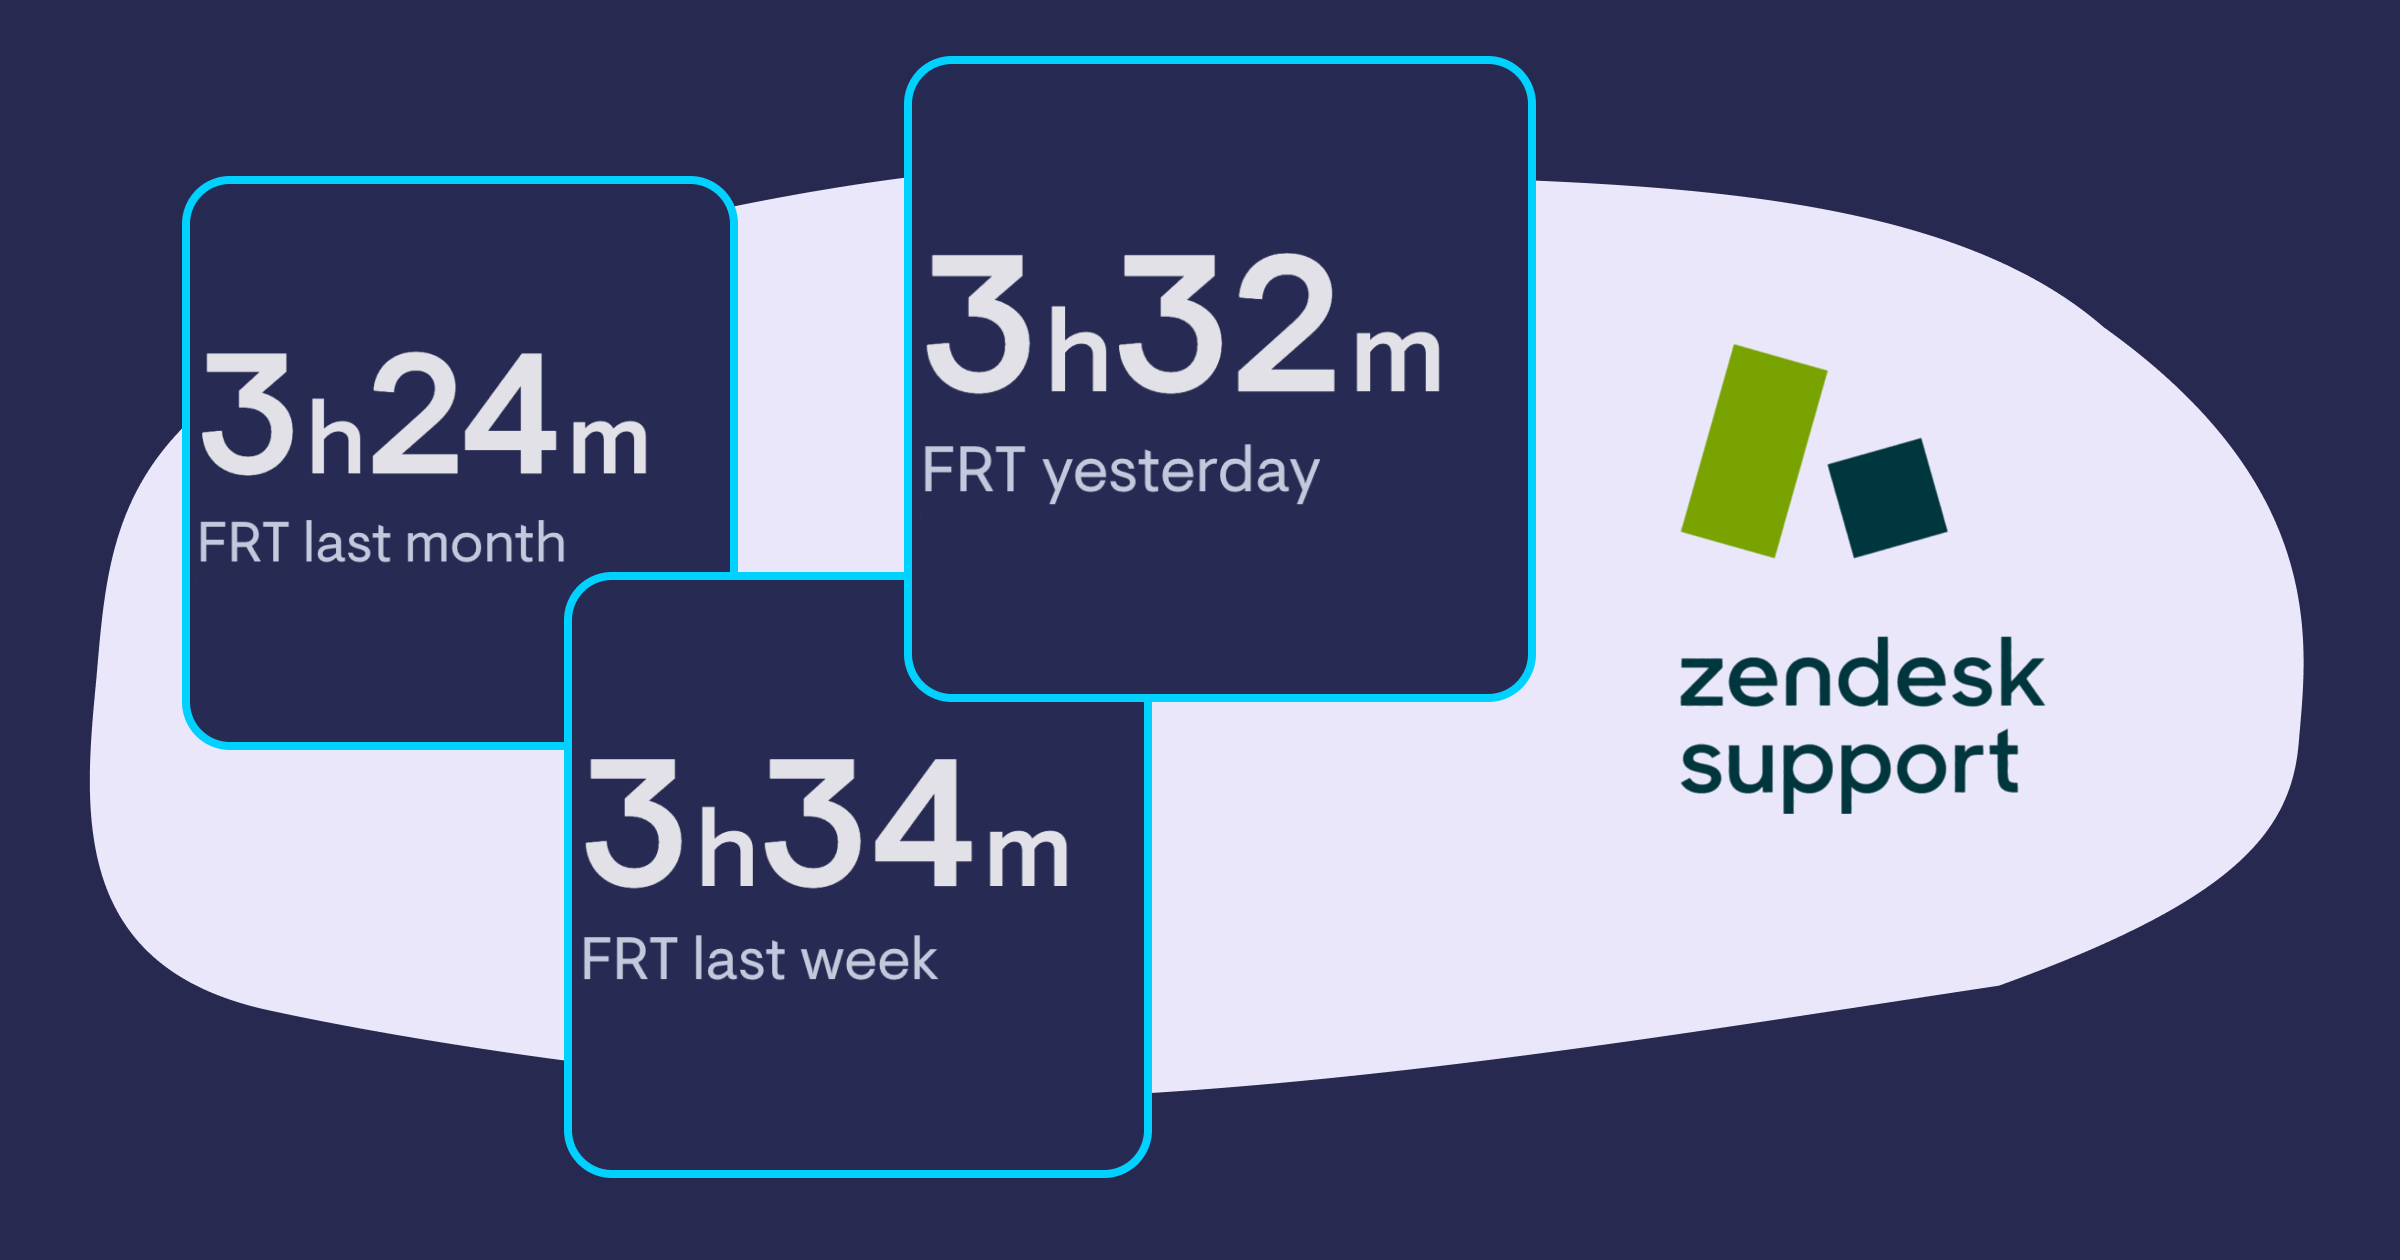
New time filters for Zendesk Support
We’ve added several new time filters to our Zendesk Support data source, giving you the option to show values for yesterday, last week and last month.
We’ve added several new time filters to our Zendesk Support data source, giving you the option to show values for yesterday, last week and last month.
Our Google Analytics data source now supports the following metrics:
Ad Unit Exposure: Measures the visibility or exposure of ad units.
Crash-affected Users: Indicates the number of users impacted by crashes or technical issues.
Crash-free Users Rate: Shows the percentage of users who did not experience crashes.
Event Count per User: Tracks the average number of events triggered by each user.
Gross Item Revenue: Represents the total revenue generated from item sales.
Gross Purchase Revenue: Reflects the total revenue generated from purchases.
Items Added to Cart: Counts the number of items added to the cart by users.
Items Checked Out: Tracks the number of items that users have completed the checkout process for.
Items Clicked in List: Measures the number of items clicked by users within a list.
Items Clicked in Promotion: Tracks the number of items clicked by users within a promotional context.
Items Viewed: Indicates the number of times items have been viewed by users.
Items Viewed in List: Measures the number of times items have been viewed within a list.
Items Viewed in Promotion: Tracks the number of times items have been viewed within a promotional context.
Organic Google Search Average Position: Shows the average position of a website in organic Google search results.
Organic Google Search Click-Through Rate: Reflects the percentage of users who clicked on a website link from organic Google search results.
Organic Google Search Clicks: Counts the number of clicks a website receives from organic Google search results.
Organic Google Search Impressions: Indicates the number of times a website link is displayed in organic Google search results.
Publisher Ad Clicks: Measures the number of clicks on ads displayed by publishers.
Publisher Ad Impressions: Indicates the number of times ads displayed by publishers are viewed.
Scrolled Users: Tracks the number of users who have scrolled through a page or content.
Shipping Amount: Represents the amount charged for shipping in transactions.
Tax Amount: Reflects the amount charged for taxes in transactions.
Total Ad Revenue: Represents the overall revenue generated from ads.
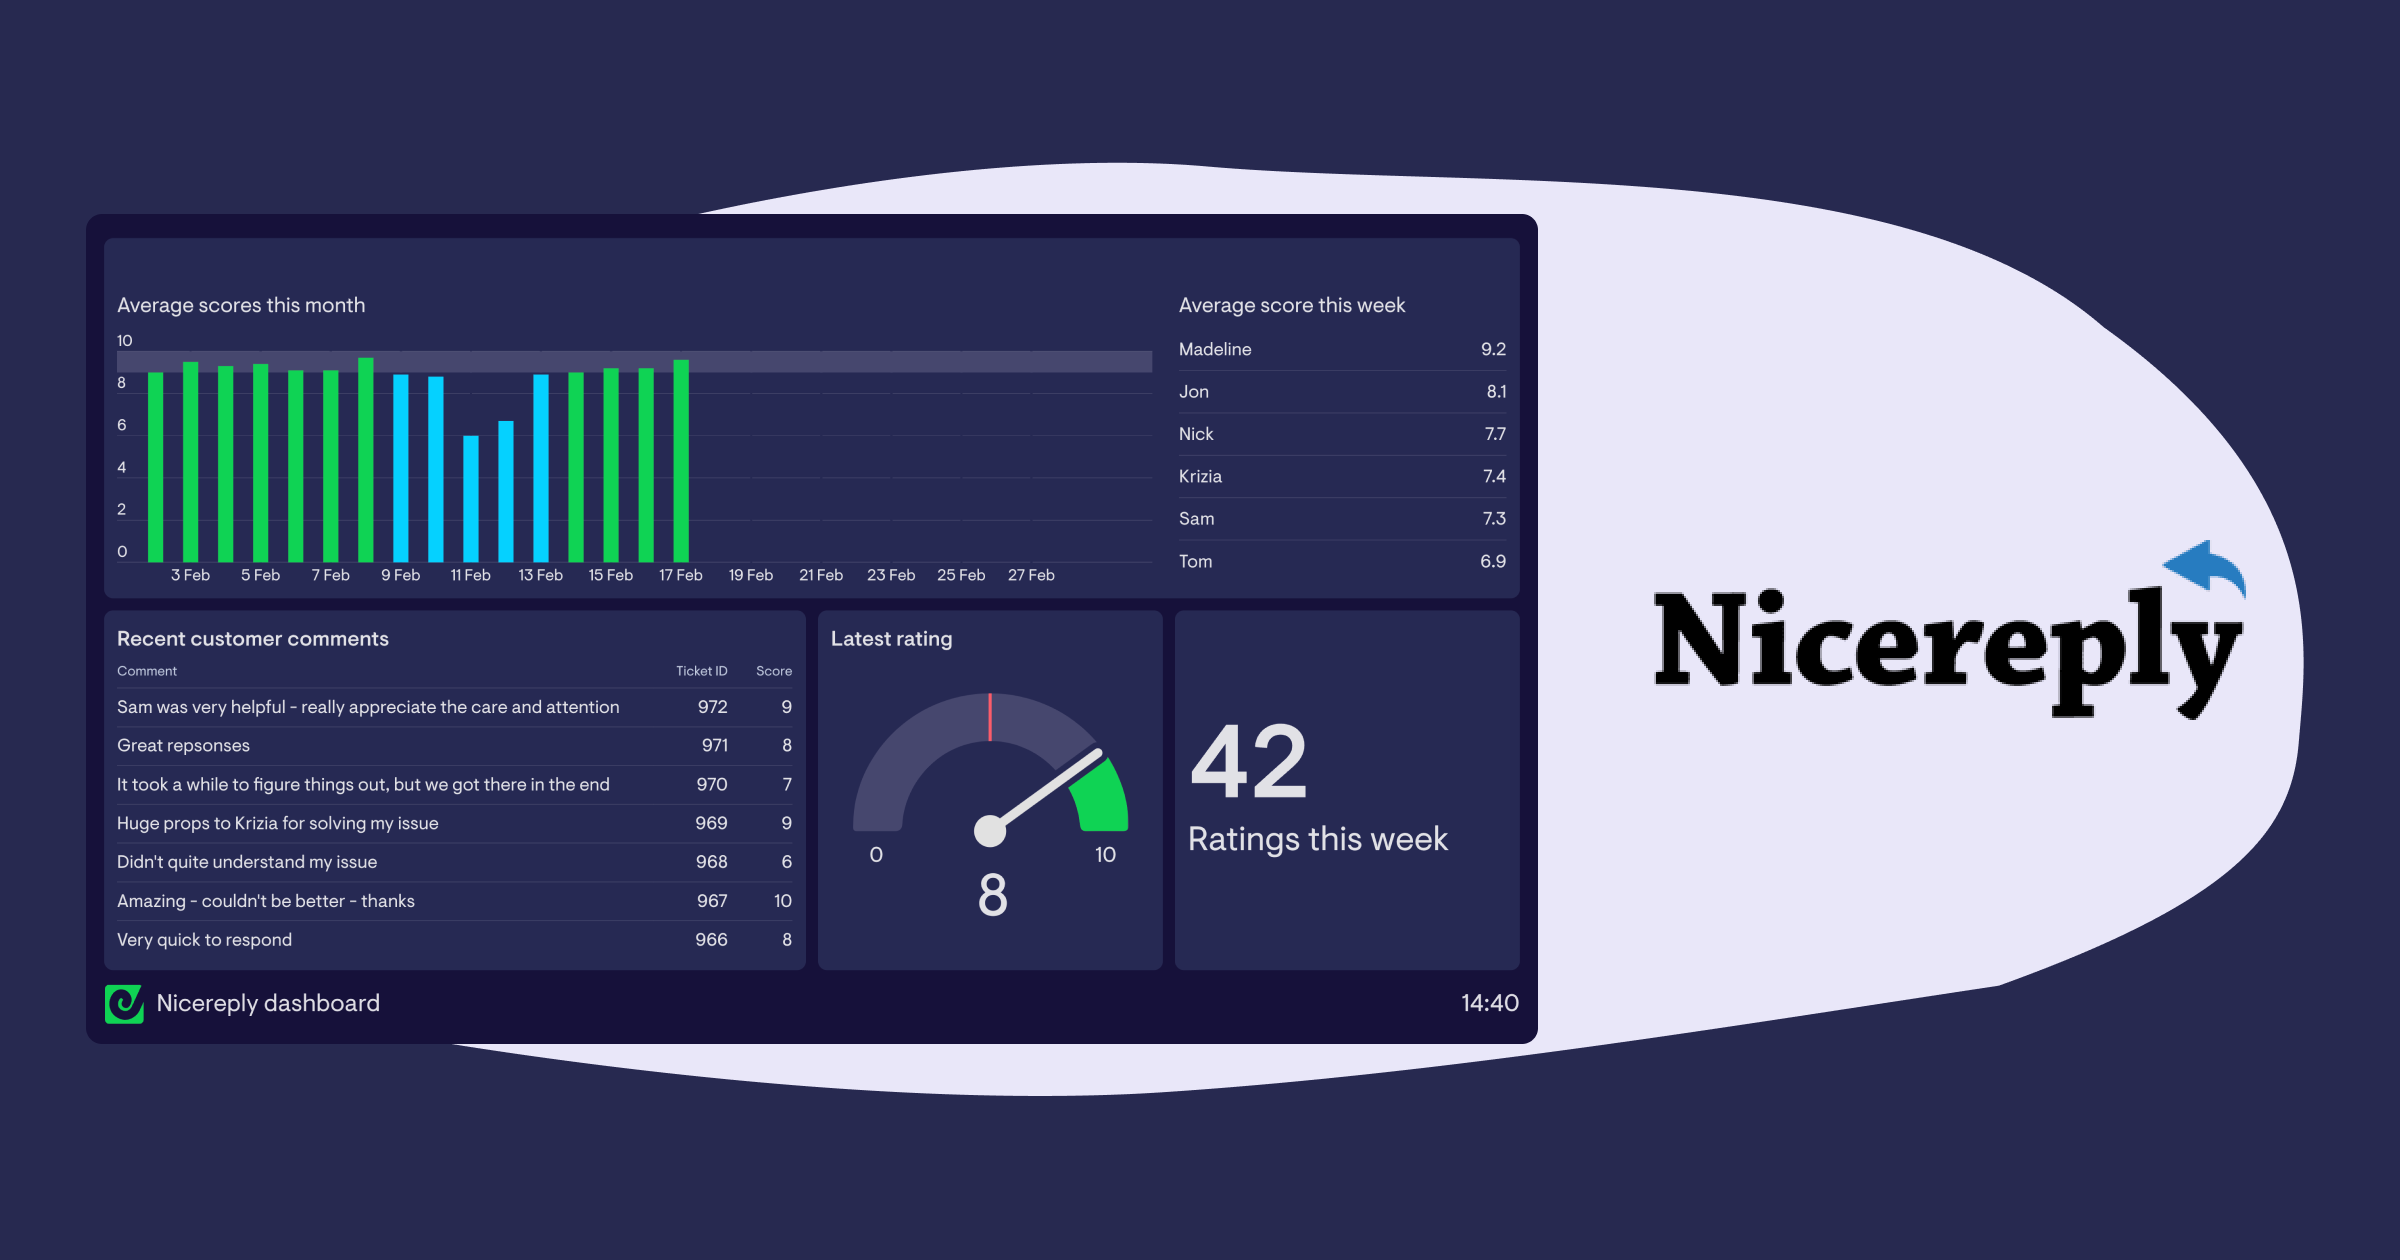
Nicereply has joined our selection of data sources 🎉 . Now you can keep track of your customer surveys with a live dashboard containing metrics like average scores over time for each of your surveys, your latest survey score and number of survey responses, as well as comments left by customers.
We’ve added Matomo to our selection of data sources 🎉! Our new integration helps you keep track of key metrics from across your Matomo Cloud account, including handy presets for things like visits by device type, top performing pages by hits, conversions by social site, and a whole lot more.
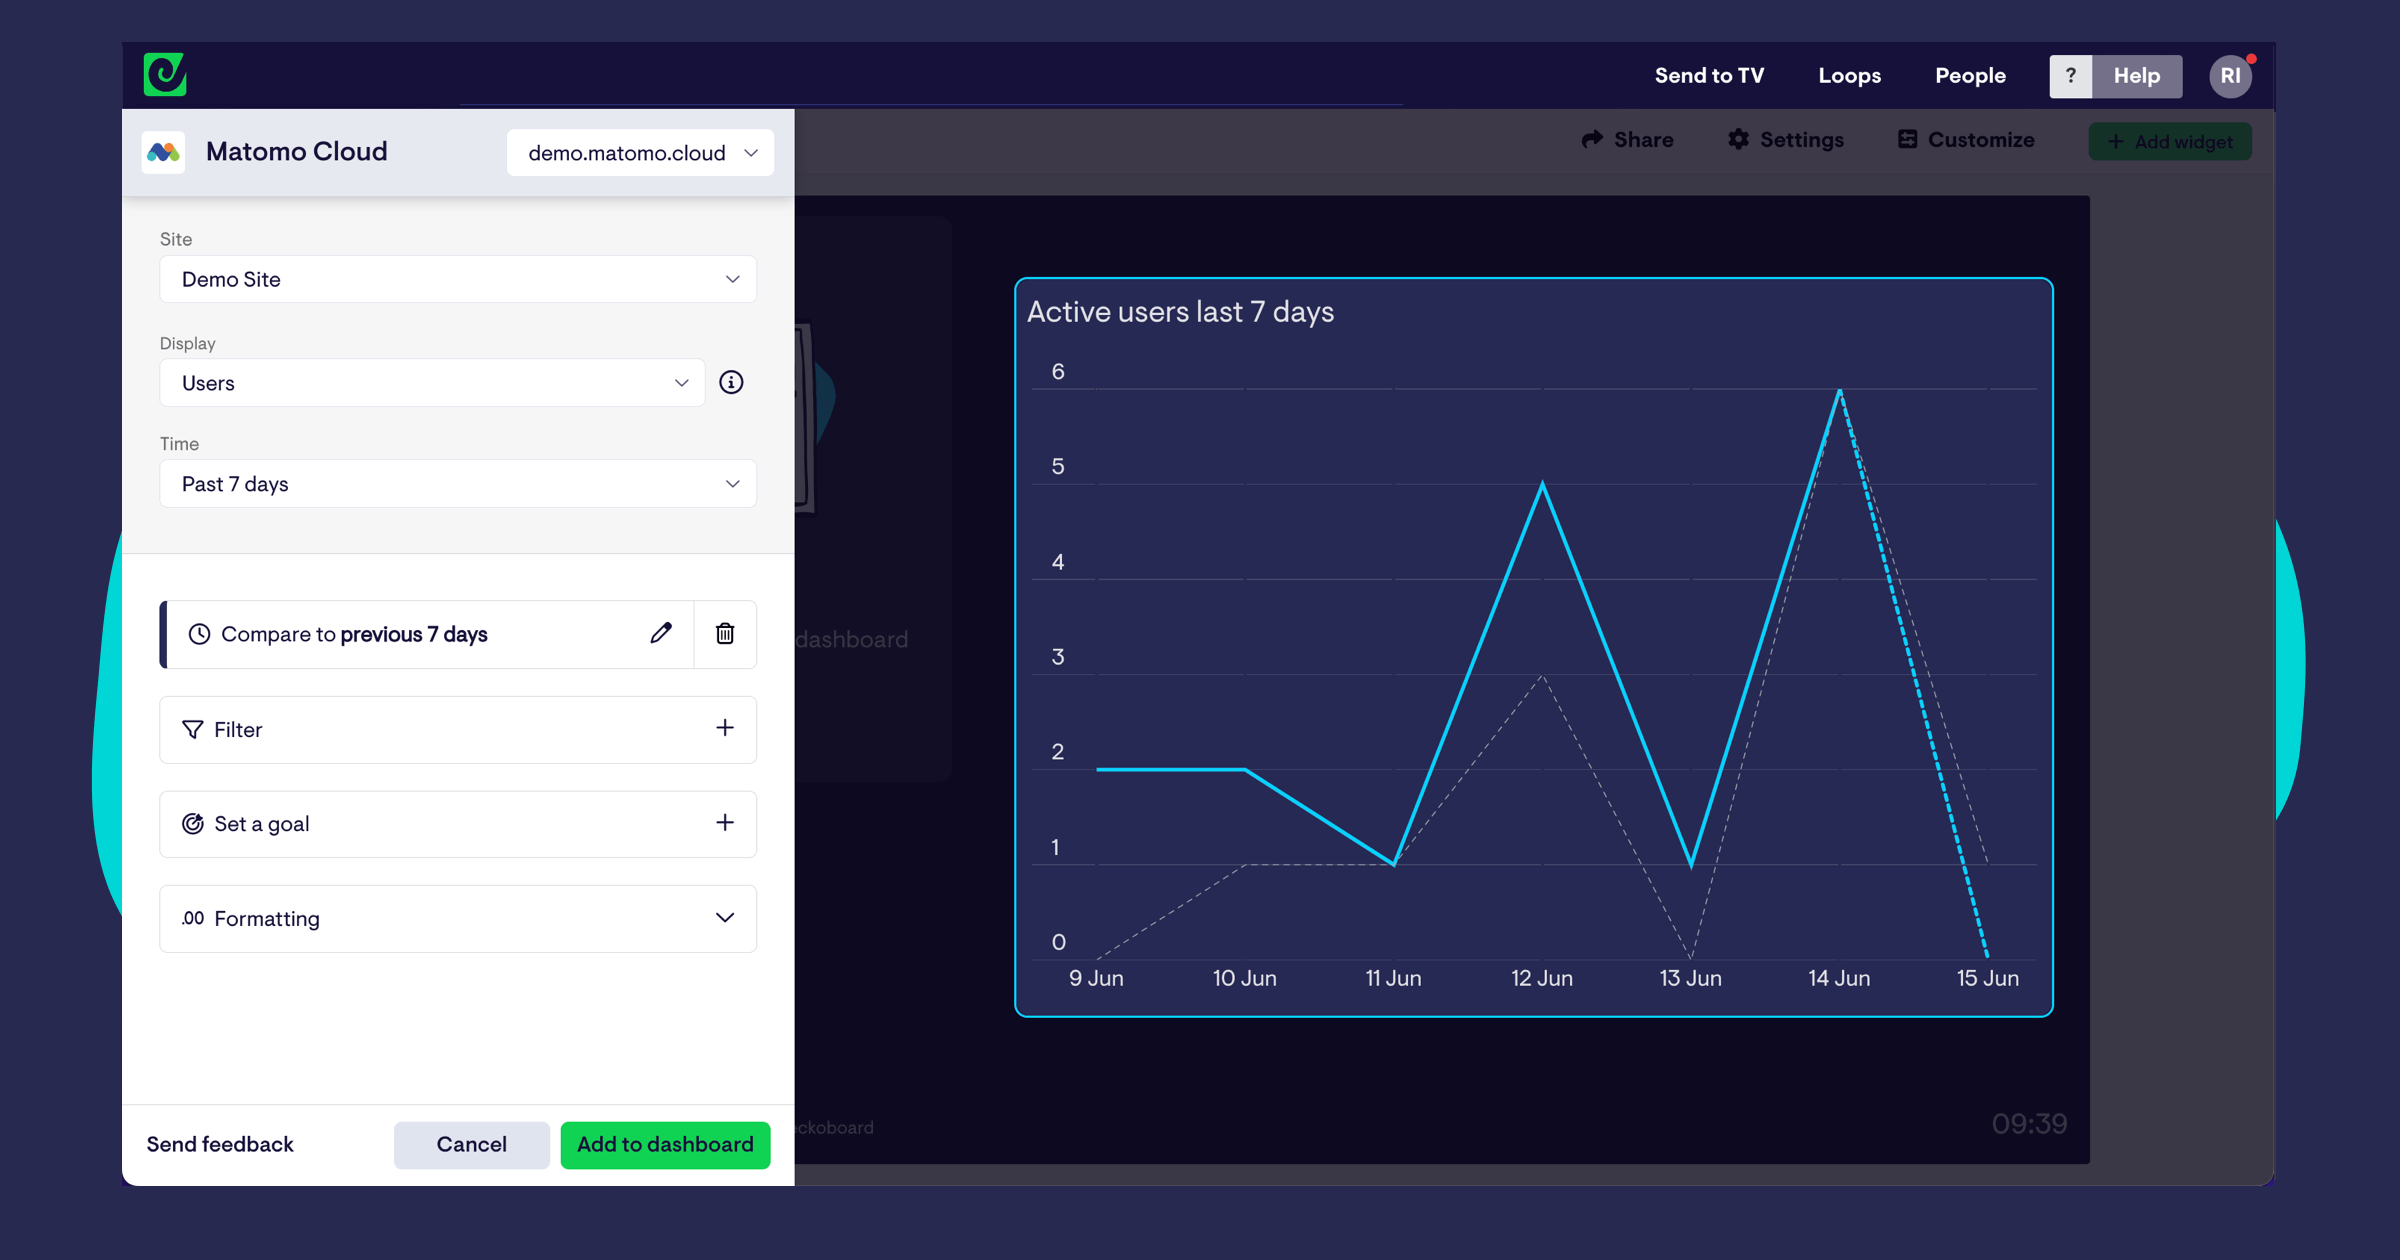
Log in to try it out!
Our Google Analytics 4 data source now includes a map visualization, allowing you to see where current visitors to your website are located at a national, regional or global level.
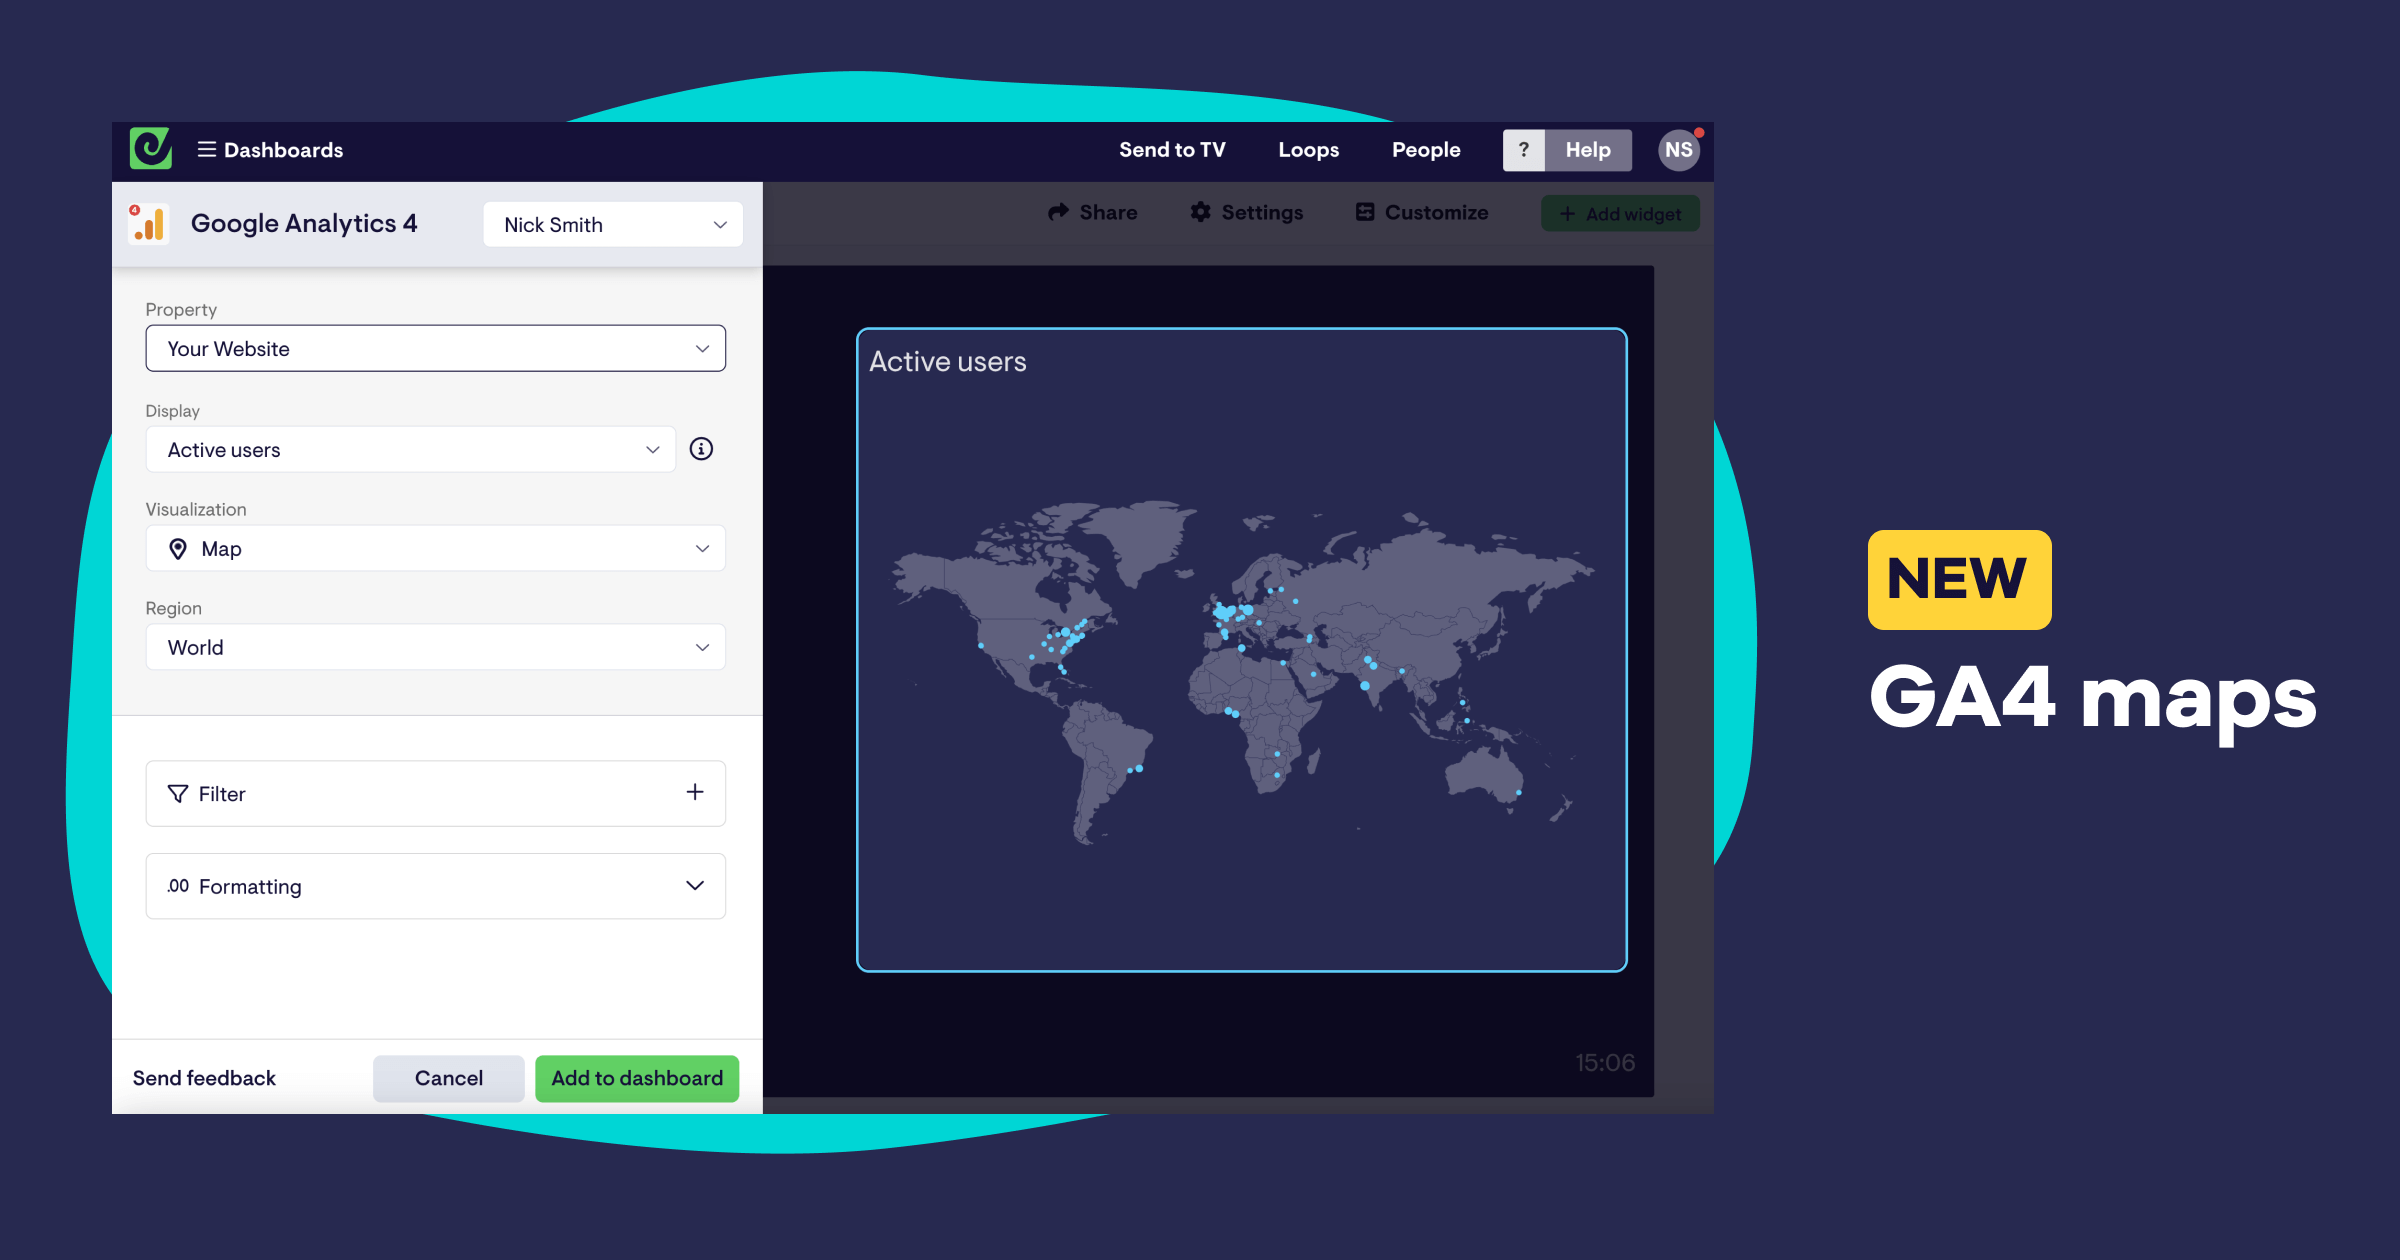
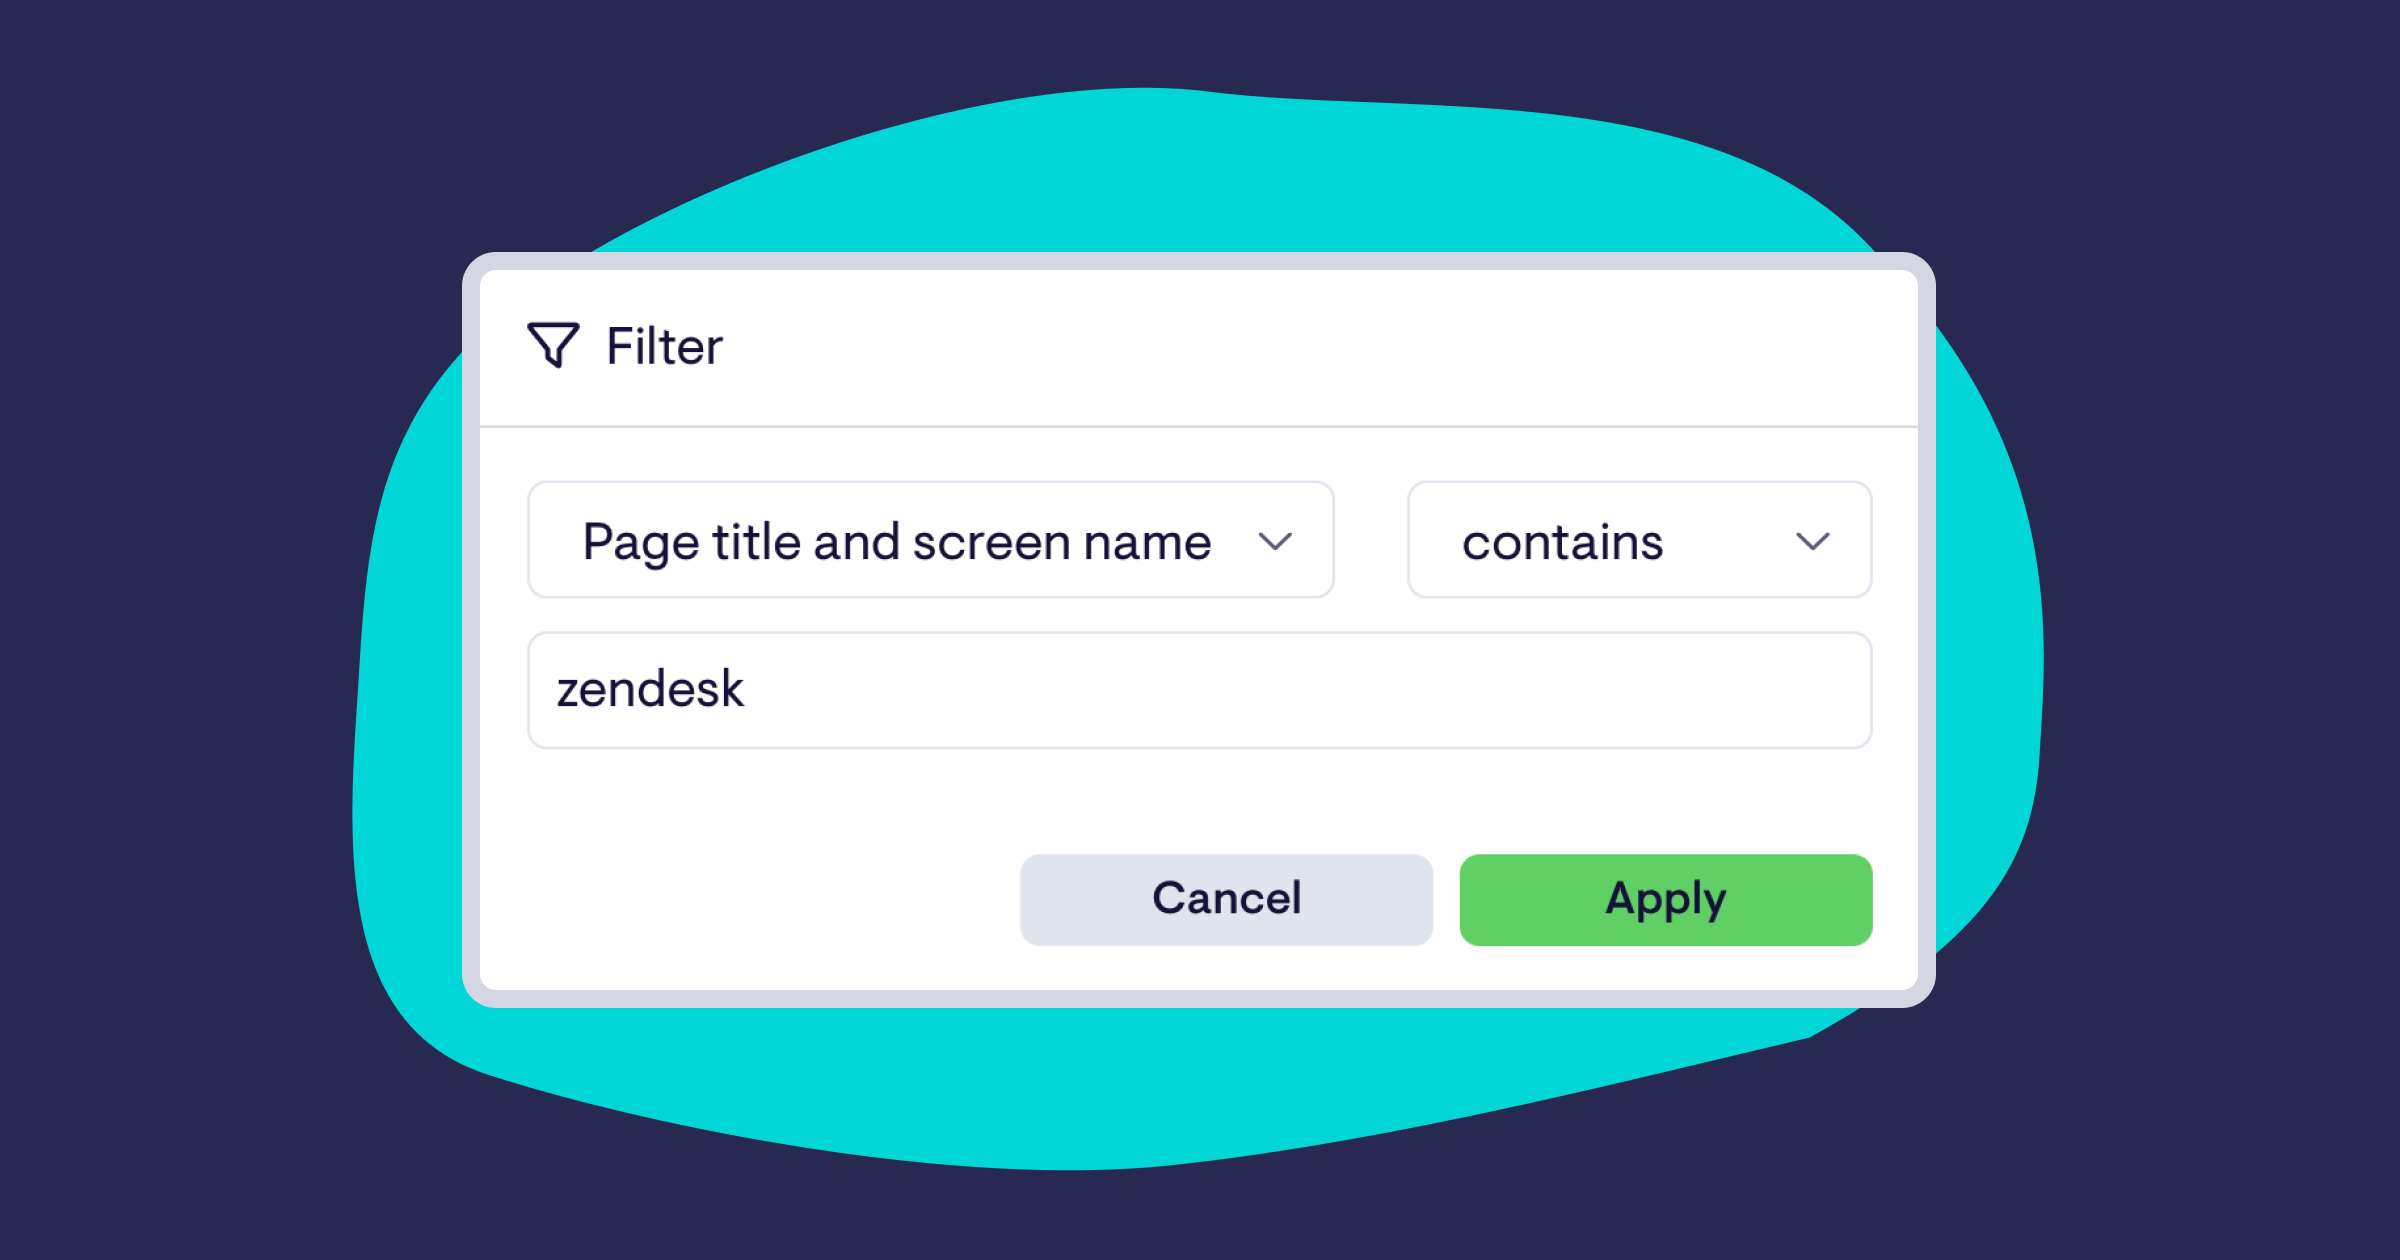
We’ve also added two highly-requested filters to most other GA4 metrics - “contains” and “does not contain” - making it easier to dial your GA4 widgets in to monitor the specific parts of your website you’re interested in.
REMINDER: On July 1st 2023, Google will no longer process data on Universal Google Analytics properties. If you haven’t already, we strongly recommend following Google’s instructions for updating tracking pin your website, and replacing Google analytics widgets on your Geckoboard dashboards with GA4 equivalents. For more information and useful links, read our help article.
We’ve updated our Salesforce data source to include support for median and unique aggregations and Field-to-field filtering from your reports.
We’ve shipped a major update to our YouTube data source, adding 16 new metrics that include card clicks and card click-through-rate, annotation clicks, number of YouTube Red views, and number times your videos have been added to or removed from playlists. More filters have been added too, allowing you to filter shares by subscribe status, and break metrics down by continent and sub-continent.
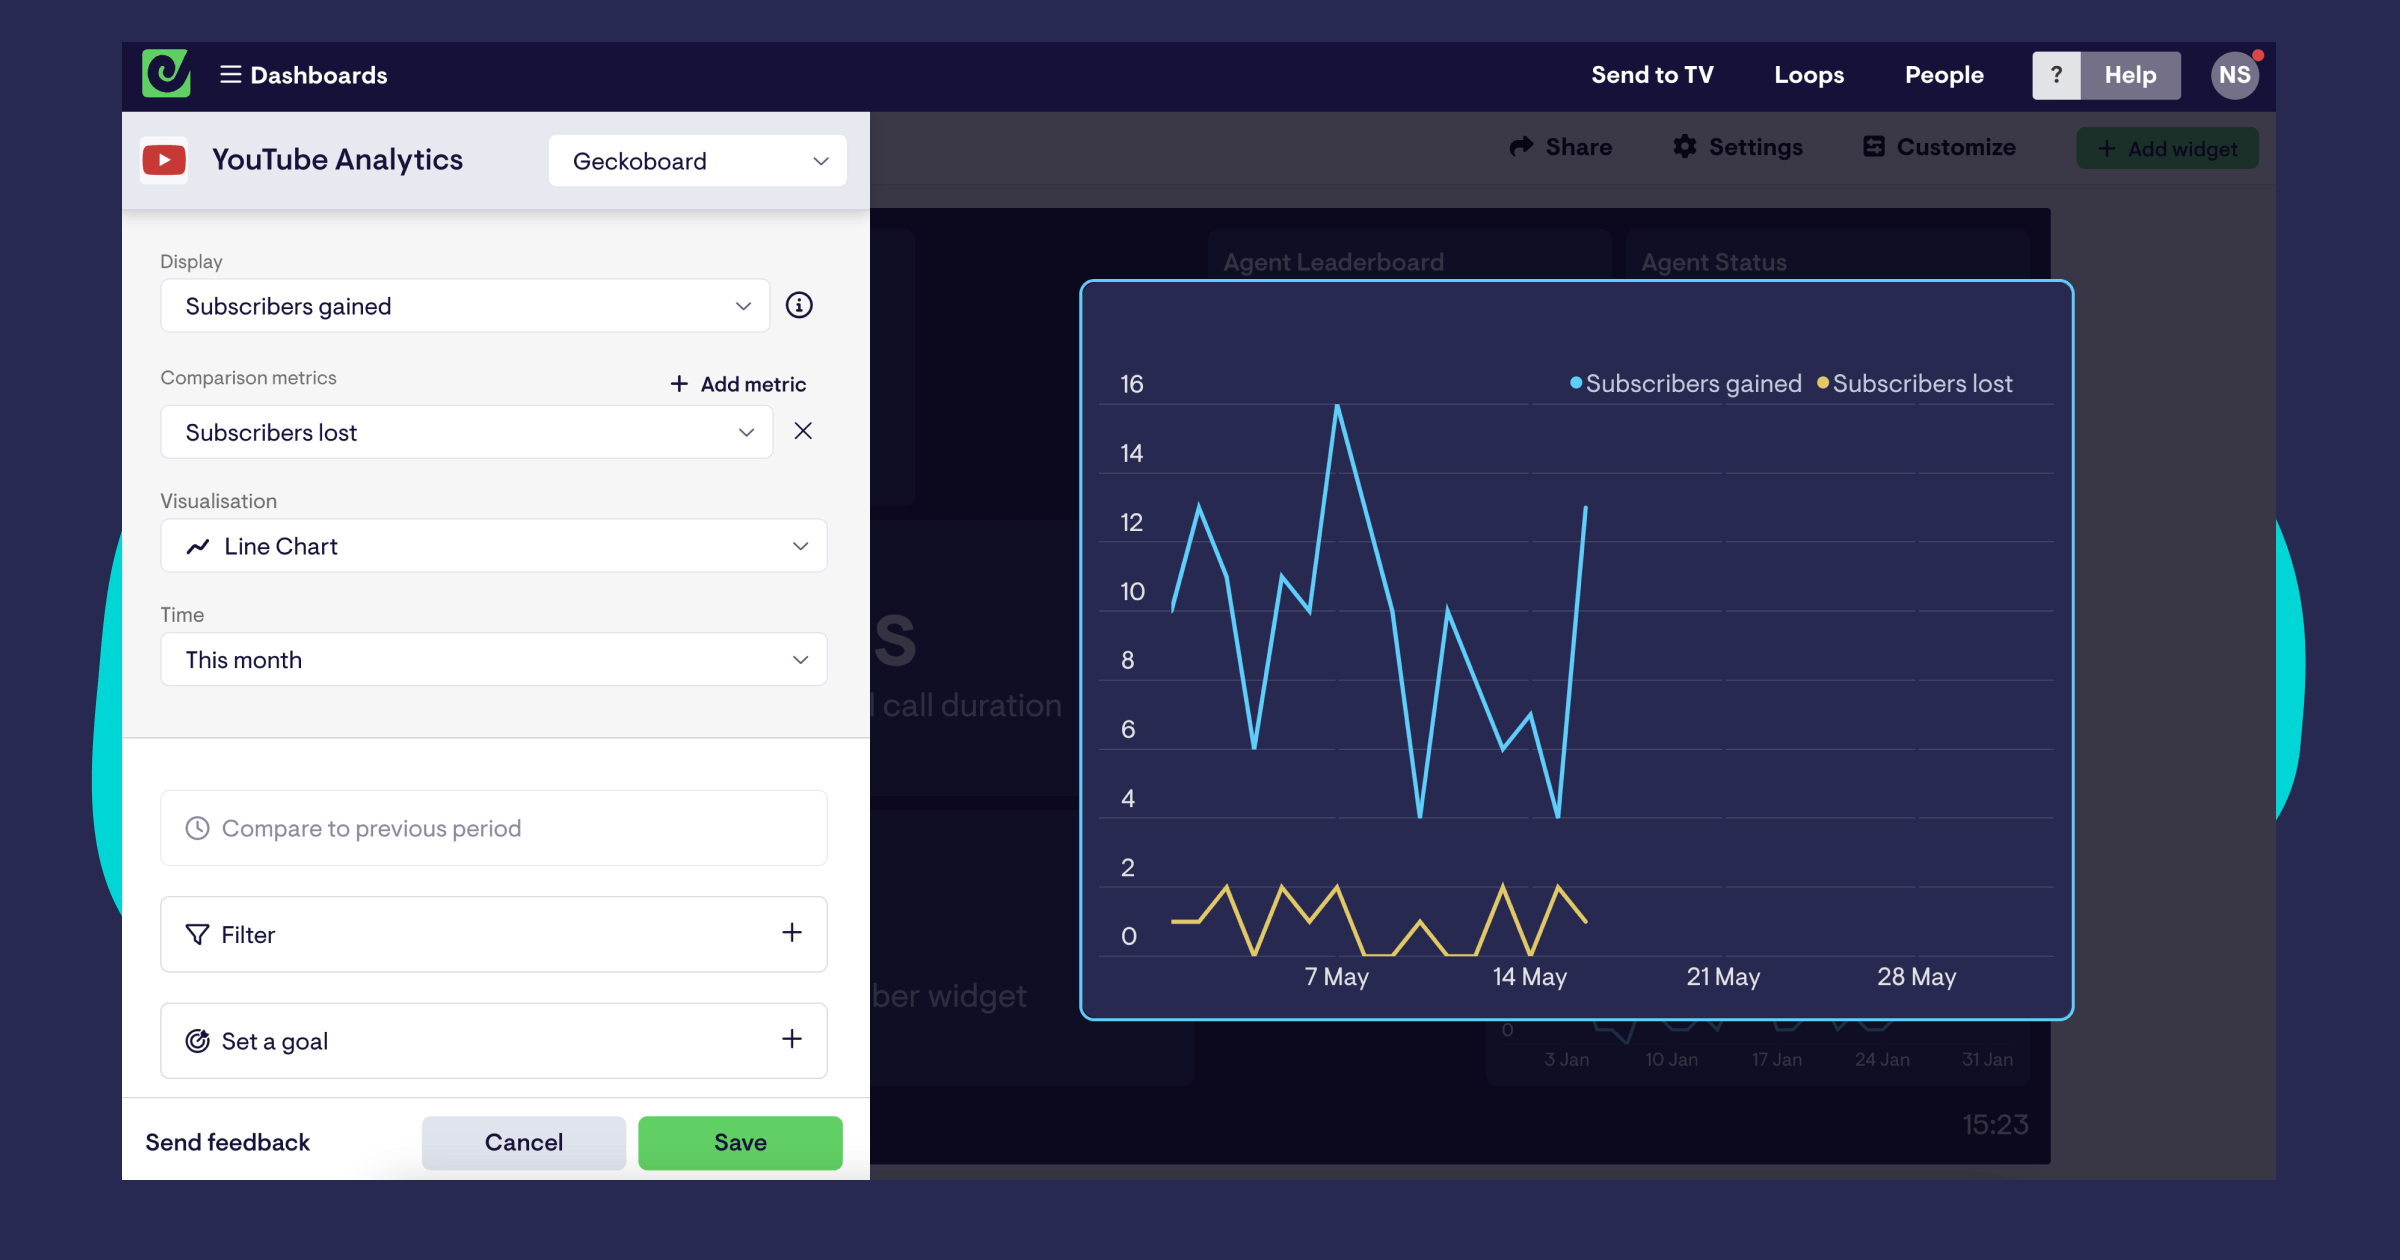
Finally, YouTube now includes our recently added Interactive View, allowing you to quickly dig into specific metrics and uncover more detail, without having to jump into YouTube or other tools.
Investigate interesting changes to your metrics in Geckoboard, without jumping into more complicated tools, with our new Interactive View (currently in beta).
NB: This beta is currently available on Zendesk Support, Intercom, Facebook Ads, Google Analytics 4, Google Search Console, Shopify and Stripe widgets.
–
Sometimes seeing a number change on your dashboard can make you want to dig a bit deeper to understand what’s going on. Spikes in support tickets… drops in website traffic… unexpected changes in ad spend… a quick diagnosis of what’s going on can make all the difference.
Unfortunately, investigating further often means opening up much more complicated tools that make surfacing the data you need tricky (or in some cases, impossible). So we’re excited to announce the beta of Interactive View - a new way to quickly unpack metrics, right within Geckoboard.

Want to dig into a specific metric? Hover over your widget and click the 🔍 magnifying glass icon to open up a new space to investigate your data in, without affecting your dashboards.
Break down metrics by different properties: Depending on the metric, choose from a selection of properties and dimensions that can provide extra context.
Explore different time periods: Easily switch between time periods to see how your metric compares with recent performance.
View source data (Zendesk Support only): Easily see, and navigate to, the original source of data that makes up your widget (in Zendesk’s case, tickets).
Download source data as a CSV (Zendesk Support only): Export source data for further analysis or reporting in a click.
Read more about how you can use Interactive View day-to-day in our blog post, 5 examples of Geckoboard’s Interactive View in action
Interactive View is in Beta - hit the Feedback button at the top of the screen with it open to share your feedback!
We’ve added the ability to set up more than one connection to the following data sources:
With several connections set up, you can easily pull metrics from across different accounts and bring them together on your dashboard (for example from several TikTok accounts you manage, or different projects in monday.com).
You can now adjust the width of individual columns on table visualizations 🎉. This seemingly small change gives you a whole lot more control over how data is presented in tabular form on your Geckoboard dashboards, helping you to avoid important information getting cut off, and making the best use of the space available on your dashboard.
Try it out the next time you log in by clicking a table on your dashboard and dragging the separator between two columns; your adjustments will carry through to any sharing links or dashboards up on TVs within a few minutes.