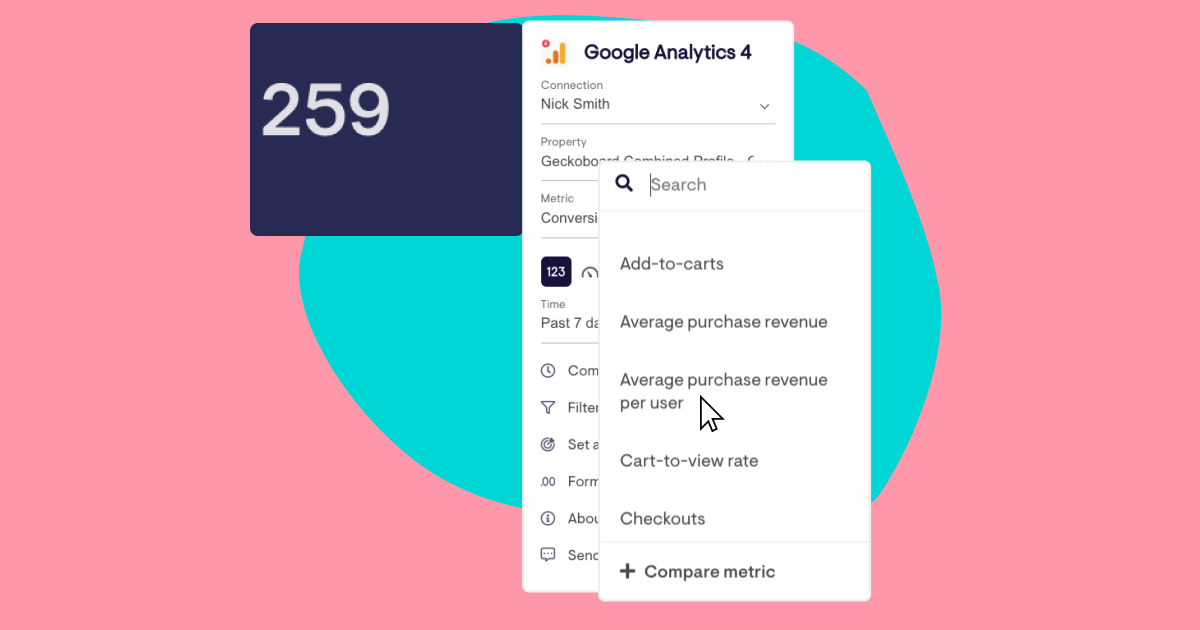
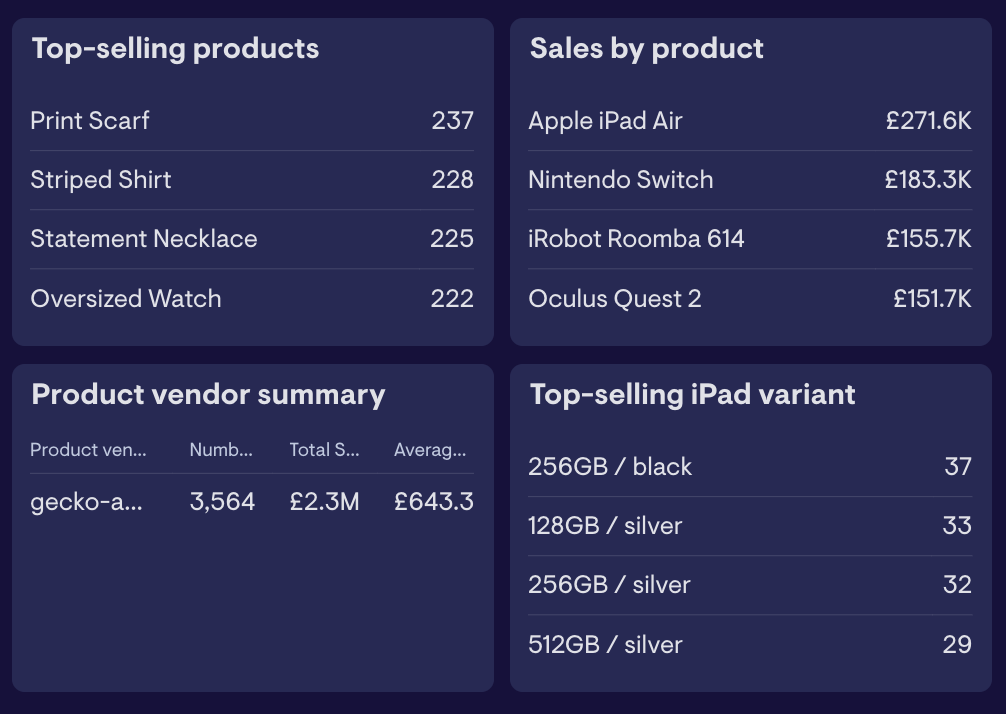
Our Google Analytics 4 data source now supports the full range of ecommerce metrics available in GA4, making it possible to show sales volume, most popular items, checkouts, promotion performance and more on your dashboards 🎉
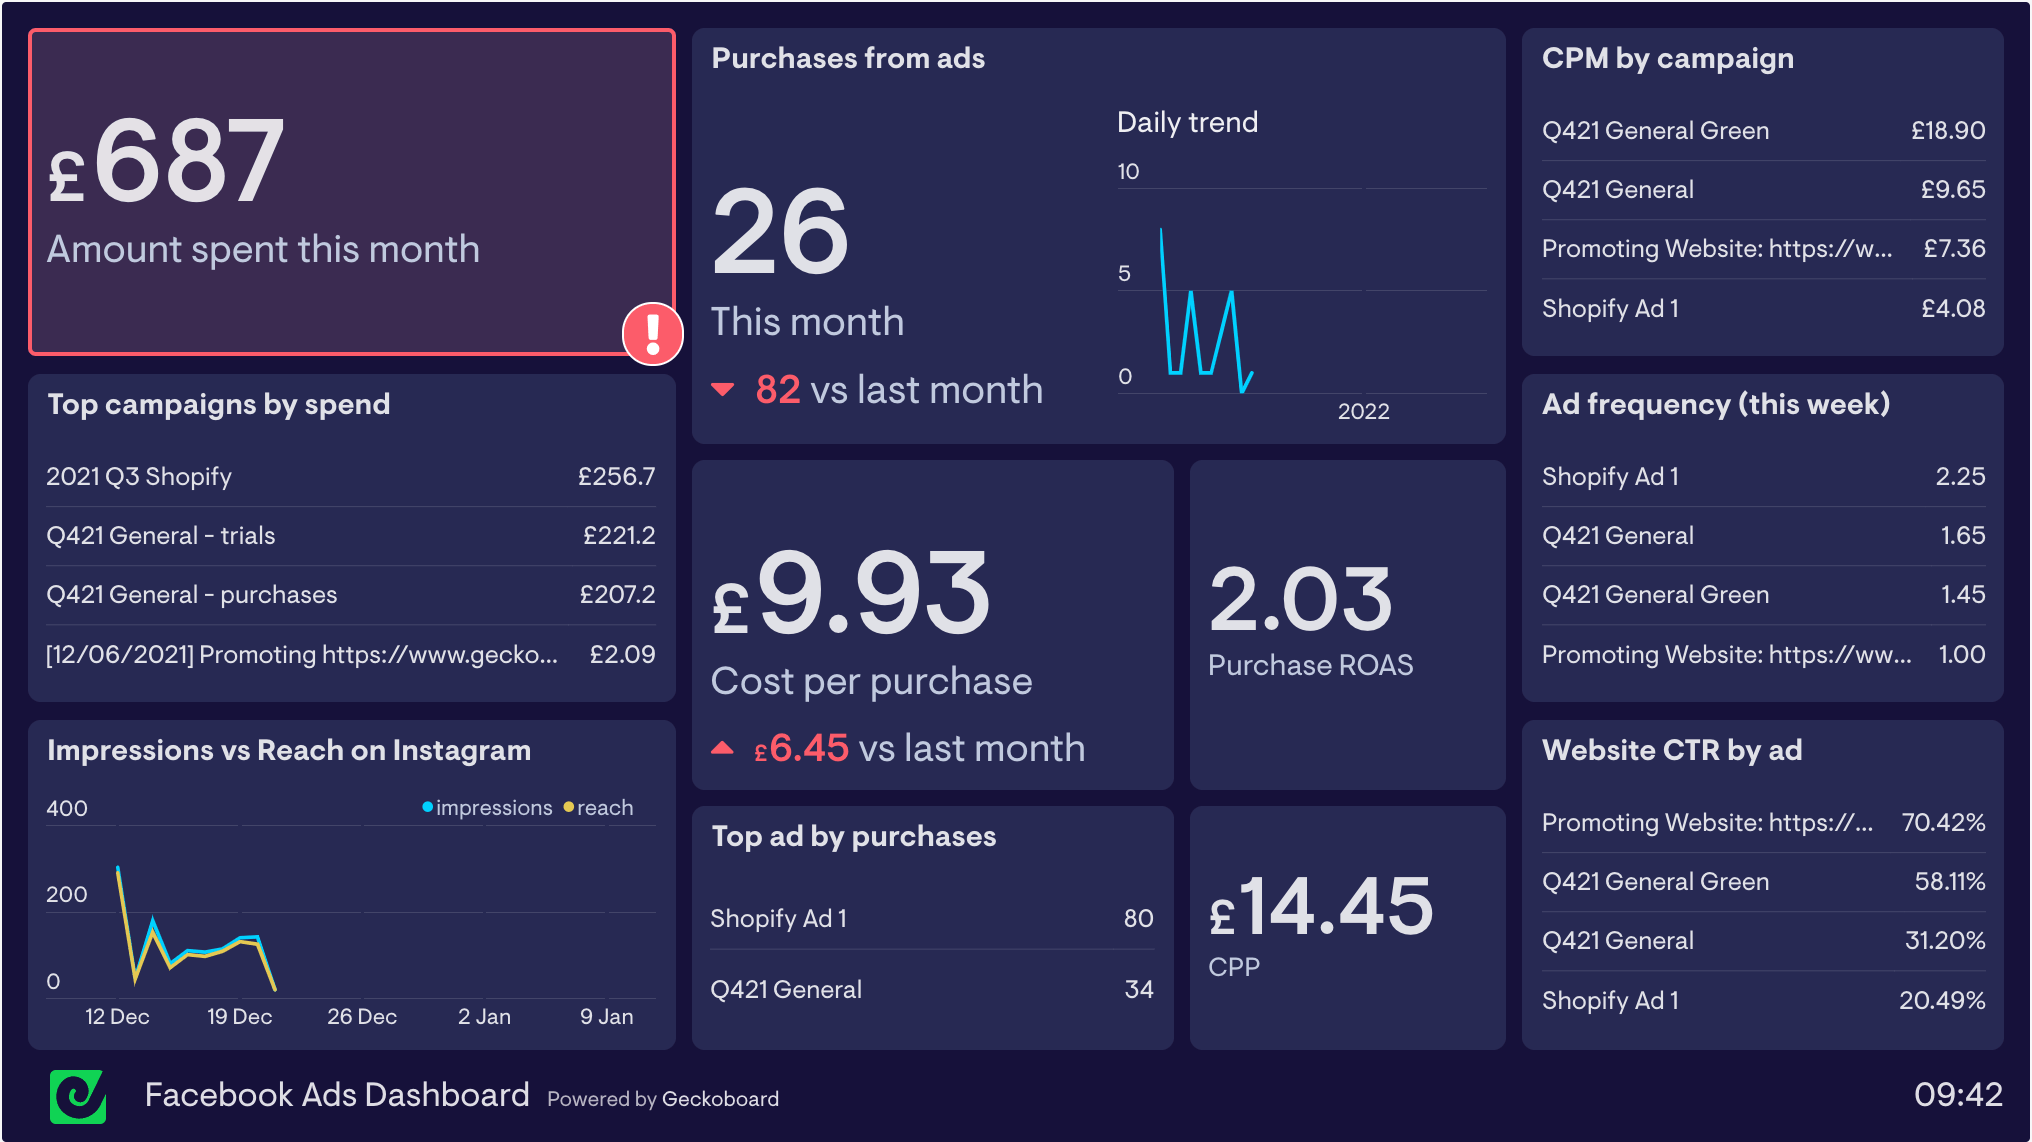
ICYMI: we recently shipped a beta version of a new Facebook Ads data source that includes a broader range of metrics, improved filtering options, and grouping functionality, enabling Facebook advertisers to build much richer dashboards with Geckoboard.
You can try the new integration by logging in to Geckoboard and selecting it from our list of data sources. In it you’ll find:
All the metrics you’re used to from our older Facebook Ads integrations, plus all-new ROAS metrics and more metrics tracking actions, such as app installs or video views
Metrics related to three of Facebook’s standard conversion types (Purchases, Leads and Completed Registrations) - more conversion types are coming soon.
Filtering by multiple campaigns, ad sets or ads on one widget (rather than creating separate widgets for each)
Grouping by campaign, ad set or ad, making it easier to compare performance between them on one widget
Engagement metrics (previously known as “Campaign results”)
For this release, custom conversions are not currently supported, but will be added soon; if you rely on these, our ‘Legacy’ integration will continue to support these for now.
Please let us know if you have any feedback whatsoever - just drop us a line by clicking ‘Help’ whilst logged in, or email support@geckoboard.com.
We’re kicking off 2022 by adding a whole bunch of brand new data sources 🎉
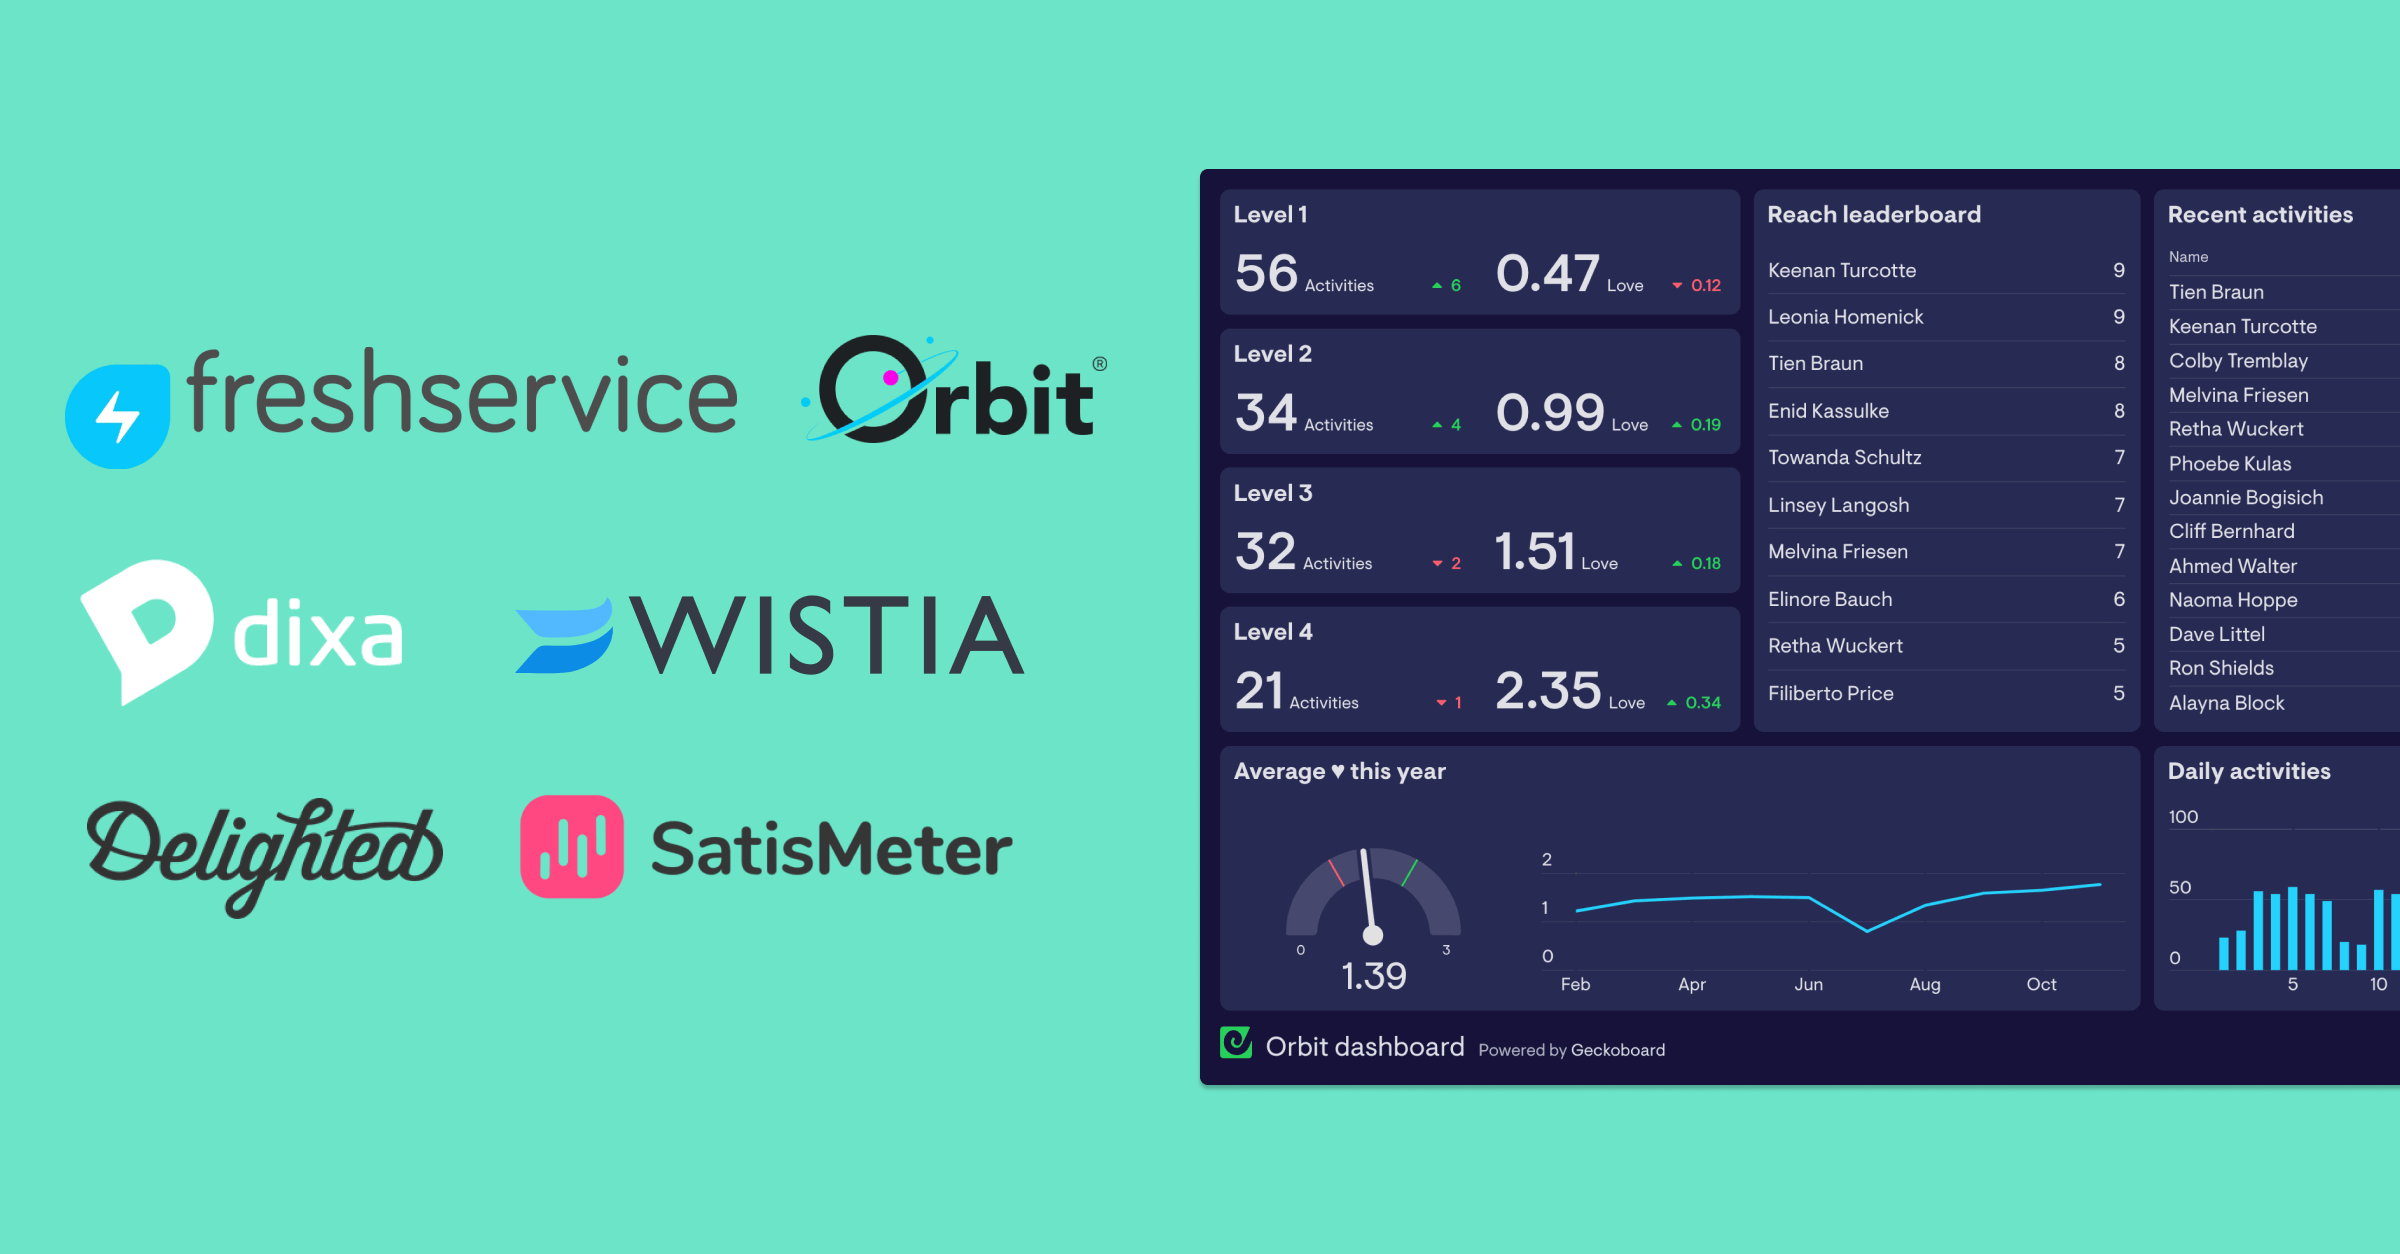
Wistia: track the performance of different videos on your Wistia account, with metrics like total view count, unique views, play time and engagement.
Freshservice: Track ticket volume, time to respond, time to resolve, time to close, as well as surfacing a feed of tickets, filterable by priority, status, type, requester, deal ID and more.
Dixa: See how many agents are online, and see a list of all agents by their current connection status or presence.
Orbit: Monitor the results of your community-building effort by surfacing metrics like number of activities performed by members of different orbit levels, reach, love, and more. (Update July 2024: Orbit have shut down their API, and this integration is no longer functional.)
We’ve also shipped a new Delighted data source, replacing our previous version, which provides a more streamlined widget-building experience for showing metrics like NPS, number of survey responses, promoters, passives and detractors, as well as a feed of survey results as they come in.
We’ve added Klaus to our selection of data sources 🎉. Our new integration helps you keep track of conversation quality by letting you visualize review scores, which can be broken down by in a number of ways. For example:
Track the average score across the whole team this month
For a particular reviewee, see the highest (or lowest) score achieved today
See all reviews this week from a particular reviewer
Let us know if there’s anything else you’d like to see supported!
If your customer support team uses Gorgias, you’re in luck! We’ve just shipped a new Gorgias integration, that supports a range of metrics including:
New tickets
Closed tickets
One touch tickets
First response time
First resolution time
Log in to give it a spin, and if you have a suggestion for metrics or data sources you’d like to see in Geckoboard, you can let us know using this form any time.
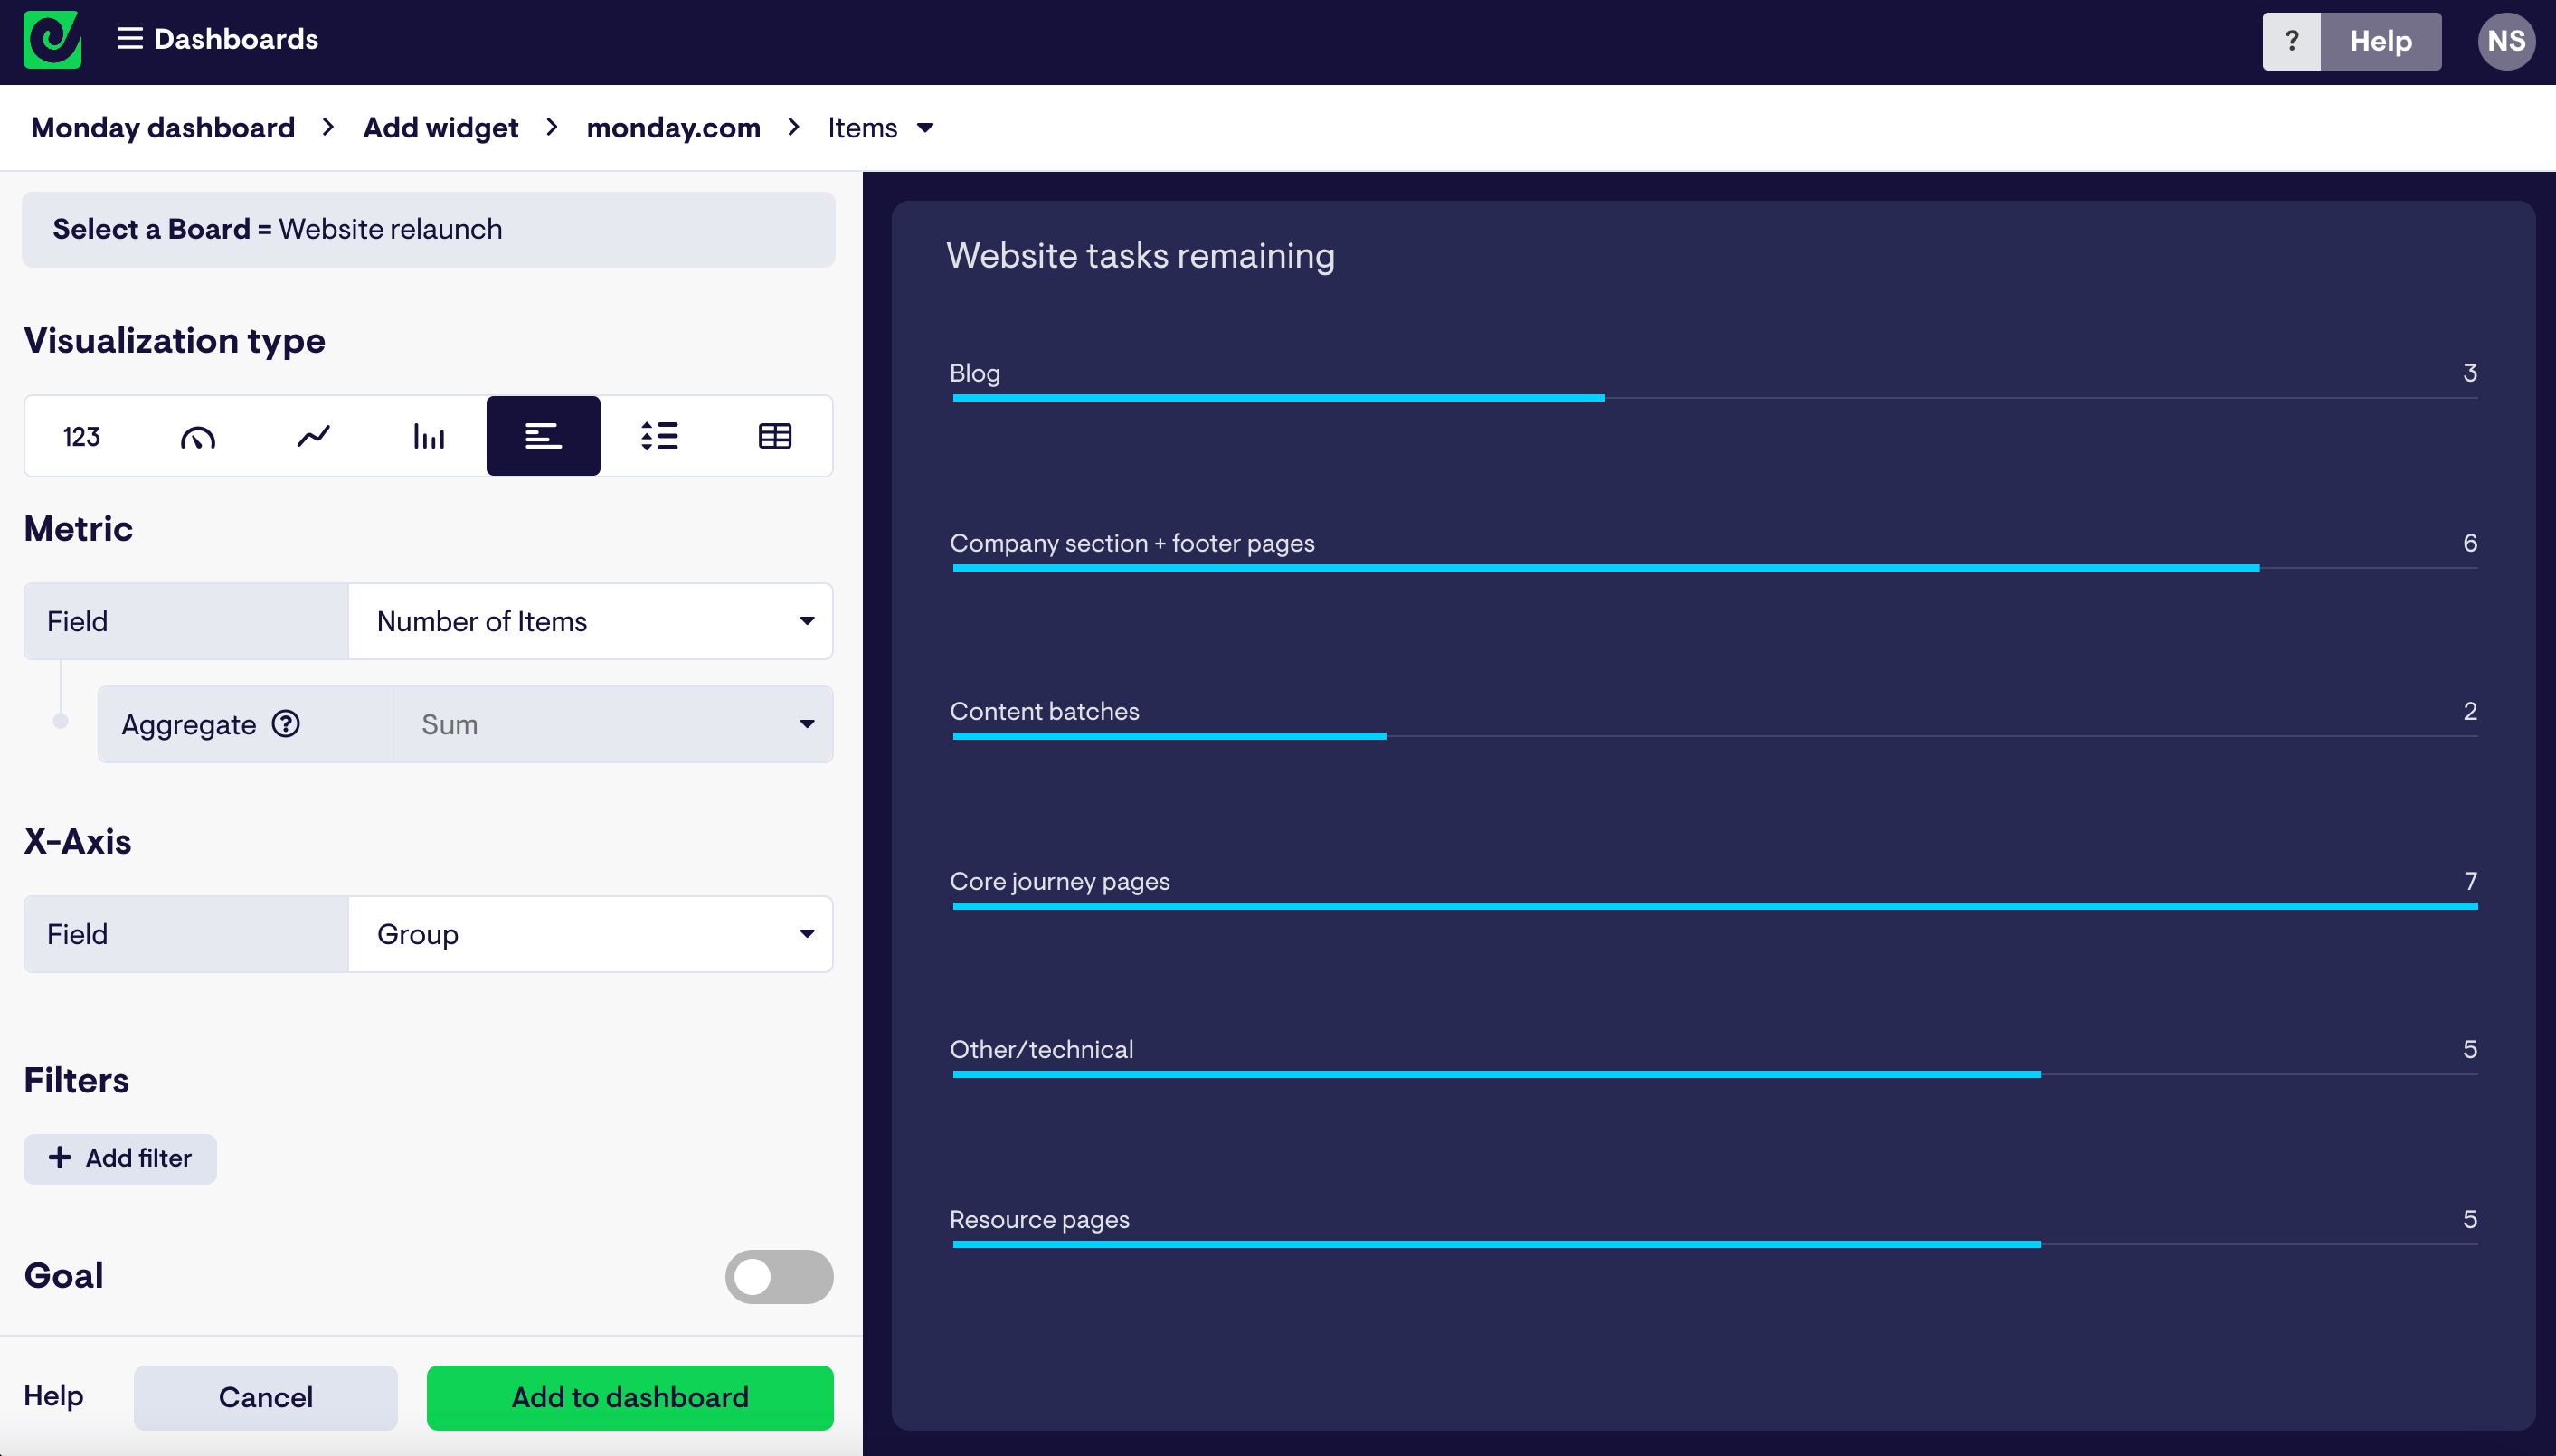
We’ve shipped a new monday.com data source. Still work-in-progress (we’d love your feedback), this version allows you to see how many items currently remain in specific groups on specific boards in your monday.com account.