Updated Pipedrive data source
We’re excited to announce the launch of our massively improved Pipedrive data source - one of our biggest updates to date 🎉.
Pipedrive customers can now add a range of new metrics to their dashboards, which now refresh instantly. We’ve also overhauled the widget-building experience, added support for notifications and built three new visualizations that will make your Pipedrive data even more motivational for your sales team. Read on for more!
What’s new?
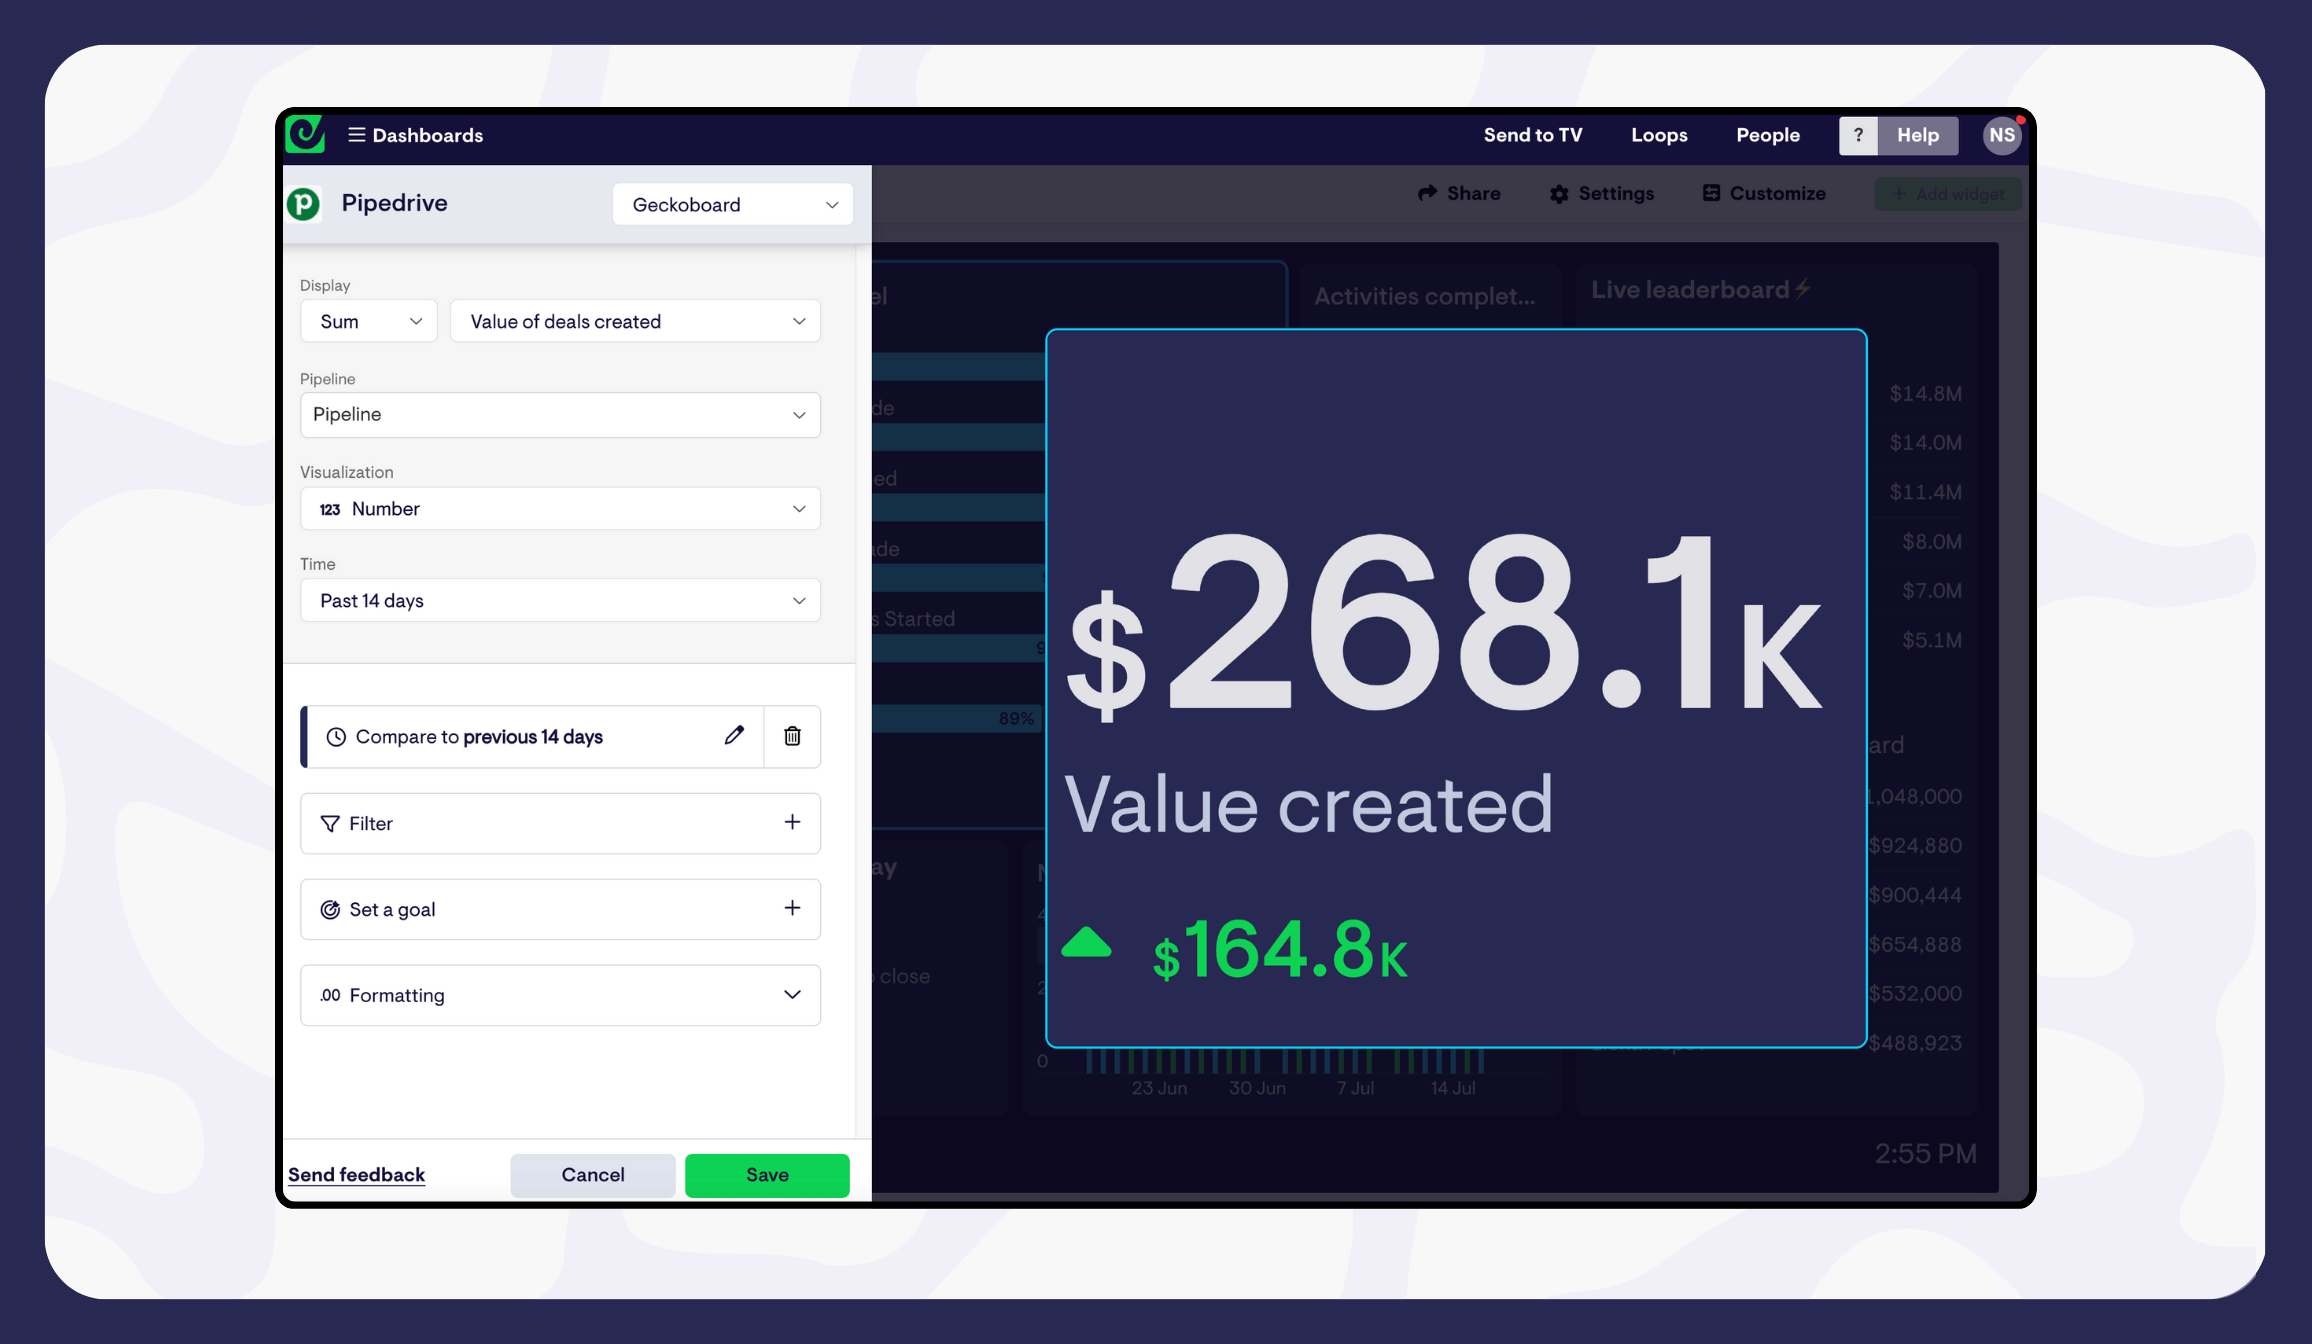
Easier Pipedrive widget-building
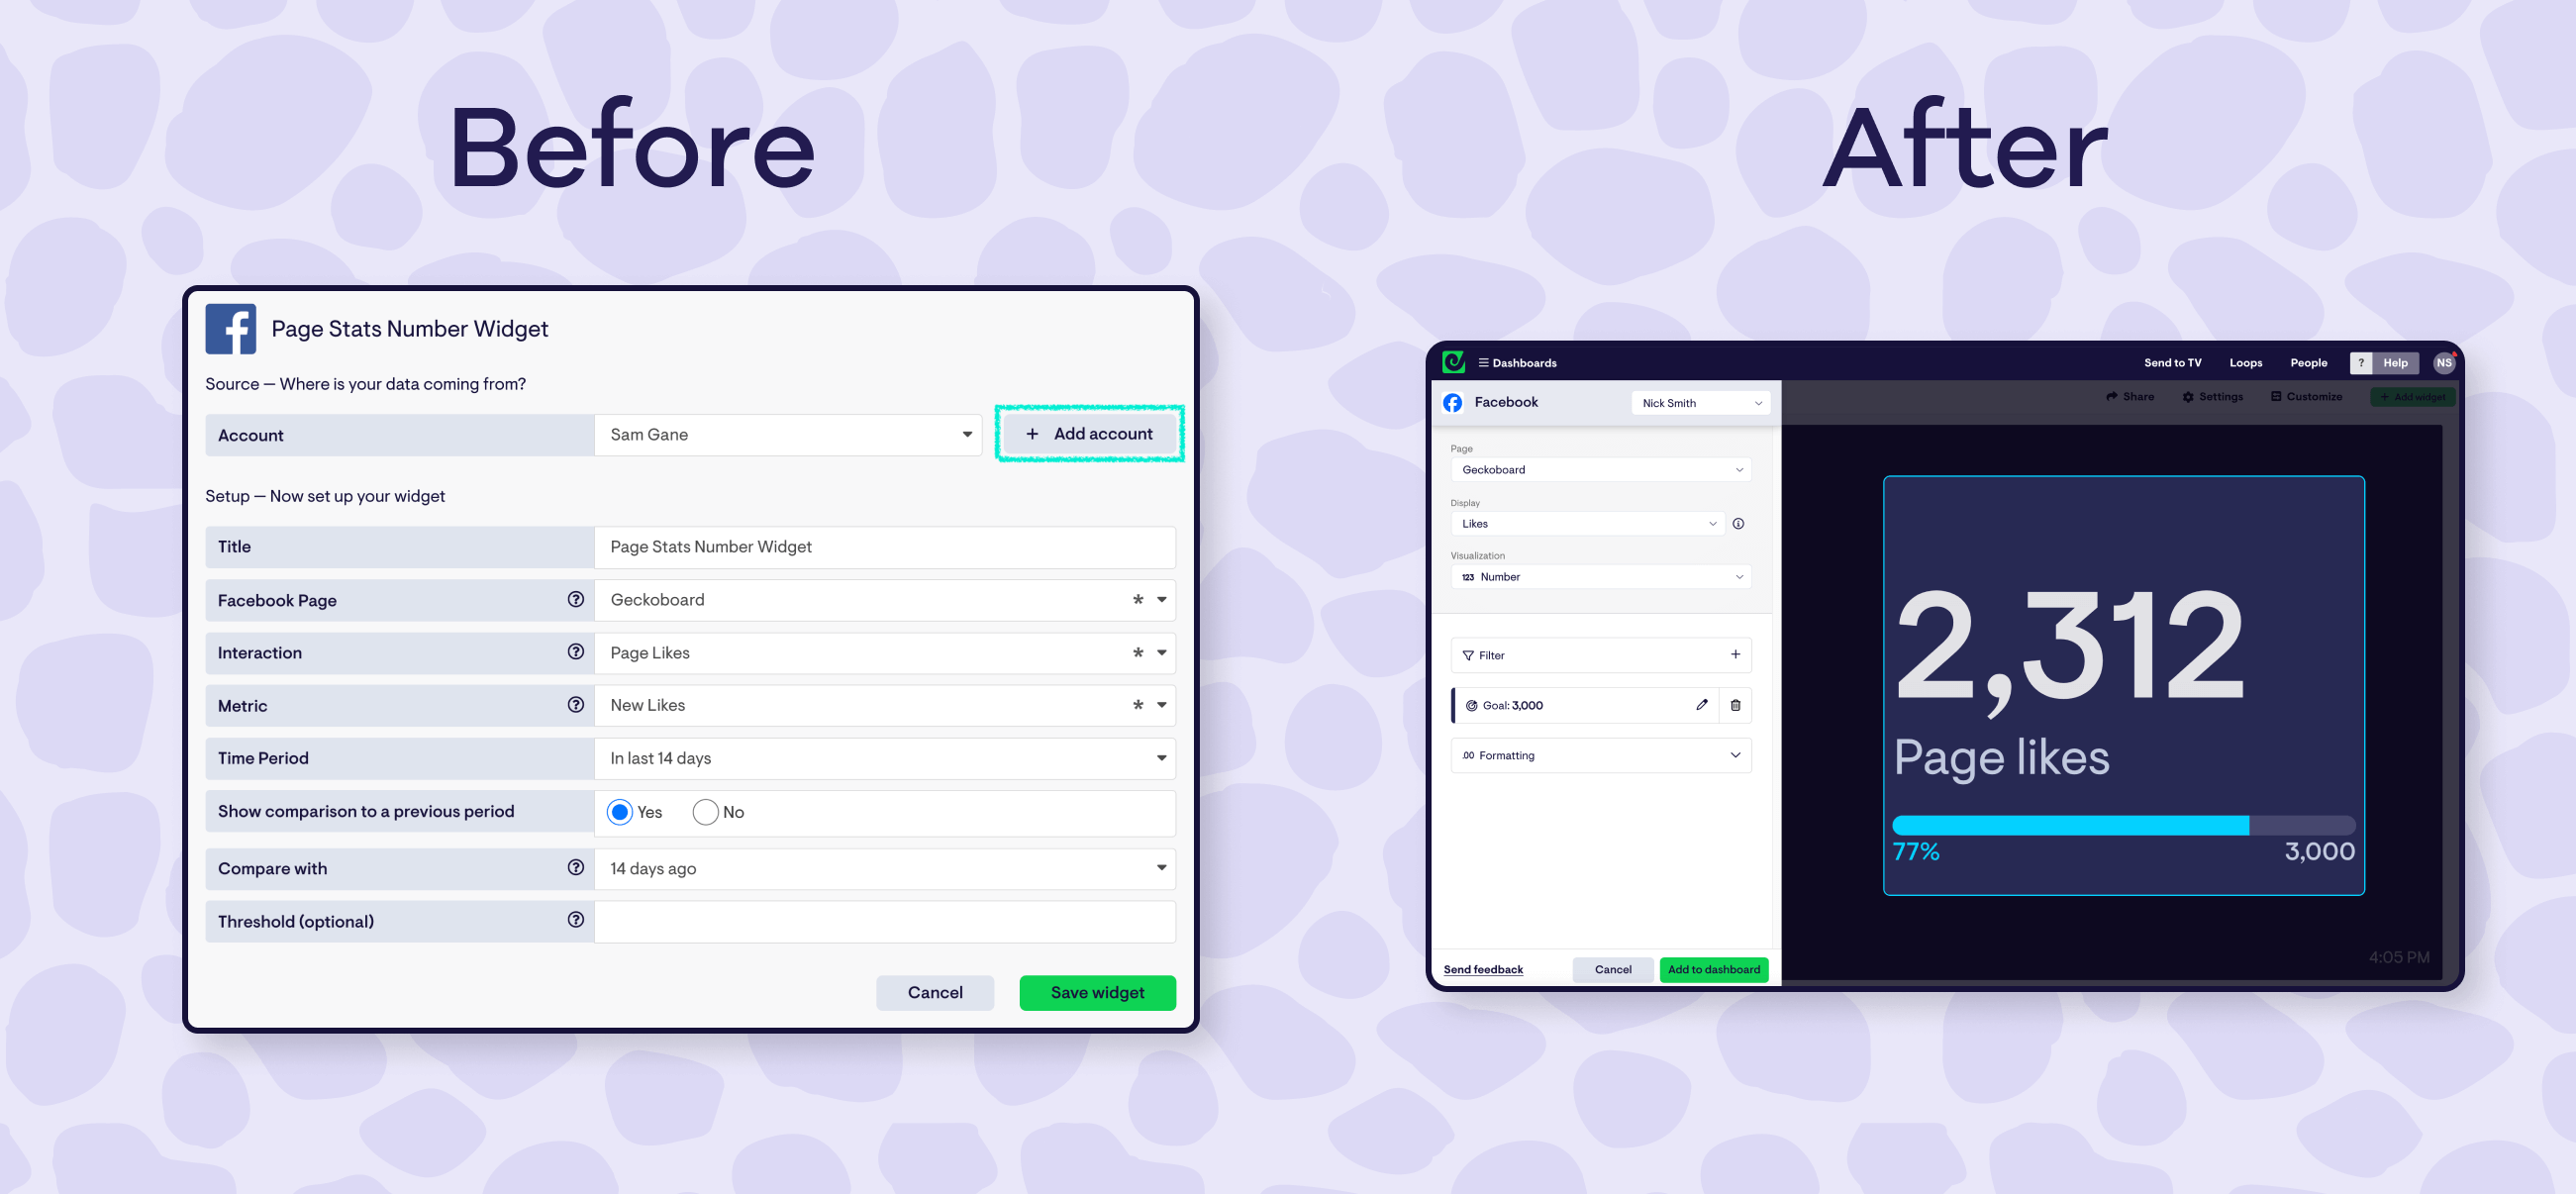
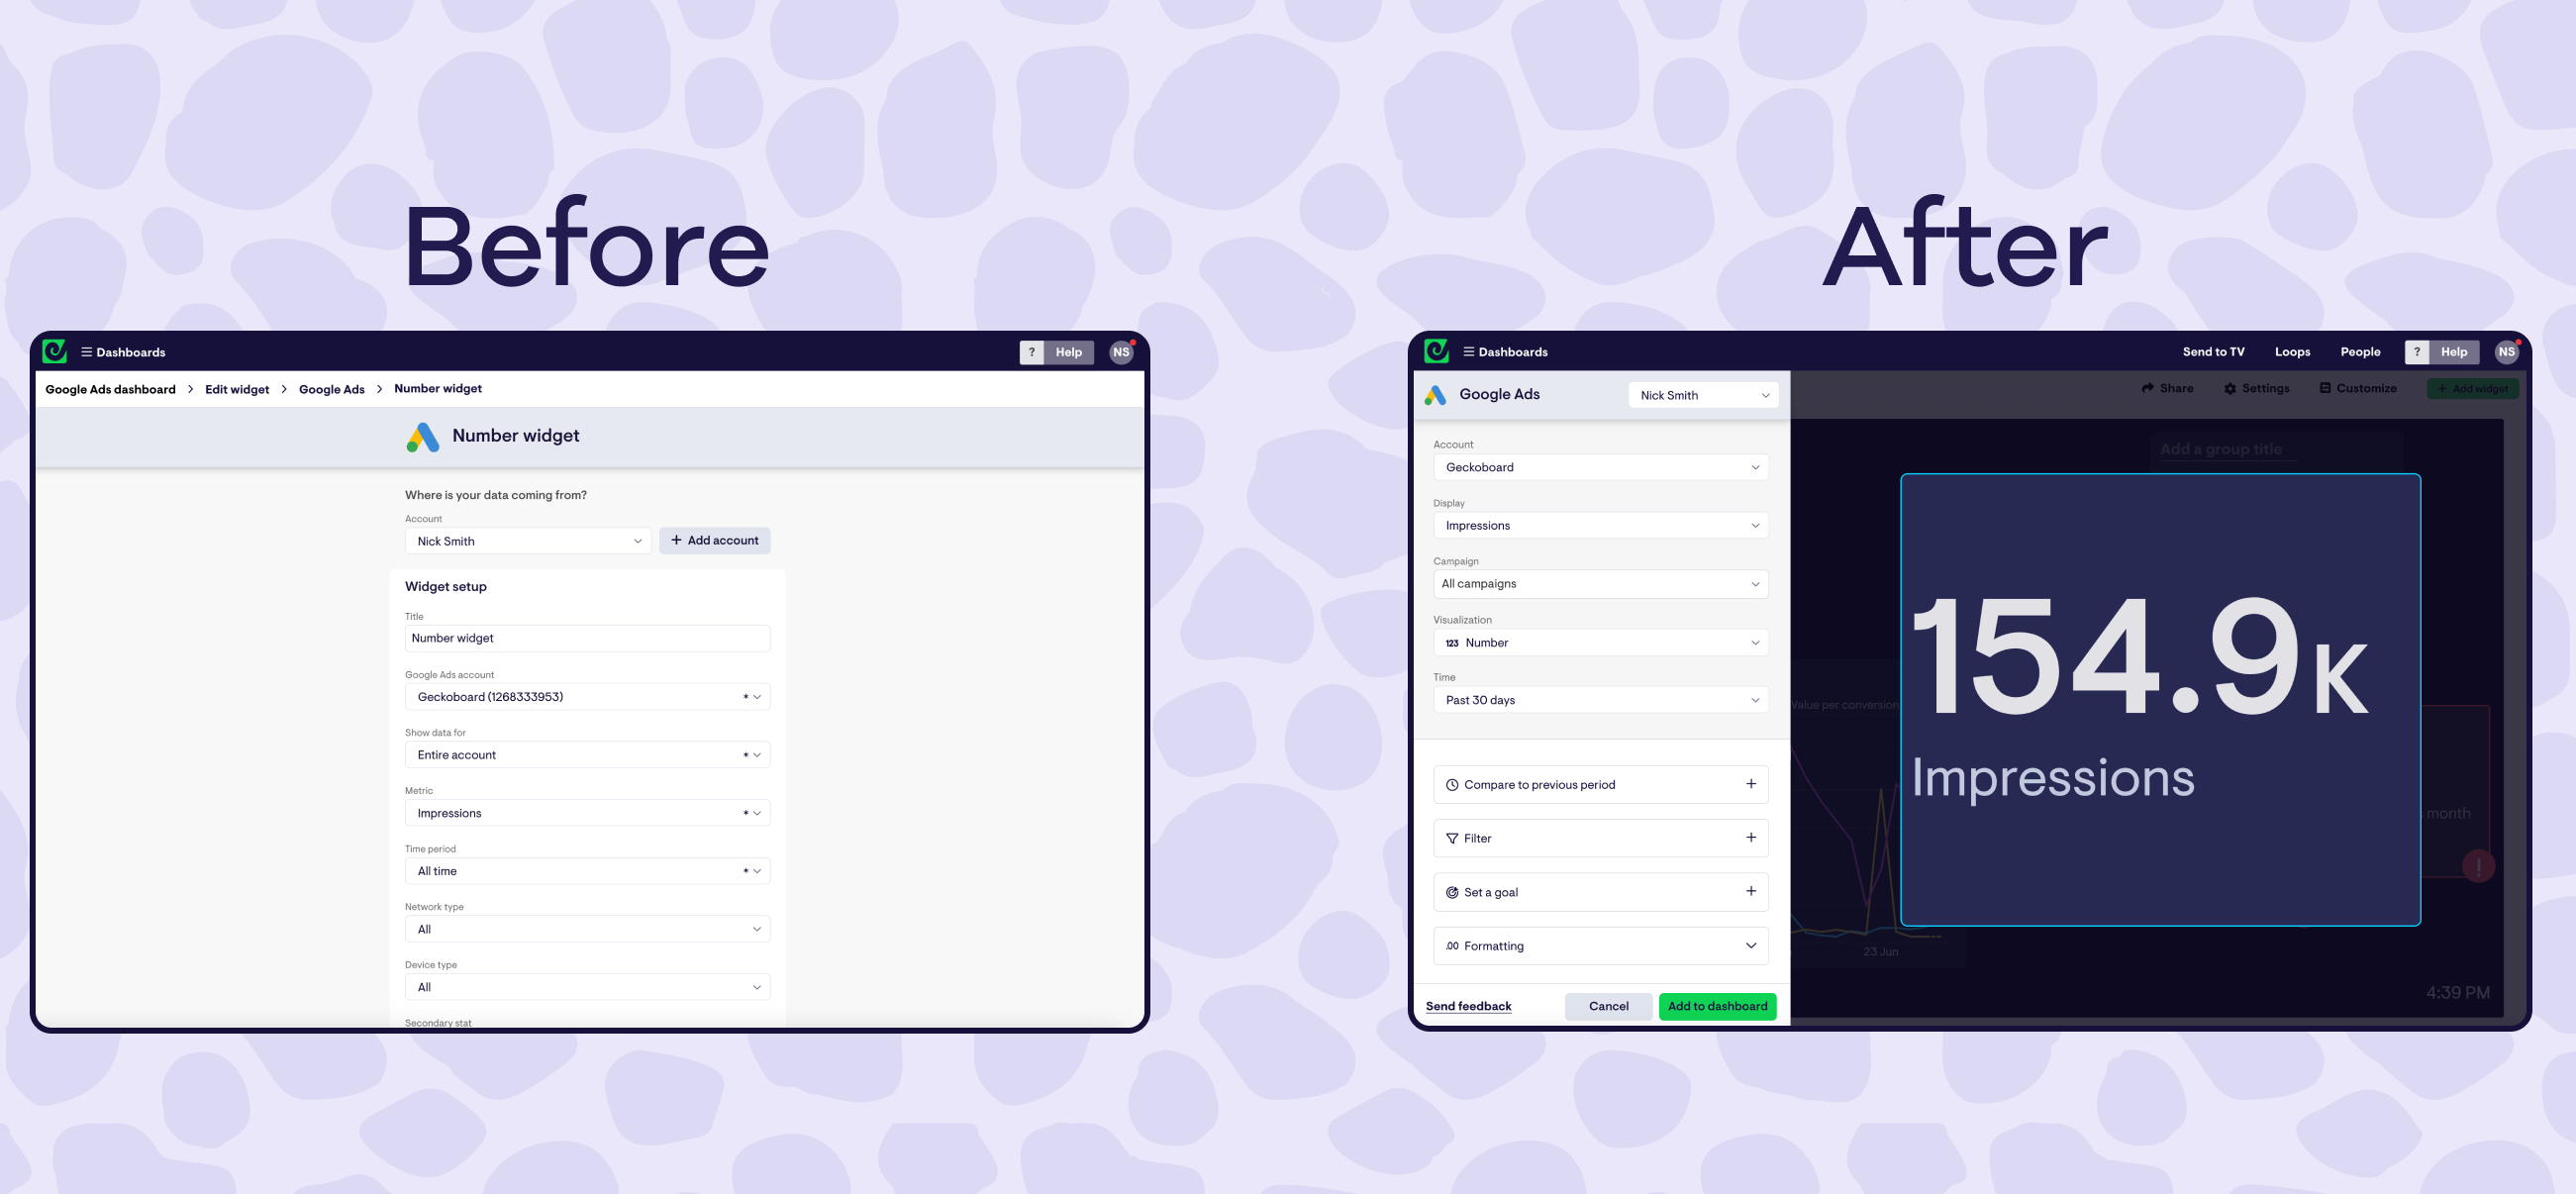
Build Pipedrive-powered dashboards much quicker, with a more streamlined widget-building flow and a live preview of your widgets that lets you see what your widget will look like before it’s saved to your dashboard.
Real-time updates
Celebrate wins and address performance issues faster; our Pipedrive integration now updates the instant deals and activities are updated in Pipedrive itself.
More Pipedrive metrics supported
You can now visualize more metrics from Pipedrive like time to close, duration of activities, weighted value of deals, deals expected to close and many more.
Support for custom fields
By popular request, we now support filtering by custom fields you’ve set up in Pipedrive. Available whatever Pipedrive plan you’re on.
Three new visualizations
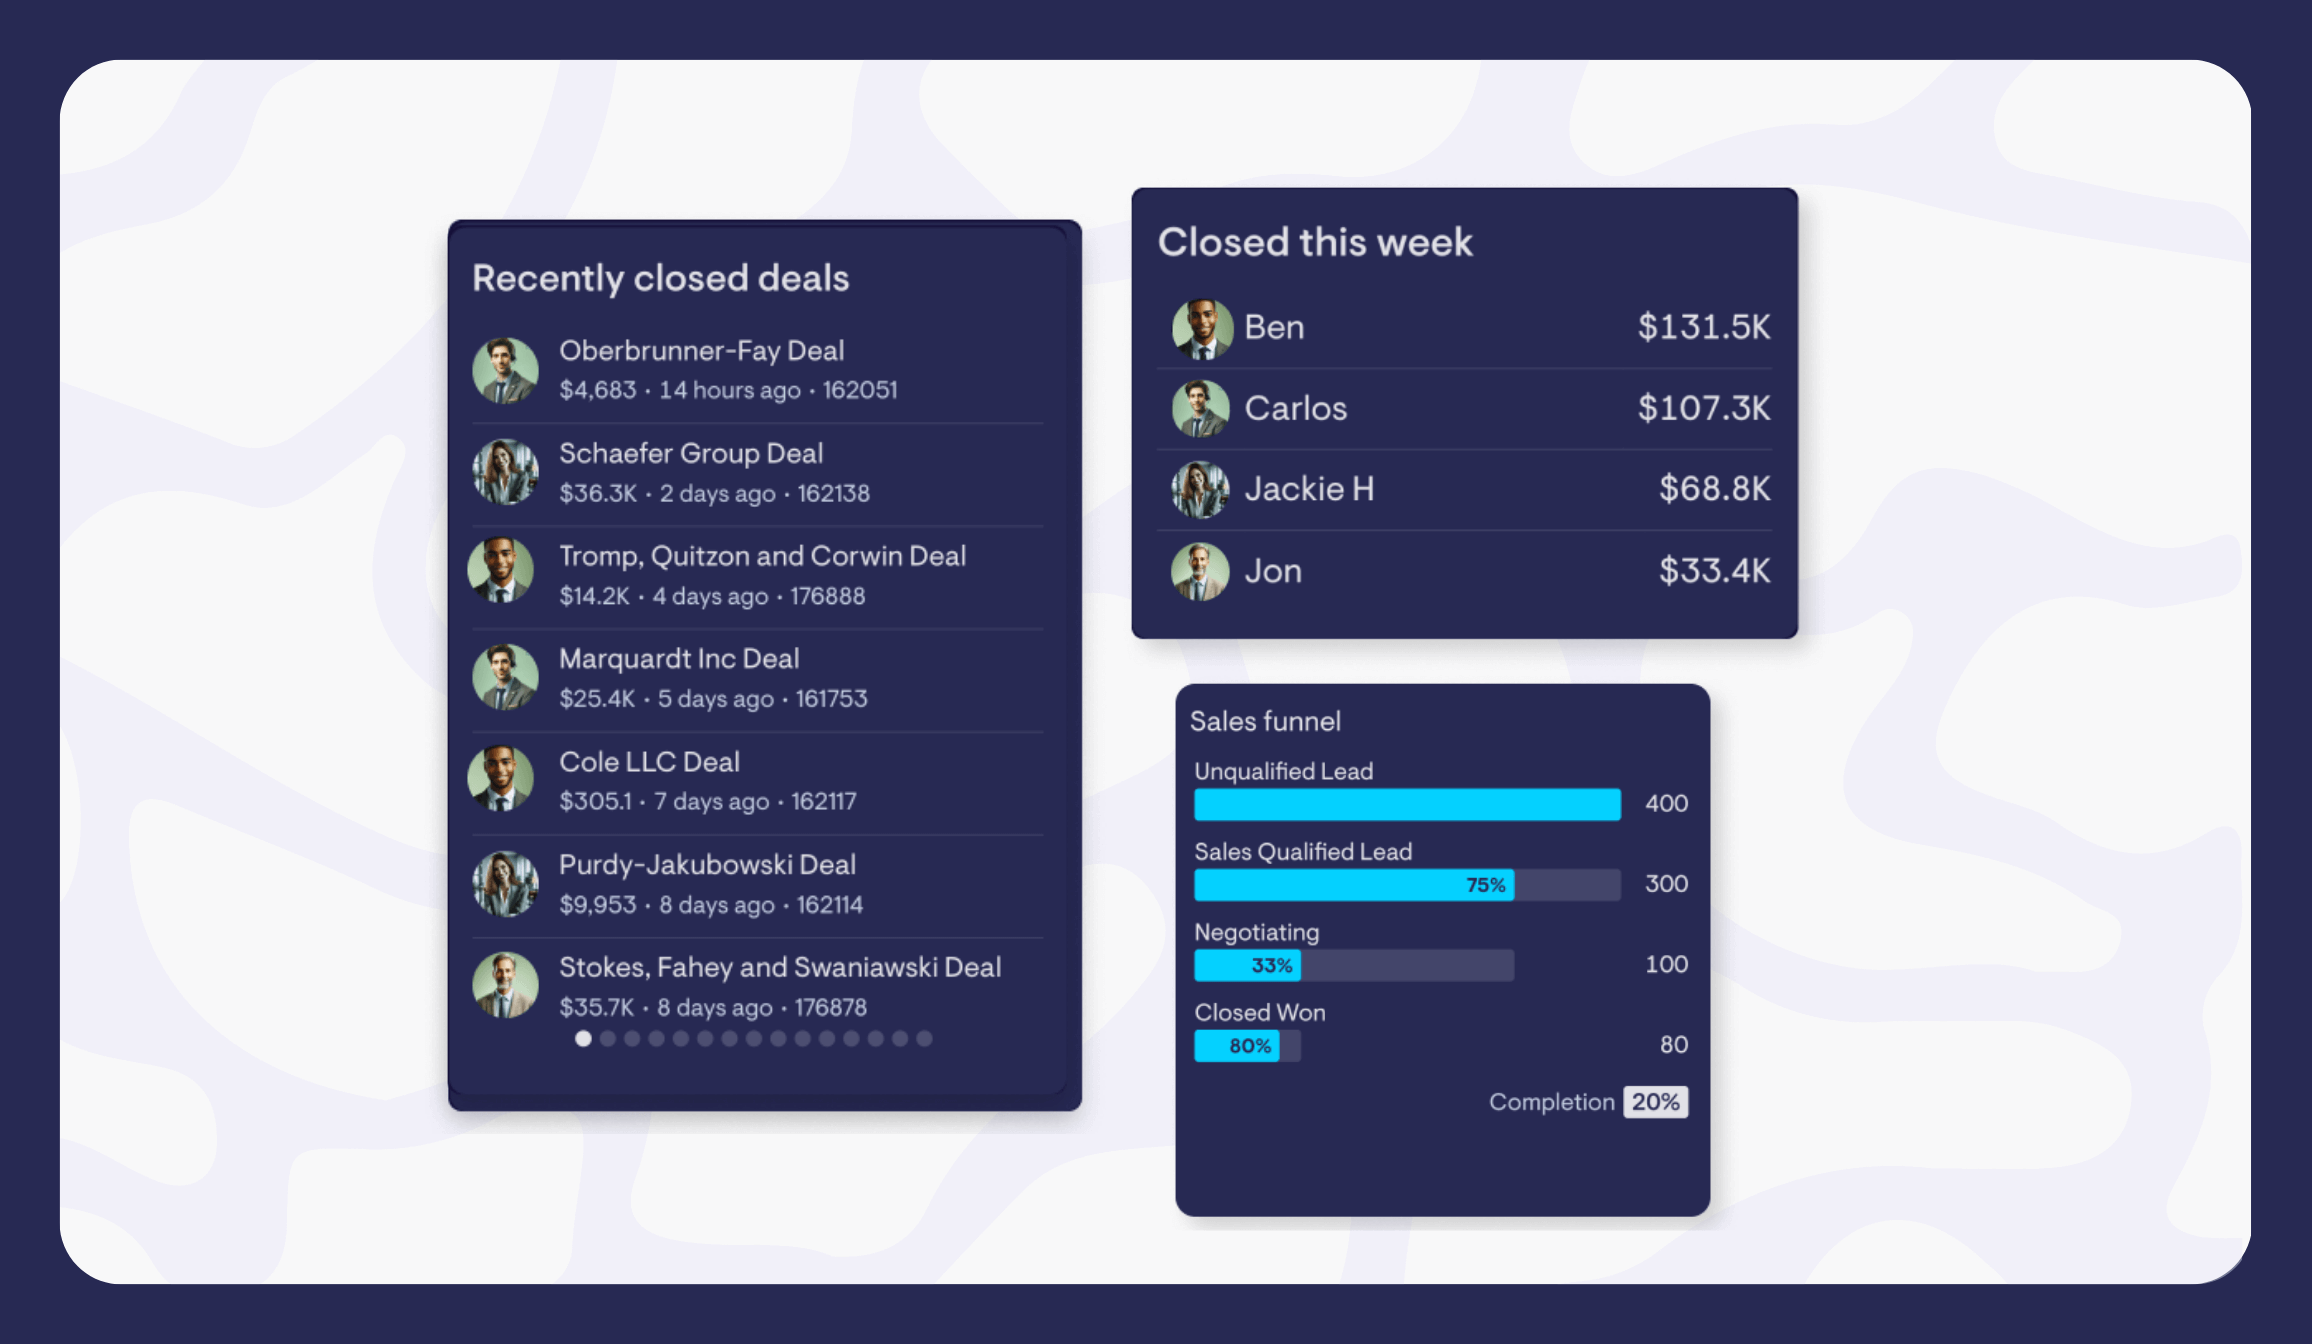
We’ve built three brand new visualizations specifically designed to make sales data more motivational - a live leaderboard featuring avatars of your reps, a deal feed, and a funnel designed for monitoring the health of your pipeline.
Notifications
Get alerted in Slack when Pipedrive metrics hit specific goals or thresholds, using notifications.
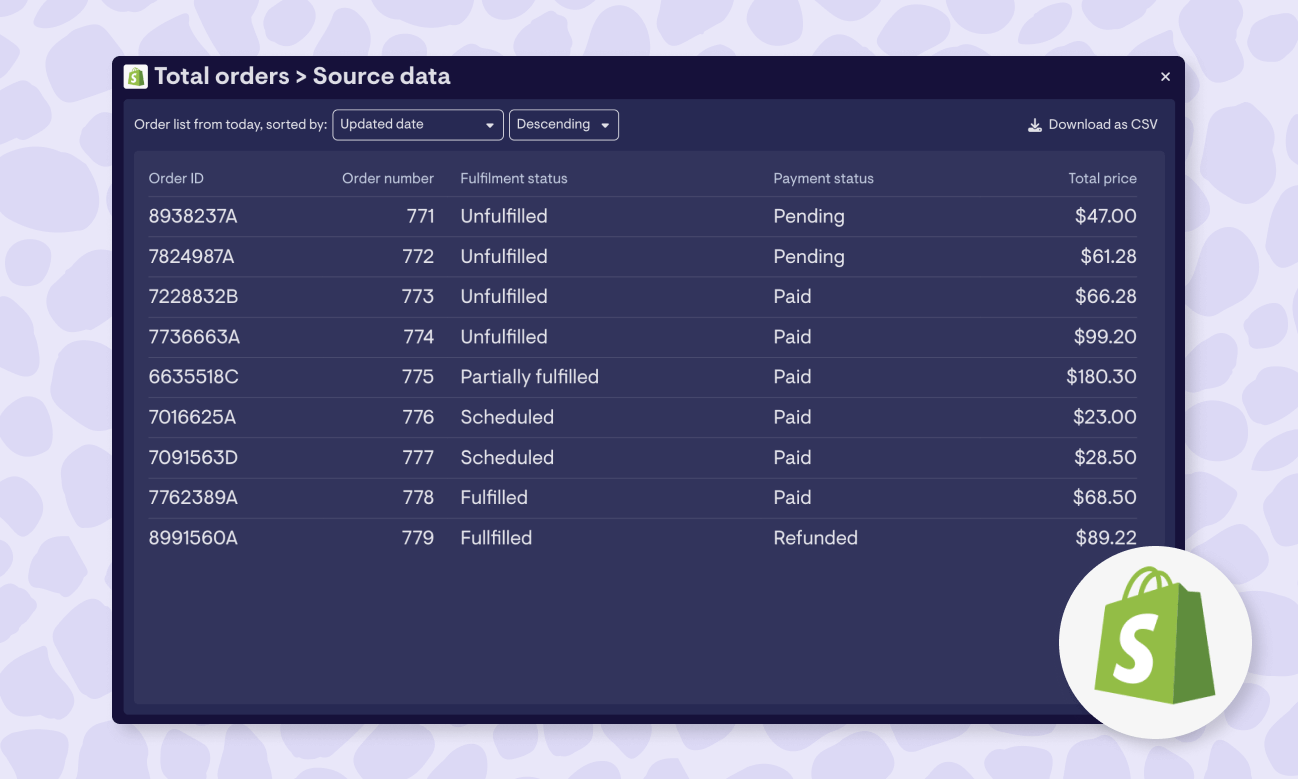
Interactive View
Want to dig deeper into changes in your data? Interactive View gives you a quick way to query your Pipedrive data right from your dashboard. You can click through to specific deals in Pipedrive and even download data as a .csv for further analysis too.
…and more
This update includes many smaller improvements too, including support for dates in the future, and more filters.
Log in and add a new Pipedrive widget to give everything a spin.