
HappyDoc achieved its first month of 10% month-over-month revenue growth after Director of Growth Christopher Ford introduced Geckoboard.
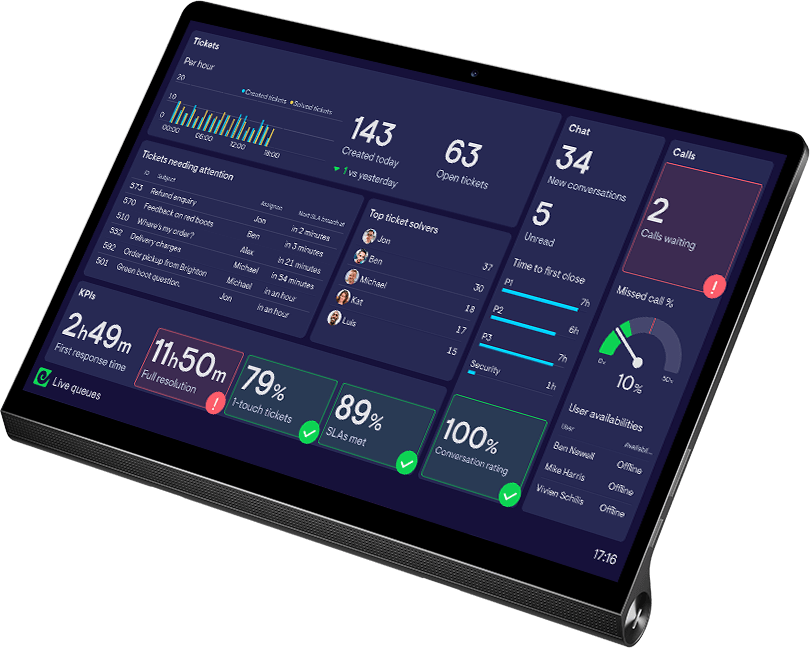
Christopher gave the team a clear growth strategy. Geckoboard made the daily activity driving that strategy visible, helping Sales and Marketing stay on track and act when performance needed attention.
HappyDoc builds AI software for veterinary clinics. As Director of Growth, Christopher is responsible for generating demand, converting opportunities, and giving leadership a clear view of how the business is performing.
With a small Marketing function and a four-person Sales team, he needs to understand the whole funnel, from the first interaction to closed revenue.
Making the drivers of growth visible
When Christopher joined HappyDoc, the Sales team didn’t yet have a clear structure for measuring performance each day.
Revenue targets showed where the business needed to end up, but the team also needed to understand the daily activity that would get it there. Christopher used Geckoboard to put those leading indicators in front of everyone.
“It takes five seconds. You can check the dashboard and know you’re doing the right thing today. You know what the goal is. You see how it’s moving.”
Salespeople can see what they need to focus on and whether their activity is moving the team toward its goals. They don’t have to wait for Christopher to provide an update or until the end of the month to find out if they’re on track.
That clarity allows the team to manage its own performance and gives Christopher more time to focus on the areas where his support will have the greatest impact.
Keeping Sales and Marketing accountable to the same plan
HappyDoc operates with a service level agreement between Sales and Marketing. Each team has a role to play in moving opportunities through the funnel, so Christopher needs to see whether both sides are delivering what the other needs.
“We operate on a marketing and sales service level agreement. The dashboards I have in Geckoboard really cleanly give us a picture on any given day of whether everyone is upholding that agreement and where the cracks are.”
The data required to understand this sits across several tools. Marketing performance lives in Google Analytics, Google Ads, and other channels, while HubSpot holds HappyDoc’s sales data.
Looking at those platforms separately made it harder to see how performance connected from demand generation through to revenue. Geckoboard brings the signals together, giving Christopher and the team a clear view of the whole funnel.
Instead of mentally piecing together a story as he moves between platforms, Christopher can see how changes in one area affect another.
Acting while the team can still affect revenue
Seeing the funnel together helps Christopher understand not only where performance stands, but how it’s changing over time.
“It’s really about the time over time change and seeing it all next to each other. I’m able to see anything that needs to be solved immediately.”
The dashboards surface areas that need attention and show him where to investigate further. If a leading indicator starts falling behind, he can direct the team’s focus toward it before it affects the revenue result.
This combination of Christopher’s growth strategy and Geckoboard’s real-time visibility helped HappyDoc achieve its first month of 10% month-over-month revenue growth.
“Since I joined and implemented Geckoboard, we had the first month where we drove 10% month over month growth of our entire business’s revenue. Geckoboard made it easier to understand that we were on track across all the different leading indicators.”
The team didn’t have to wait for the final revenue number to understand whether the strategy was working. It could see progress building throughout the month and keep the activity driving growth on track.
Giving the whole business confidence in the numbers
The same underlying performance data supports conversations beyond Sales and Marketing.
Christopher reviews the dashboards with HappyDoc’s CEO each week. The wider company sees performance during Friday all-hands meetings, and investors receive a tailored view every Monday.
Each audience needs a different level of detail, but the numbers remain consistent. Christopher organizes the information differently for each context while keeping everyone connected to the same underlying performance.
This gives the team, leadership, and investors a shared understanding of what’s driving growth. Conversations can focus on what’s changing, what needs attention, and what happens next instead of reconciling different reports.
The tool Christopher takes from role to role
HappyDoc is the third company where Christopher has introduced Geckoboard. Over five years, he’s used it in-house and at an agency, where he rolled it out across more than 40 client accounts.
The use case has changed with each business, but the reason Christopher keeps choosing Geckoboard hasn’t. It puts the measures driving growth where teams can see and act on them.
At HappyDoc, Christopher used that visibility to turn his growth strategy into clear daily action. Sales knew what to focus on, Marketing and Sales could see how their work connected, and the business achieved its first month of 10% month-over-month revenue growth.
See how Geckoboard helps Sales teams turn daily activity into growth