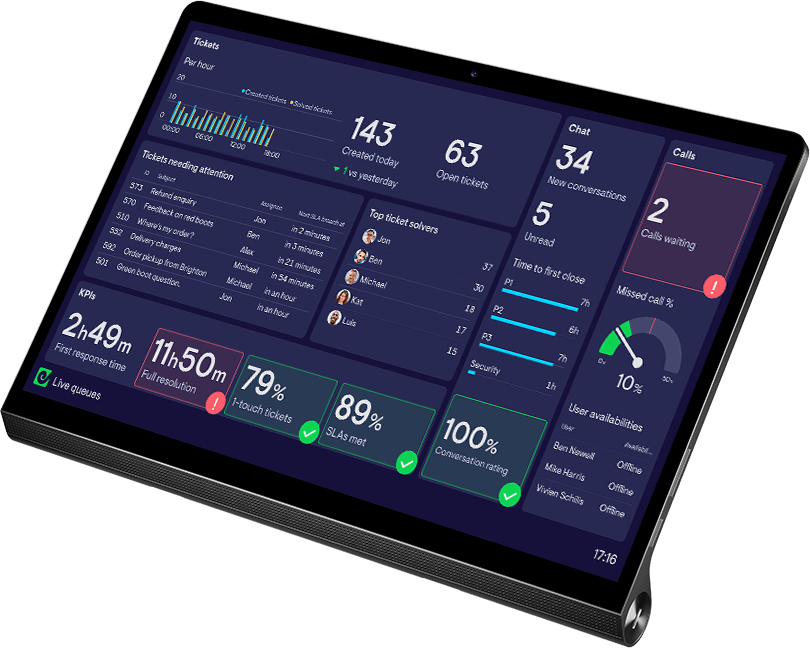

Making performance data visible with Geckoboard helped myenergi improve customer care efficiency by 20–25%. That same visibility helped drive a 3–4% increase in sales revenue over two months. It’s also helped teams across the business take ownership of their results and celebrate progress.
“Geckoboard has helped change our internal culture, from ‘we’re here just to do a job’ to realizing there’s a bigger picture.”
myenergi makes technology that helps households manage their energy use, from EV chargers and solar energy diverters to hybrid battery systems. Its customer care teams support those products across the UK, Europe, and Australia, working through calls, email, live chat, and web forms.
For Kieran Maclachlan, Head of Customer Care, improving the service started with understanding what was happening across that operation. The team had reports in different systems, but managers and agents needed a clearer view of demand and performance.
Geckoboard brought those numbers together. As the customer care team began using shared dashboards and individual performance reports, other departments saw the opportunity. Sales replaced its whiteboard. Senior leaders began asking Claude for metrics through Geckoboard’s Metrics MCP. Production staff could see how the products they built contributed to company results.
Bringing Zendesk and Aircall data into one contact center view
As myenergi grew and added tools, understanding customer care performance became more complicated. Zendesk, Aircall and an AI assistant each offered their own reporting. Managers had to piece together the picture across those systems.
“Before Geckoboard, our customer care team was underperforming because there was no visibility.”
Kieran wanted to see ticket performance alongside live call demand and agent activity. Geckoboard gave myenergi a way to bring that information into shared dashboards, with office TVs showing call statistics, customer feedback, and team performance. The team could see where it stood, and colleagues visiting the department could see the work behind the service.
Improving customer care efficiency by 20–25%
Once the team had a shared view, myenergi introduced individual agent dashboards. Every week, agents receive an email snapshot of their performance, wherever they work. Managers receive daily snapshots, giving them a regular view of progress and the information they need for reviews.
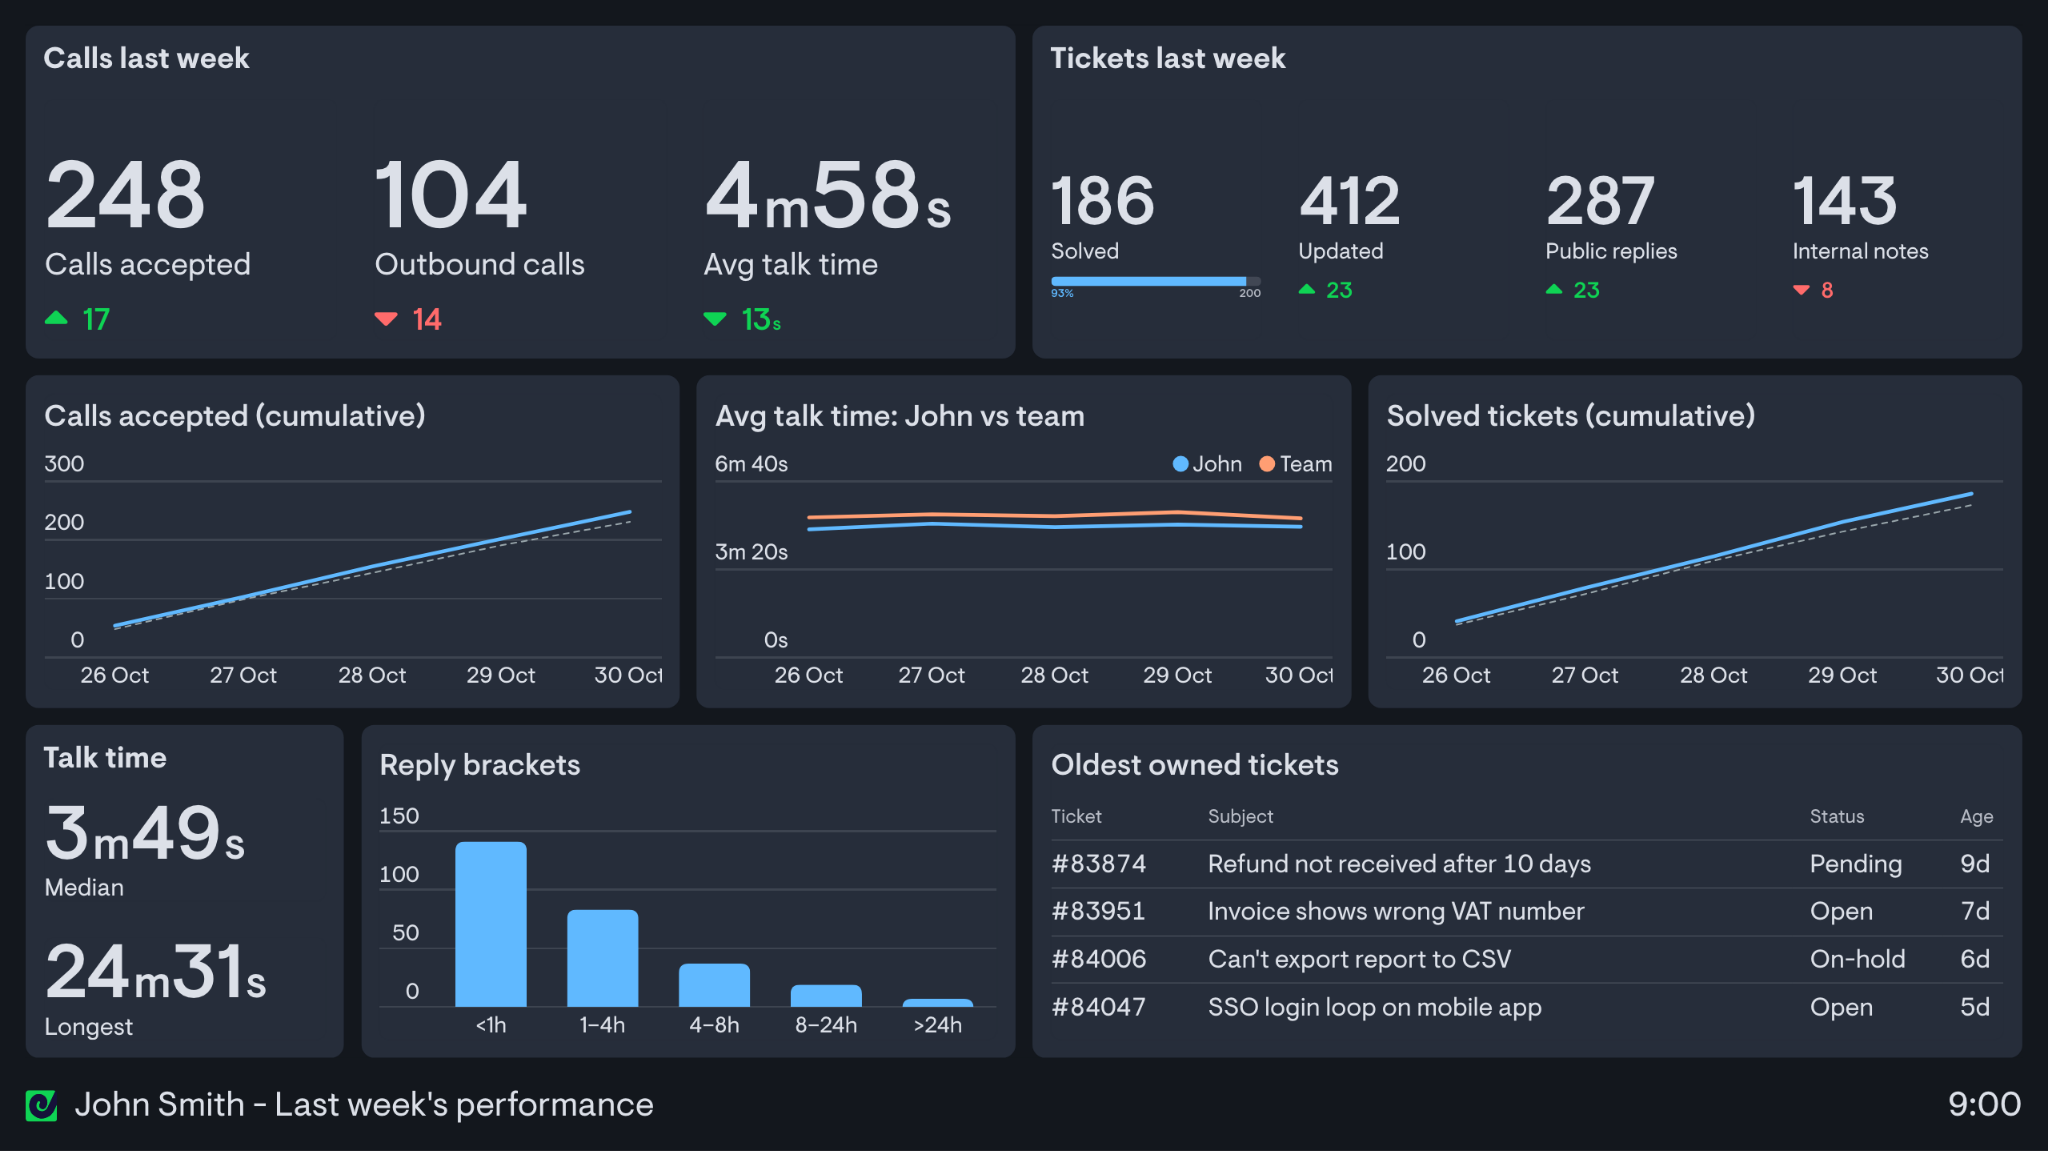
That visibility makes performance easier to discuss. Agents can see how they’re doing, managers can identify where support is needed, and good work is easier to recognize. On-screen celebrations draw attention to achievements such as hitting a KPI or receiving a five-star customer satisfaction review.
“With Geckoboard, we can see who’s done a great job, who’s really smashing it, and celebrate them.”
myenergi measures customer care efficiency using one-touch resolutions, full resolution time, wait time, and call time. Kieran attributes the 20–25% improvement across its customer care teams to making those metrics visible with Geckoboard.
“With Geckoboard, we’ve seen a 20–25% improvement in efficiency across our customer care teams.”
Managers also have the information ready when development reviews come around. Less time goes into gathering data, leaving more time to support agents and improve the customer experience.
Using the data to protect service quality
myenergi wanted to improve service by resolving customer questions as quickly as possible. But when that led to hurried conversations, Geckoboard showed a decline in service metrics.
With the impact visible, Kieran reversed the change and used the evidence to explain the decision to senior leadership.
“Geckoboard showed us when speeding up calls was hurting service quality. We could explain why we needed to change back, and no one could argue with the data.”
The team could assess the effect of its operating model and make a case for giving customers the time they needed.
Making current service performance visible to customers
myenergi extended that openness beyond the company. After experiencing a period of long wait times, it added a Geckoboard dashboard to its help center showing the number of calls in the queue and average time to answer.
Customers can use that information to decide whether to hold, call back later, or use another channel. It gives them a clearer picture before they pick up the phone.
Salespeople can share the same support performance when customers or partners raise concerns about past experiences. Rather than relying on reassurance alone, they can open a dashboard and show what’s happening now.
Replacing the sales whiteboard and lifting revenue by 3–4%
When the sales team saw the customer care dashboards, it recognized an opportunity to improve its own visibility. At the time, sales figures were written on a whiteboard. If visitors needed to be kept from seeing the numbers, someone had to wipe it clean, sometimes several times a day.
Geckoboard replaced that manual display with sales dashboards. Individual technical sales managers now have dedicated views of their performance, including comparisons with the previous month and the same month in the previous fiscal year. Their numbers are also visible to colleagues across the business.
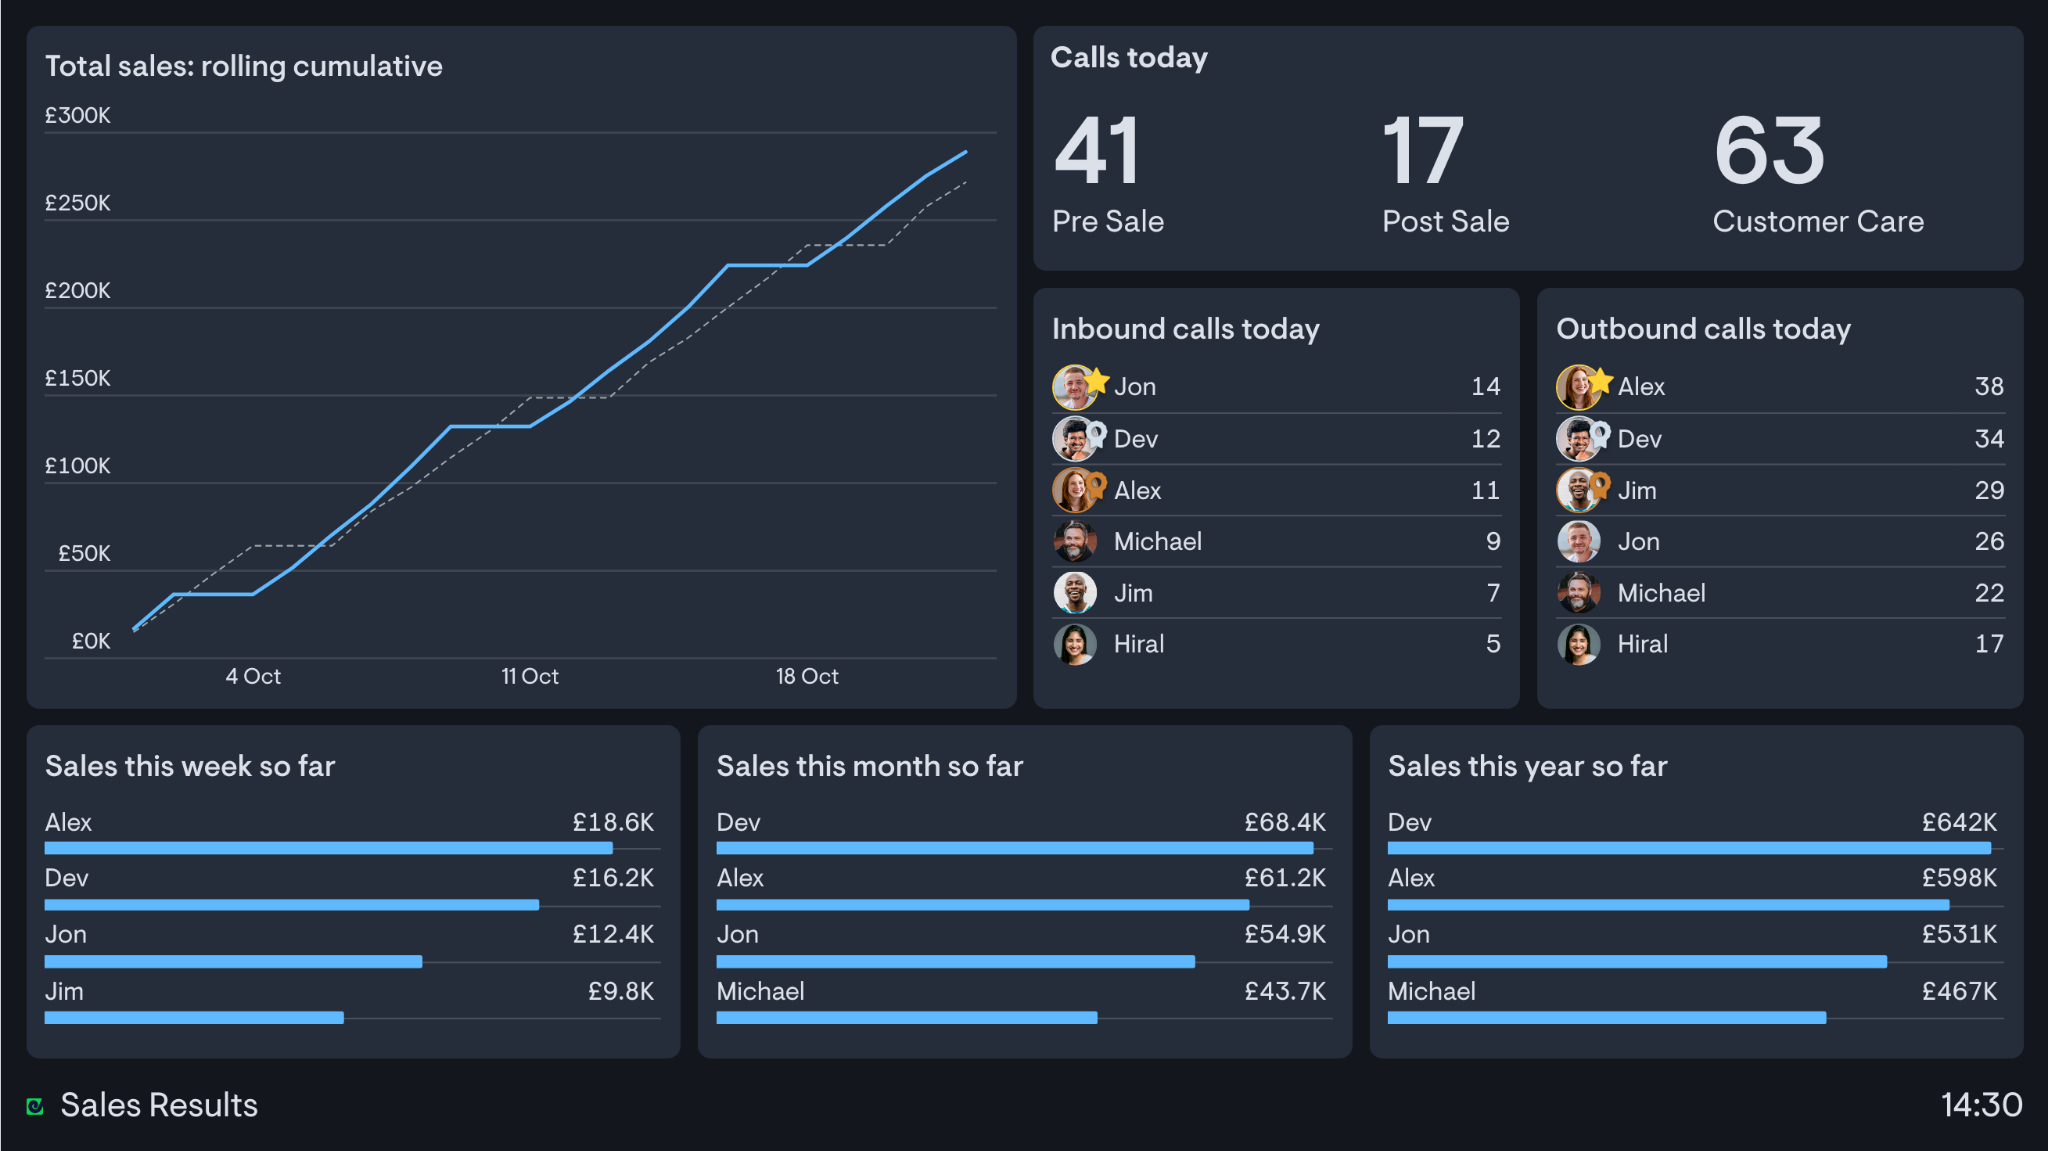
“The sales team has the bigger picture now and can quickly see where they’re at.”
Kieran attributes a 3–4% uplift in sales revenue over a two-month period to making those numbers visible with Geckoboard. Salespeople themselves told him the visibility had made a difference.
“Making our sales numbers visible with Geckoboard has helped us achieve a 3–4% uplift in sales revenue over two months.”
Giving senior leaders answers through Claude and the Metrics MCP
myenergi connected Geckoboard’s Metrics MCP to Claude so senior leaders can get performance updates just by asking.
The Metrics MCP uses Model Context Protocol to let compatible AI assistants retrieve metrics from Geckoboard’s connected data sources. At myenergi, that means Kieran and senior leaders can ask Claude about performance without manually searching through dashboards or requesting an update from operations.
“Geckoboard’s Metrics MCP has been game-changing for us.”
The biggest benefit has been leadership self-service. Routine requests for the latest numbers don’t have to pass through Kieran and his wider team.
“Our senior leaders don’t have to keep coming to me or my operations team to ask for data. They just ask Claude. They self serve now, which is absolutely fantastic, and it’s made our lives so much easier.”
For Kieran, the value is time he can put back into running the operation and improving customer service. Leaders can get the information they need, while the people responsible for delivery have fewer interruptions.
Helping everyone see how their work contributes
The change has reached people who would previously have seen sales results only at all-staff meetings. With performance on the TVs, staff can follow progress and talk about achievements as they happen.
That includes the production teams building myenergi’s chargers in the factory below the offices. They can see the revenue their products help generate and how their work contributes to company goals.
“Geckoboard has really started to change our internal culture, away from ‘we’re here just to do a job’ to realizing there’s a bigger picture.”
Customer care agents can see their own contribution to service. Salespeople can track their progress against targets. Leaders can get answers directly, and production staff can connect the products they make with the company’s performance. The numbers have become part of how people understand their work and celebrate progress together.

Make performance visible across your business
Geckoboard brings metrics from the tools your teams use into clear, shared dashboards. Explore dashboards for Customer Care and Sales, or see how the Metrics MCP lets your AI assistant work with your metrics.
Give Geckoboard a go with the 14-day free trial.