Single sign-on (SSO)
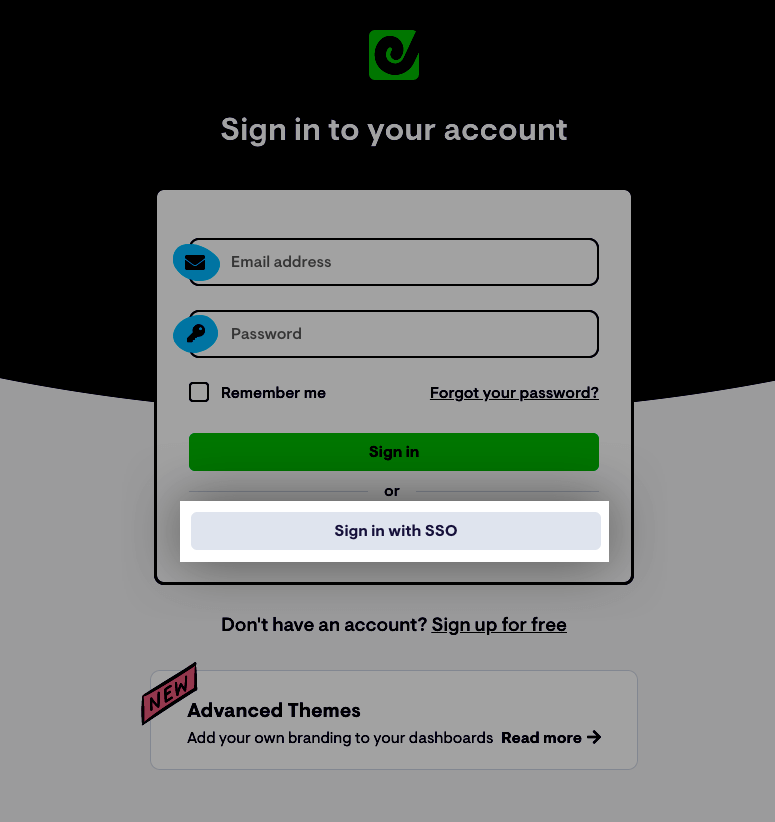
Geckoboard now supports single sign-on (SSO), making it easier and more secure to manage Geckoboard users within your organization. With SSO enabled on your account, if your organization supports Google, Okta, OneLogin, Microsoft Azure AD (and more) as your identity provider, members of your organization can securely log in to Geckoboard using their work email address by clicking ‘Sign in with SSO’ on our login page.
SSO is available as a custom add-on to your existing Geckoboard plan. Read more about how it works in our documentation here, or contact us to discuss your needs.