Product updates
Comparison visualizations on Shopify widgets
We've released an update to the beta of our Shopify data source that now lets you show how your Shopify data has changed compared with a previous time period.
The beta of our new Shopify data source now lets you show how your Shopify data has changed over time. You'll now find comparisons available on line charts and number widgets, that let you compare hourly, daily, weekly and monthly data, depending on how you've set your widget up.
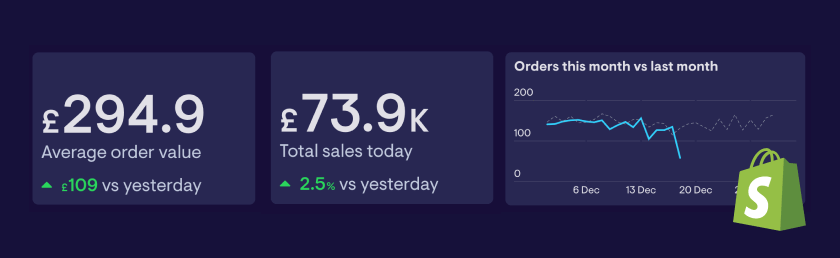
Note: We limit the amount of historical data we import from Shopify, so comparisons can be applied only to timespans that cover the 31 days before you connected your Shopify account to Geckoboard onwards.
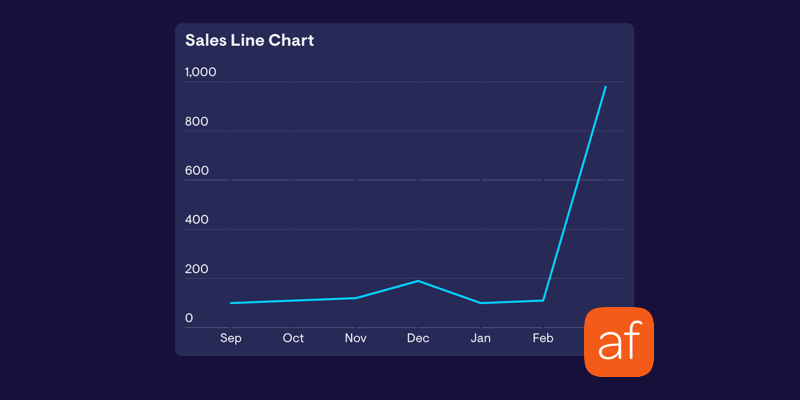
Number and line widgets for visualizing AppFigures Sales
We've rebuilt our AppFigures number and line widgets to make it possible to show data from Android and iOS apps on the same widget. We've also tidied up the time periods you can filter your metrics by, and the updated widgets also benefit from recent visual updates we've made across the board.
Switch widget orientation in a group
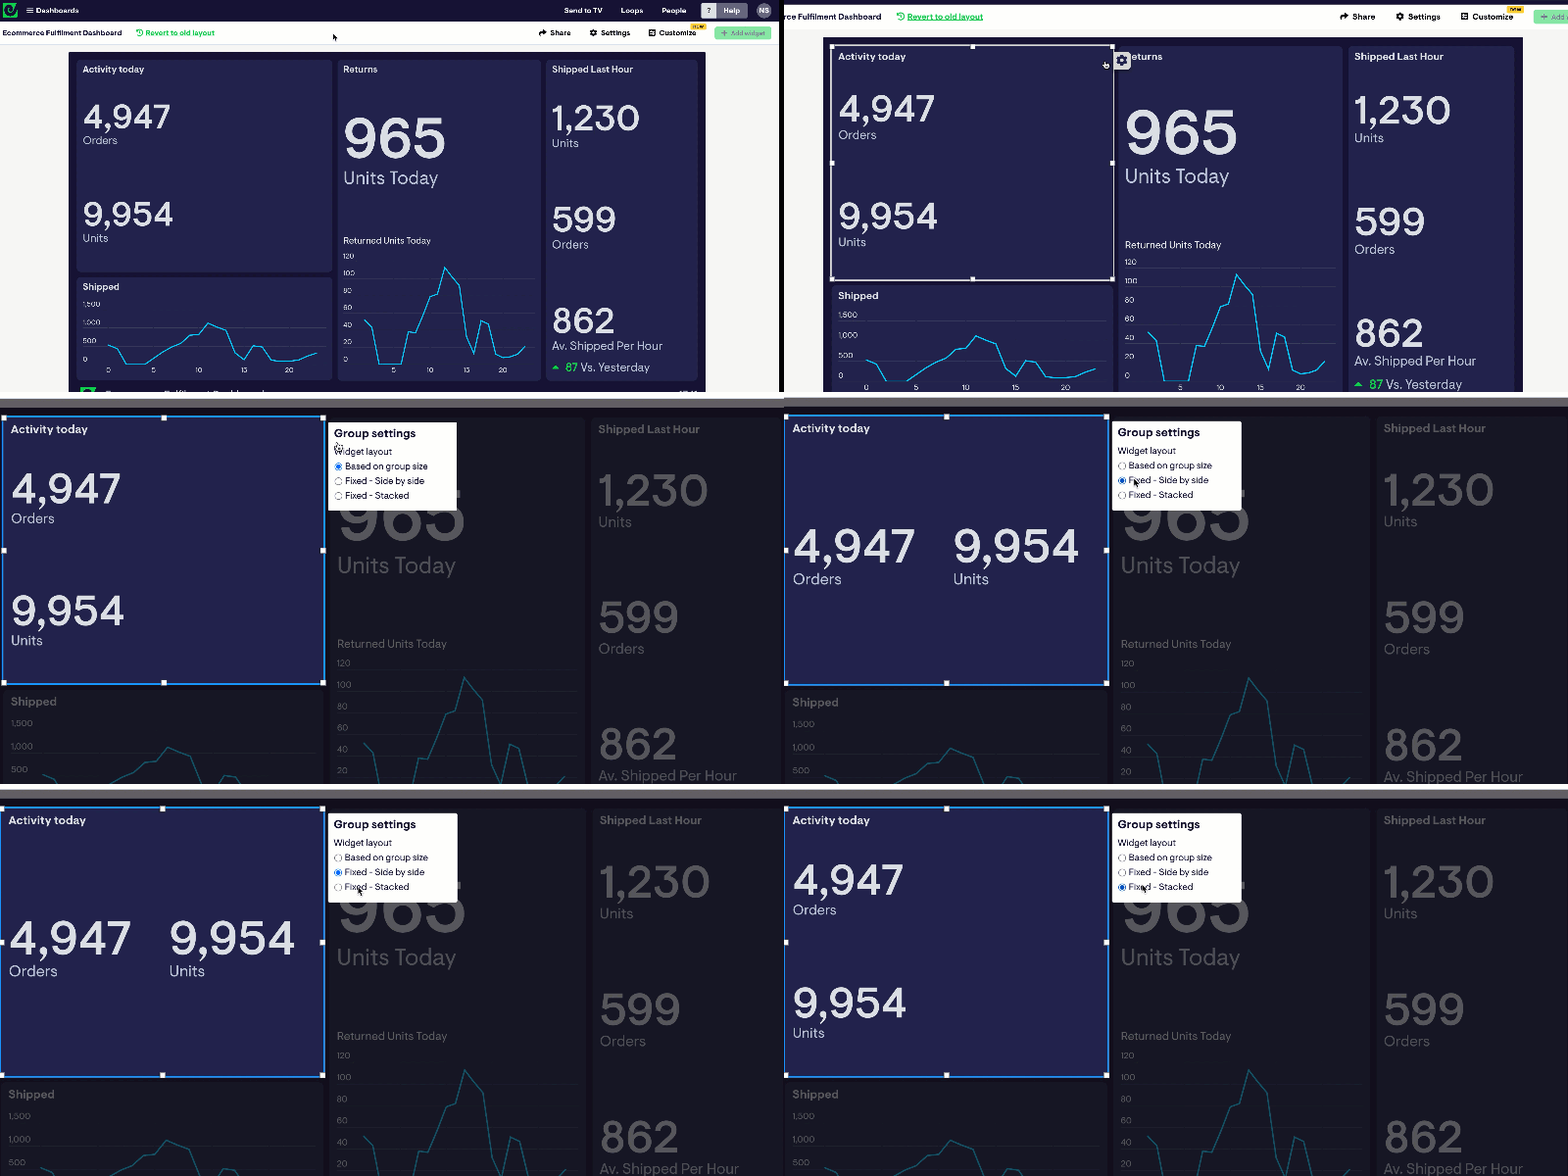
When grouping widgets, widgets within a group will position themselves based on the space available. Now we're giving you more control over whether widgets stack vertically on top of each other, or horizontally side by-side.
The next time you're building a dashboard, you can quickly and easily switch the orientation of widgets by hovering over the group, clicking the cog icon that appears in the top right of the group ⚙, and picking an option that works best for the dashboard you're working on.
Shopify data source (beta)
We've released a beta version of our brand new Shopify data source. Re-written from the ground up, it makes it much easier to keep track of key performance metrics from your Shopify store (or several stores!). Here's what's new:
- A simpler widget-building experience, making it easier to quickly spin up dashboards that contain important Shopify metrics
- Support for a wide range of Shopify metrics, covering sales, orders, orders that have been cancelled, unfulfilled, fulfilled or that are pending, and average order value
- Break these metrics down by billing location, channel, currency, discount code and more
- Apply timespans covering up to 31 days, right down to the hour
- Access metrics from multiple Shopify accounts
- Apply goals and status indicators to your Shopify metrics to show how they're changing over time
- Visualize Shopify metrics using a range of visualisation types, including line charts, column charts, leaderboards, gauges and table visualizations
You can try the beta out by clicking 'Add widget' and selecting the beta in the list of data sources. We'd love your feedback!
Single sign-on (SSO)
Geckoboard now supports single sign-on (SSO), making it easier and more secure to manage Geckoboard users within your organization. With SSO enabled on your account, if your organization supports Google, Okta, OneLogin, Microsoft Azure AD (and more) as your identity provider, members of your organization can securely log in to Geckoboard using their work email address by clicking ‘Sign in with SSO’ on our login page.
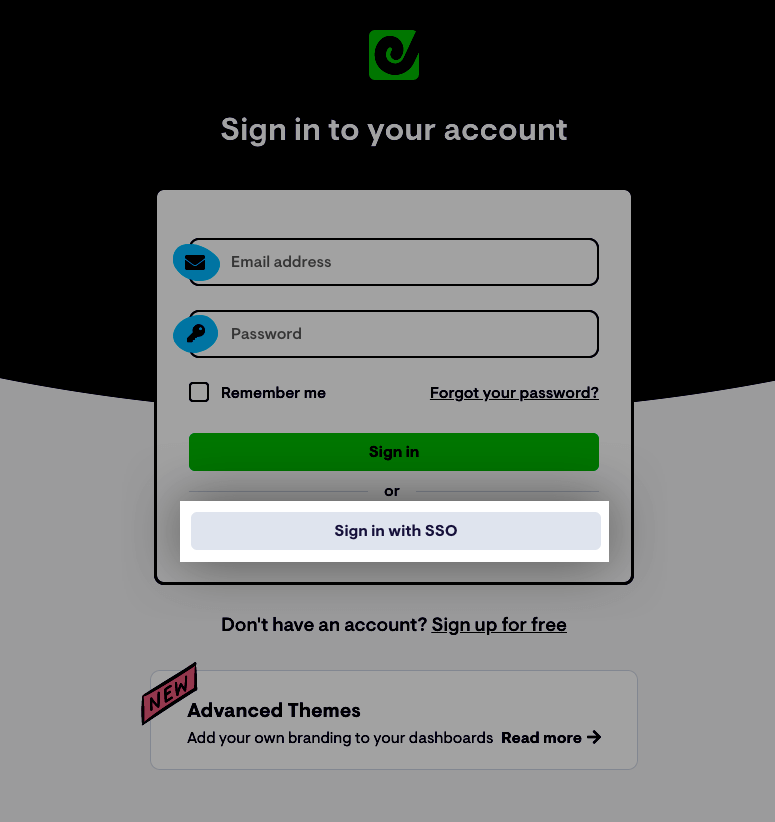
SSO is available as a custom add-on to your existing Geckoboard plan. Read more about how it works in our documentation here, or contact us to discuss your needs.
Support for new database functions
We’ve updated our Database data source to support the following new functions:
- UNIX_TIMESTAMP
- JSON_EXTRACT
- TIMEDIFF()
- DATEDIFF()
- LAST_DAY
- CONVERT_TZ
Datasets API improvements
We’ve released a number of highly-requested improvements to our Datasets API:
- Added: Multi-series column charts
- Added: Support for ‘duration’ field types
- Added: Ability to delete datasets directly within the Geckoboard UI
- Added: ‘Last’ aggregation in the Geckoboard UI
- Improved: Field limit raised from 10 to 20
- Improved: All field types now support null values
You can find out more information on these changes in our developer docs, which have also been revamped!
Advanced dashboard theming
Customize your dashboards to look and feel just the way you want, with our new Advanced dashboard theming service - available now as a paid add-on to your account.
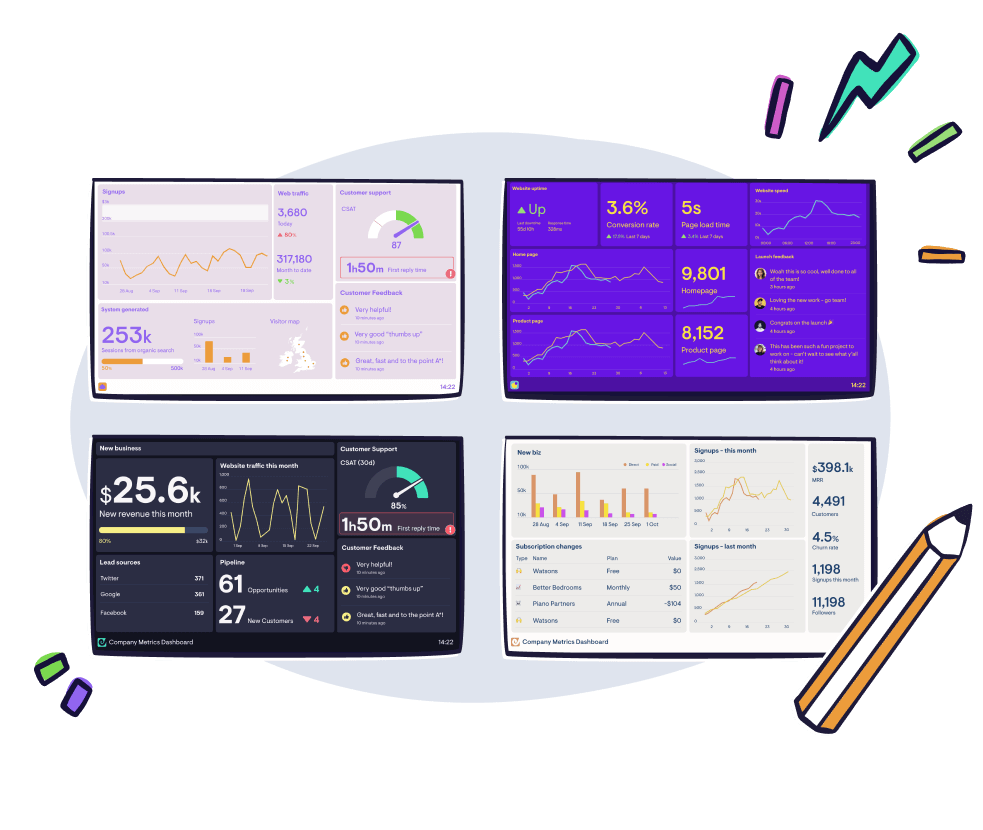
Working with our team, you can color-coordinate almost every element of your dashboard - from your dashboard’s background, to the color of lines on a line chart. Ideal for aligning your dashboards with your company’s brand, giving individual dashboards their own identity, or simply giving them a bit of a visual refresh.
Want to customize the look and feel of your dashboards? Get in touch and we’ll get back to you to discuss your needs.
Custom logos
Make your dashboards your own with custom logos, available on our Team plan.
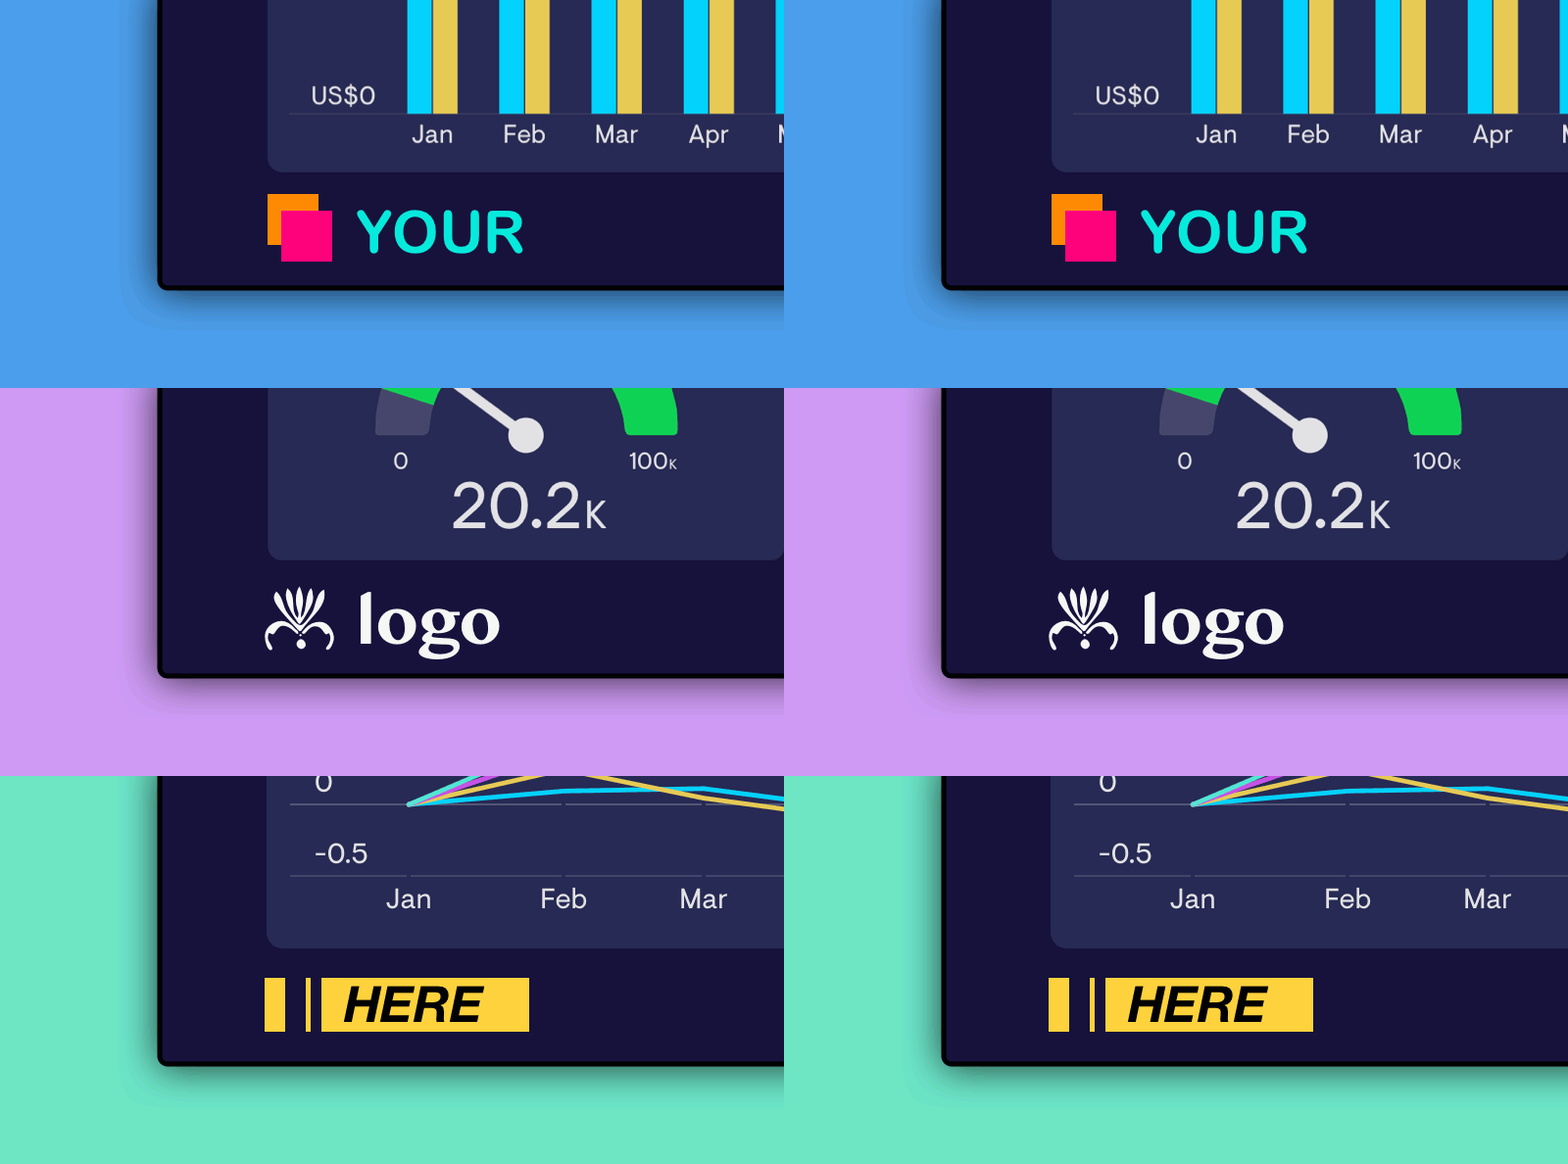
To upload a logo, hit ‘Customize’ on your dashboard, and you can upload a custom image that replaces the Geckoboard branding in the bottom left of your dashboard.
100px minimum height, and <2MB recommended.
Make integration
Geckoboard integrates with a wide range of popular business tools to make it easier to pull key metrics into your dashboard, but we know there are useful data sources out there that we haven’t got covered yet.
To make it easier to get data from those sources into Geckoboard, we’ve integrated with Make - a no-code tool that allows you to fetch data from a [huge range of services](https://www.make.com/en/integrations?community=1&verified=1&utm_source=geckoboard-app&utm_medium=partner&utm_campaig n=geckoboard-app-partner-program), add filters and functions to customise your data, and then send it to Geckoboard using our Datasets API.
Here’s a simple ‘scenario’ in Make that automatically sends data from Airtable to your dashboard, as an example:
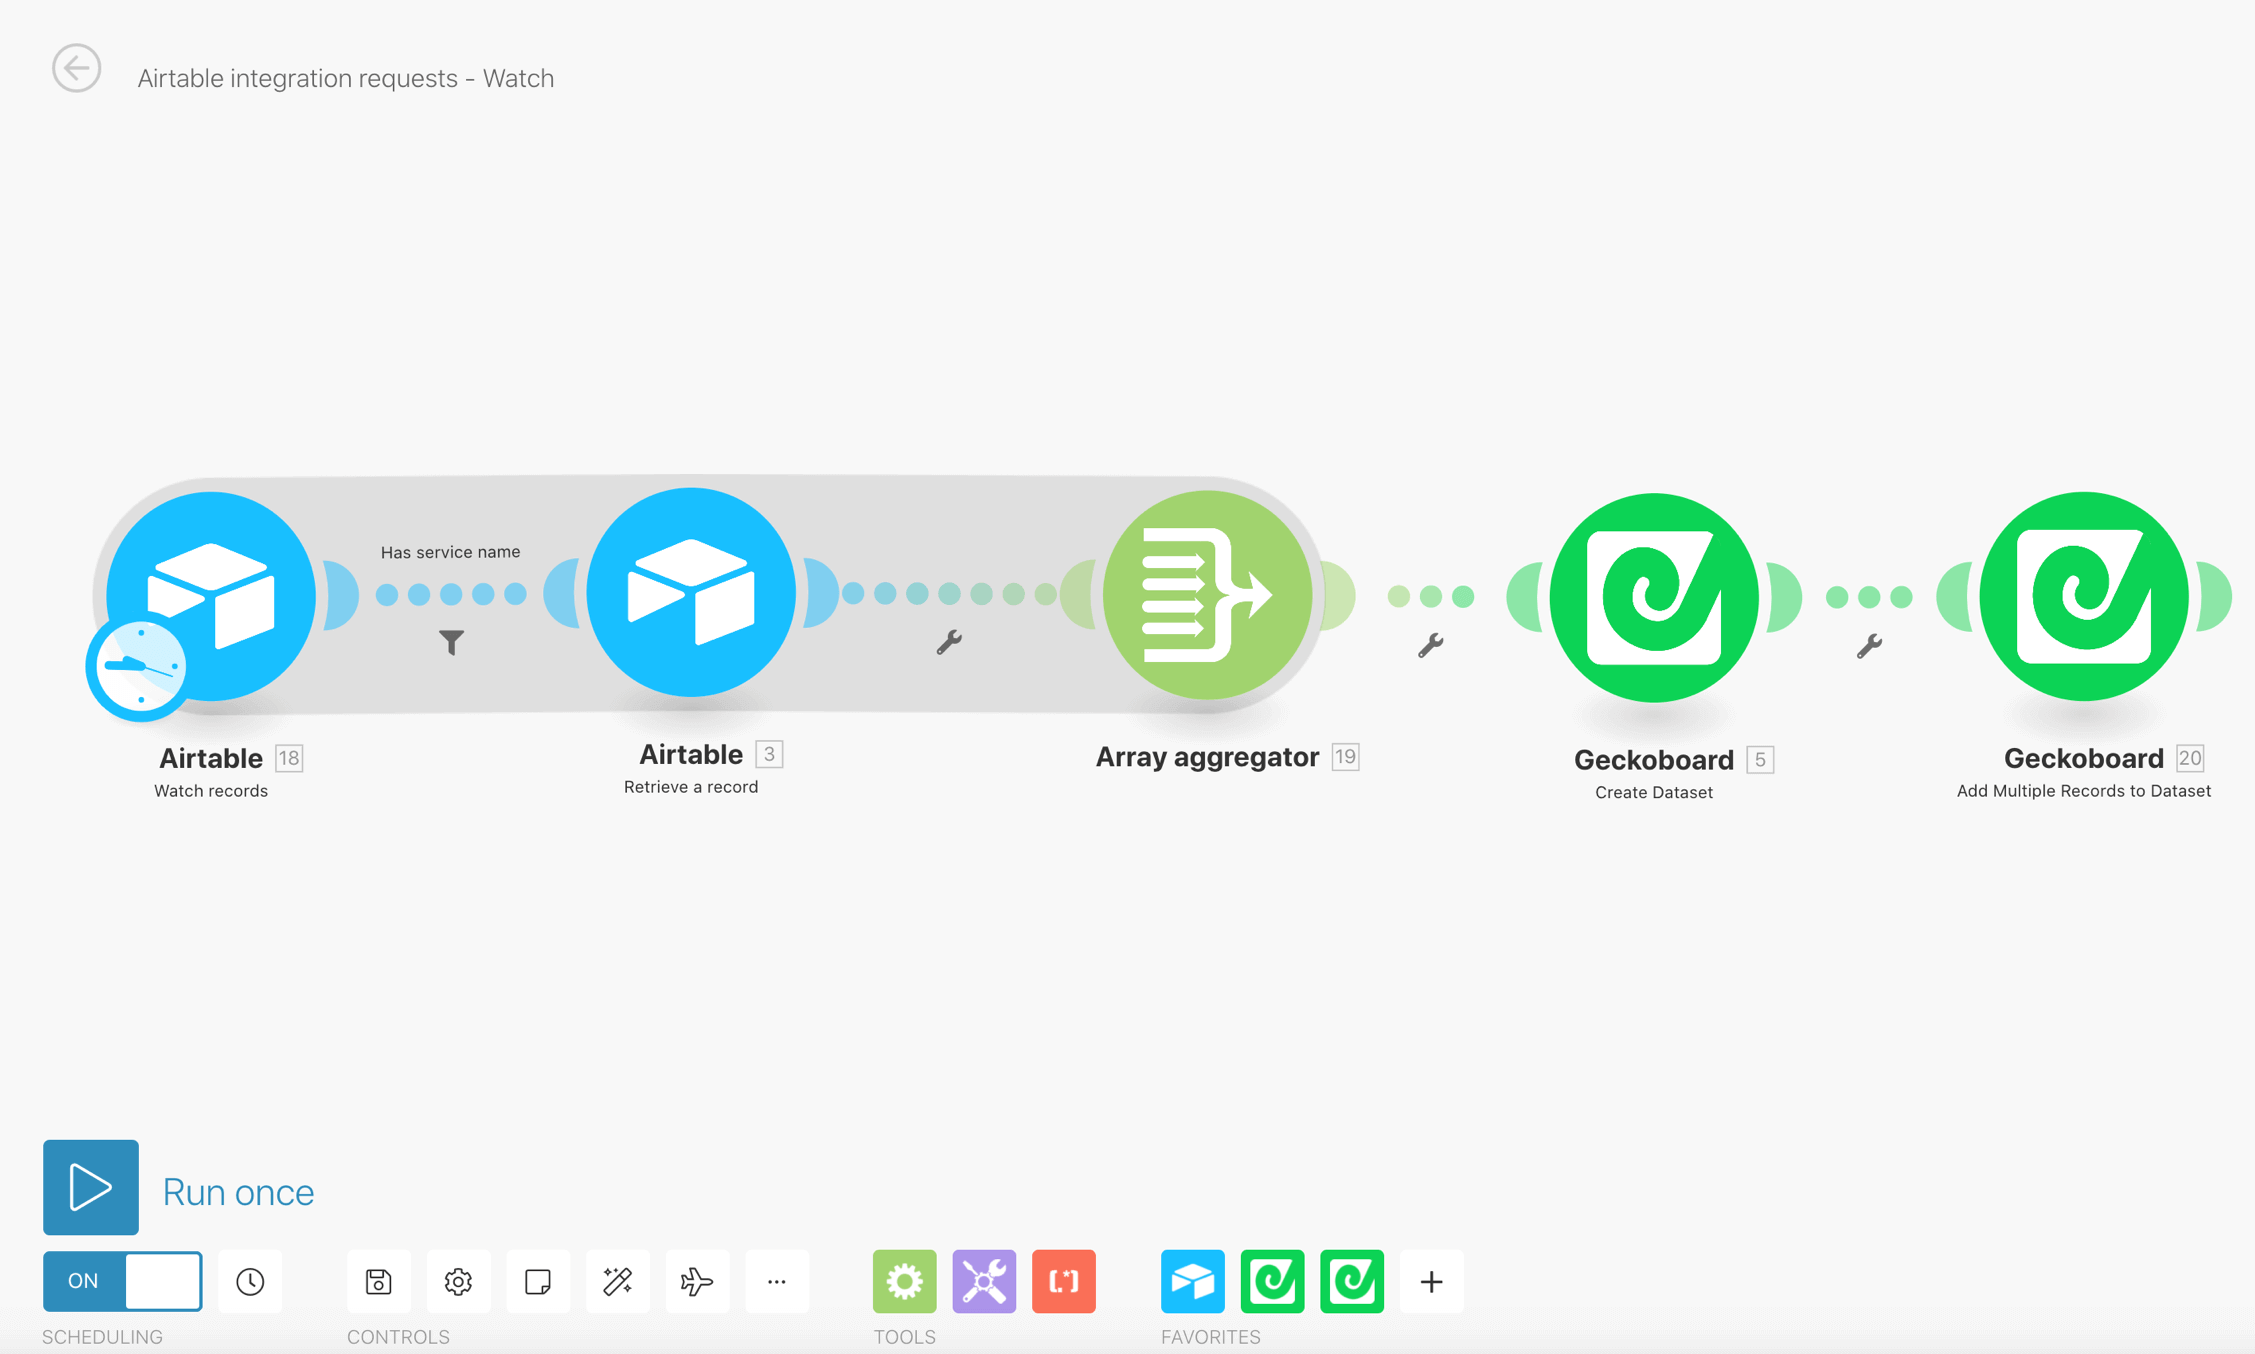
To try this for yourself, [sign up to Integromat](https://www.make.com/en/register?utm_source=geckoboard-app&utm_medium=partner&utm_campaign=geckoboard-app-partner-p rogram), create a scenario, and look for Geckoboard in the list of services (here’s some guidance on how to do this). Alternatively, we can set a custom scenario up for you - get in touch to discuss your use case with our team here.