Activation Rate
What is activation rate?
Activation rate measures the percentage of people who successfully complete a certain milestone in your onboarding process. The milestone can be any event that increases the odds that the user will come back and continue using the product.
Typically, the event milestone is something that occurs in the onboarding process, or early on in a user’s experience with the application.
This milestone will differ from company to company, depending on your product and your business goals. A social platform might track the percentage of users who add their first friend. A music-streaming application might look at how many users create their first playlist.
When choosing an activation milestone, look for an event that, when users complete it, often leads to them becoming a paying or highly engaged customer.
How to calculate activation rate
[No. users who complete the set milestone / Total no. users who signed up] × 100 = Activation rate (%)
Calculating your activation rate is straightforward as long as you know what milestone you’re tracking. Divide the number of users who completed that activity by the total number of users who signed up for your product.
Product and website analytics tools like Google Analytics and Mixpanel offer easy ways to monitor how many people are completing your set milestone.
You might compare your Activation Rate to industry benchmarks. Use caution and judgement when comparing yourself to any industry benchmark – context is key, especially with a metric like Activation Rate which differs greatly from business to business.
We highly recommend this piece of research conducted by Lenny Rachitsky and Yuriy Timen. It not only proposes industry benchmarks for Activation Rate by company type, but also provides a wealth of anecdotal responses from business leaders. These range from how they chose their activation milestone, to tactics they have used to improve Activation Rate.
Why tracking activation rate is critical
Your activation rate helps measure the success of your onboarding efforts. If your activation rate is low, it could indicate that your onboarding process is difficult or confusing, and users are quitting before completing key milestones. Say your activation rate is 25%. That means 3/4 of your people signing up for your product are quitting somewhere in the onboarding process, which presents a significant opportunity for improvement.
A consistently poor activation rate might also mean your marketing and sales efforts are attracting low-quality leads. Having high numbers of initial sign-ups is less beneficial if many of them back out before completing onboarding because they realize the product is not right for them. If this is the case, consider adjusting your sales and marketing messaging to ensure that you’re appealing to the right audience.
If you know your activation rate is low, dig deeper into the data to see why, and then fix the underlying problem. For example, product-growth platform Appcues saw their activation rate was low and used Mixpanel to identify that most users were dropping out after going through the welcome process, but before creating their first flow. By simplifying the onboarding flow and removing unnecessary steps, Appcues more than doubled the number of users completing the activation milestone.
Activation rate can also act as a proxy metric for sign up to subscriber conversion rate. If you typically have a long lead time between when someone starts to use the product and when they become a paid customer, activation rate can be a good predictor of conversion.
4 metrics to track alongside activation rate
While activation rate offers valuable information about your customers’ initial experience with your product, it can’t tell you everything. It doesn’t indicate how many users come back to the product after activating or whether those users go on to become paying customers.
Here are a few metrics to track alongside activation rate to get a better picture of the value users get from your product:
- Customer churn rate: Calculates the percentage of customers lost during a given period. Churn rate looks at customers lost even after they’re onboarded.
- Daily active users (DAU): Measures the number of people who interact with your application on a daily basis. This helps you see how many of your customers come back to use the product regularly, without focusing on a single, specific type of interaction.
- Daily active users (DAU) to monthly active users (MAU) ratio: Shows you how many of your monthly active users interact with your application during a 24-hour period. This metrics adds context to DAU and helps measure product stickiness.
- Sign up to subscriber conversion rate: The percentage of users who become paid subscribers after signing up for a free trial of your product. This helps you gauge how valuable free trial users find your product and their likelihood of converting once the trial ends.
Keep activation rate and other vital startup metrics top of mind by displaying them on your data dashboard. Check out this startup CEO dashboard for inspiration:
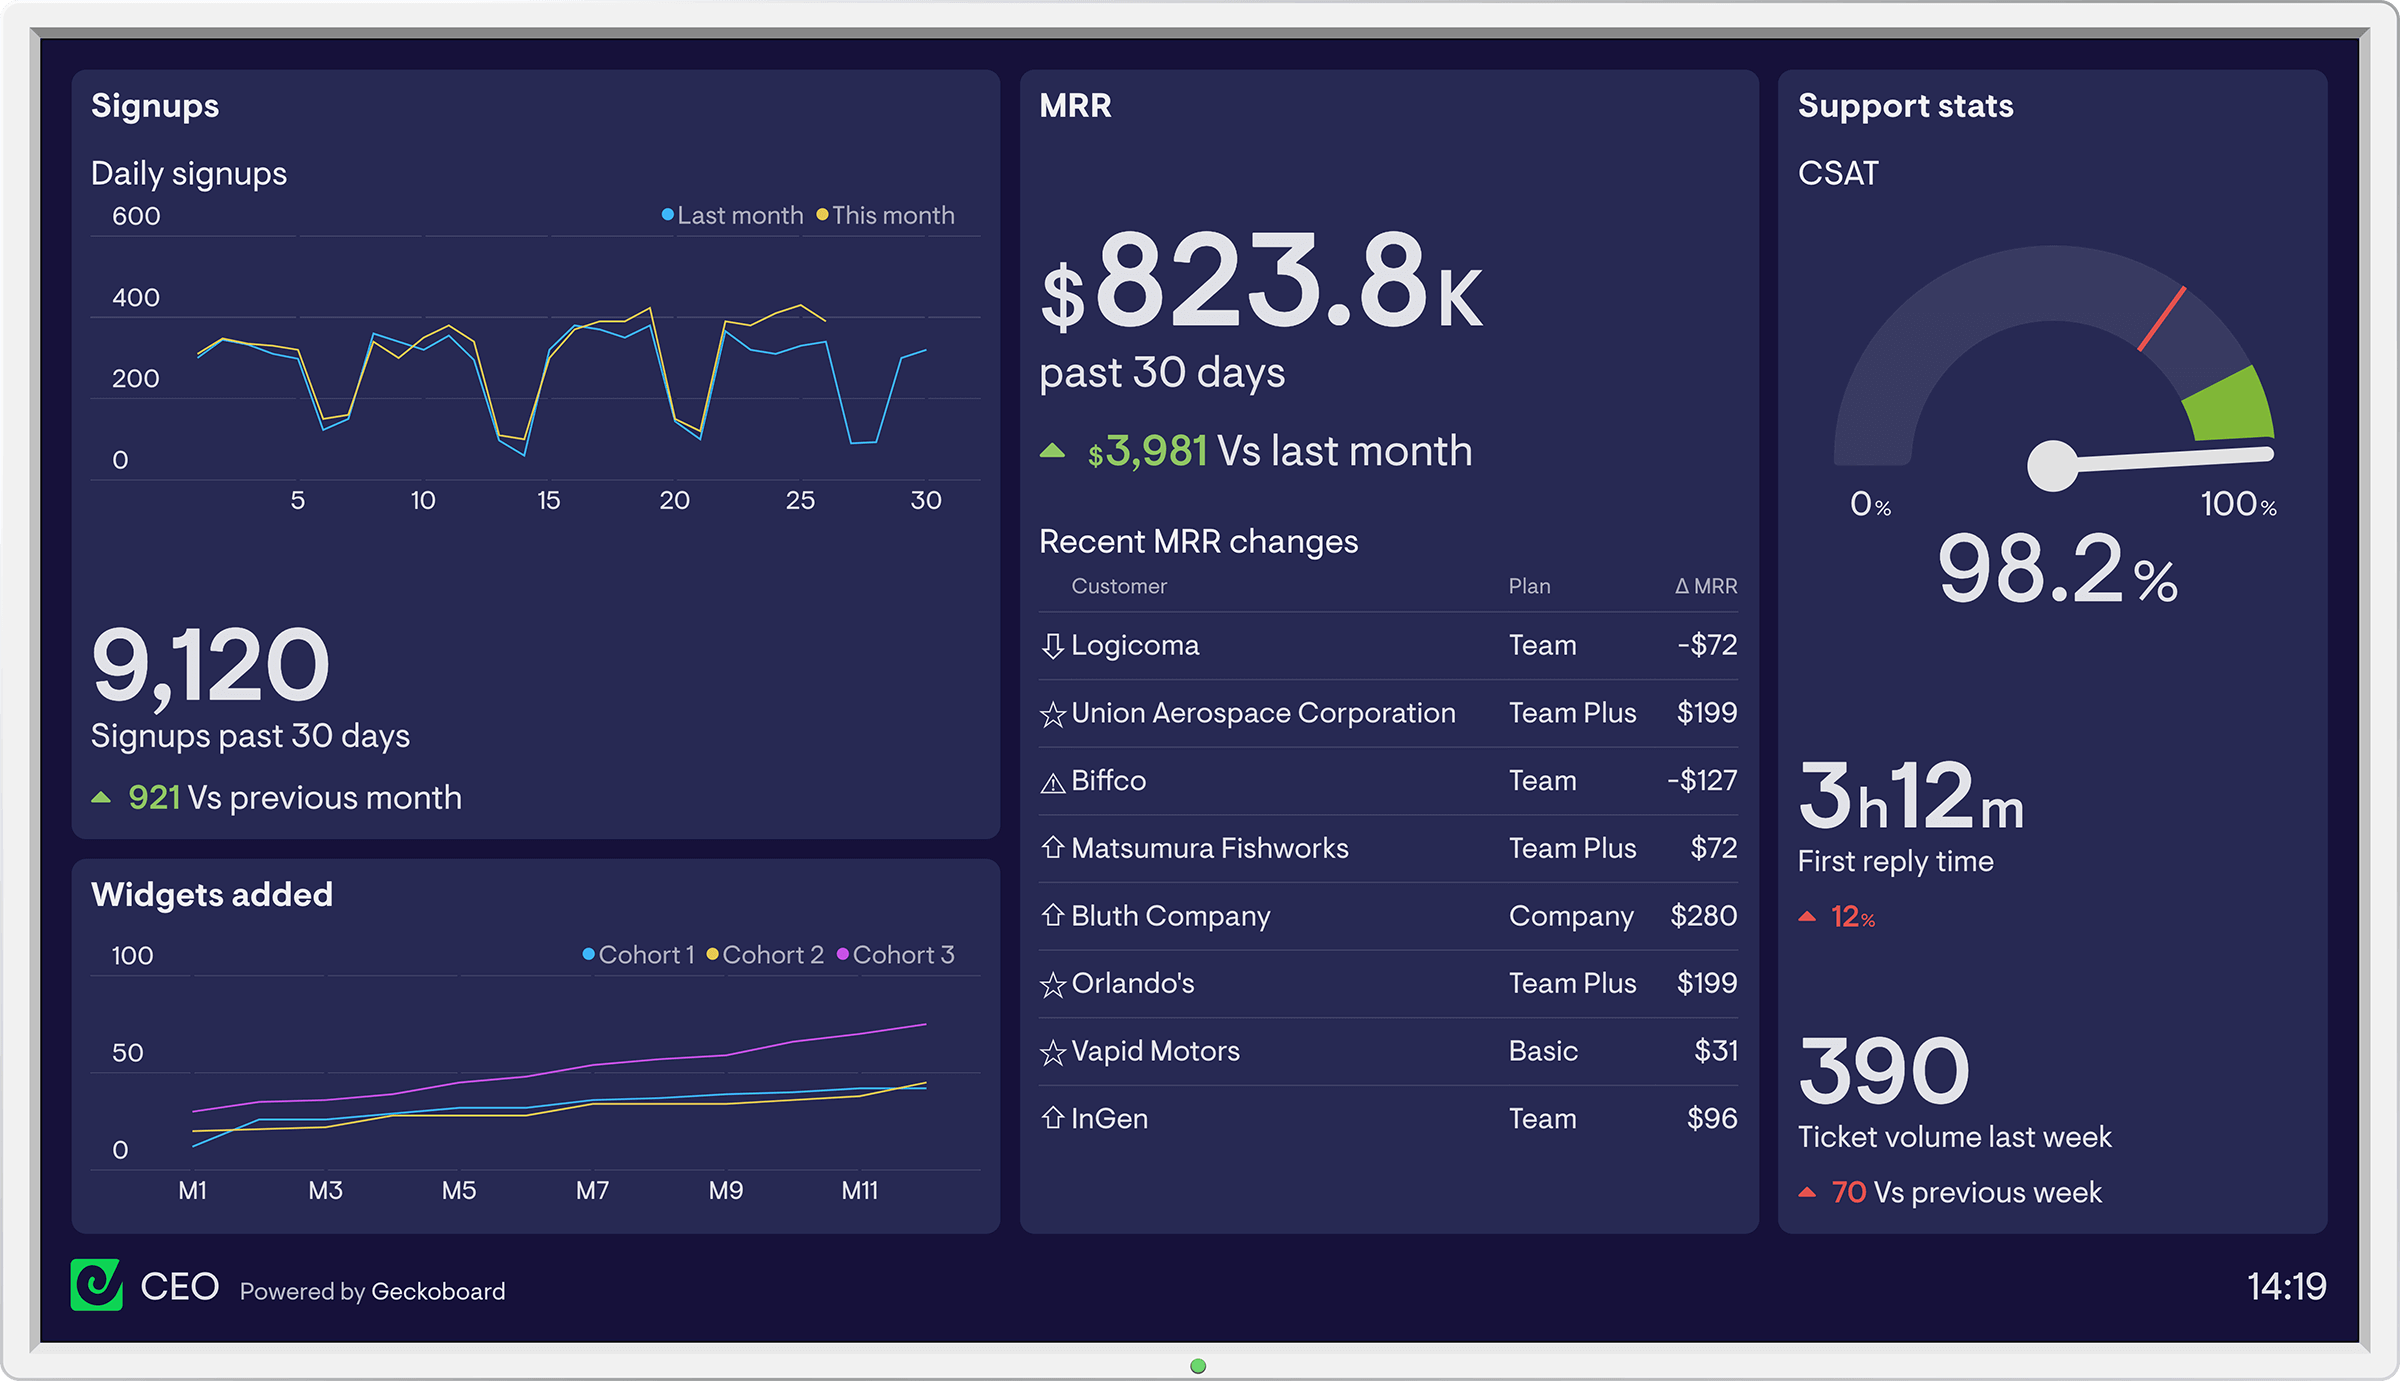 Contains sample data