Customer Churn Rate
What is customer churn rate?
Customer churn rate is the percentage of customers lost during a given period of time. For SaaS or mobile apps, that means customers who cancel their subscription. For ecommerce, that means customers who fail to make a repeat purchase within a time frame established by the business, such as 90 or 120 days.
Typically, churn rate includes only paying customers. For SaaS companies, that would mean excluding trial customers from your calculations.
Customer churn rate looks at numbers of customers lost, not the amount of revenue lost. To track revenue loss you would need to look at MRR churn.
The inverse of customer churn is customer retention rate, which focuses on the customers retained over a given period of time.
How to calculate churn rate:
[ (#) Total customers churned this time period / (#) Total customers at the start of this time period ] X 100 = (%) Customer Churn Rate
Calculate customer churn rate by dividing the total customers churned over a specified period (such as 30 or 90 days) by the total customers at the start of the period. Multiply that by 100 to generate a percentage. The time frame might depend on your industry and the length of your sales cycle, though many businesses calculate monthly churn rates.
For example, if the total customers lost in August was 150, and the total number of customers at the start of the month was 5,000, then the customer churn rate would be 3%:
[ 150 customers churned in August / 5000 customers as of August 1st ] X 100 = 3%
Another way to calculate churn rate is by cohort. A cohort is a group of customers who all signed on with your company at the same time. Tracking cohort churn rate helps you see how long people are using your product before churning. Monthly churn rate tells you how many customers you lost in a particular month but not when each one signed on with your company.
The formula for calculating churn rate by cohort is very similar to the monthly version:
[ (#) Total customers churned from cohort / (#) Total customers in cohort from specified time period ] X 100 = (%) Customer Churn Rate
There are also free third-party tools that can help you calculate churn rate, like HubSpot’s customer service metrics calculator. Using these tools, you can quickly calculate churn rate by plugging in your numbers. Some, like HubSpot’s tool, help you calculate more complex metrics, such as revenue churn.
Why tracking customer churn rate is critical
Regularly watching churn rate can help you quickly make adjustments to your retention strategies. High churn makes it difficult for a company to grow. Being proactive about customer satisfaction can help you sustain or even bolster company growth.
Monitoring churn helps you track how satisfied customers are with your product or service. If high numbers of customers leave after trying your product, you may have issues with usability, customer service, price or product fit. A high churn rate, or one that is growing month over month (MOM), indicates that you need to revisit your customer retention strategies.
Track churn rate on a regular basis to watch for fluctuations. In general, your churn rate should be steady. Dramatic changes may indicate a problem or a need for closer investigation into why customers are leaving.
Tracking churn rates by cohort can offer additional insight into the factors behind lost customers. If you noticed a sharp rise in churn in the first group to receive a new feature, for example, you might want to specifically ask those customers about their experience with the feature.
What is a good churn rate for SaaS businesses?
Average customer churn rate can vary widely by business stage (early versus mid versus late). But you can look at industry and company averages to get a basis for comparison.
Baremetrics found an average churn rate of 7.5% across their SaaS customers. If you look at a detailed view by customer, you’ll see that the rate varies widely across different price points and company revenue levels.
Baremetrics detailed company view
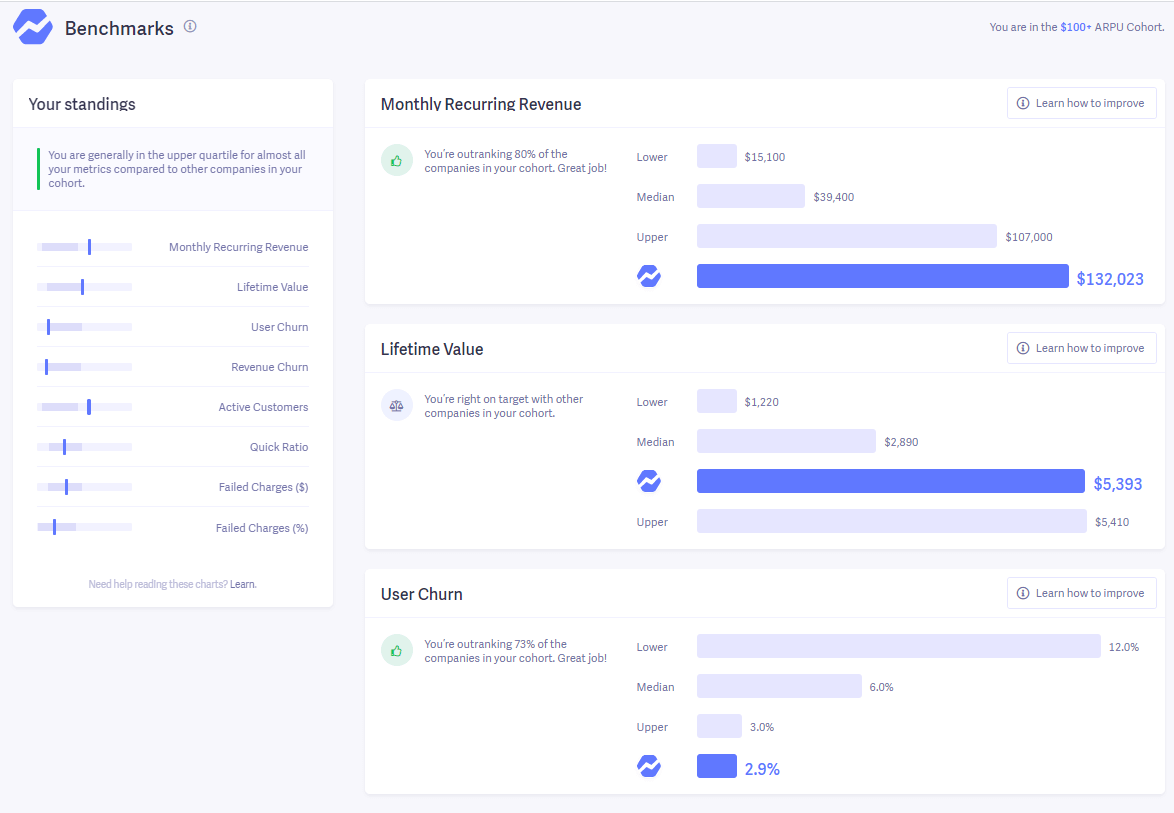
In addition to industry averages, look at churn rates for companies in your revenue bracket. An acceptable churn rate for a large business may not be good for a small business. For example, project management tool Scrumpy has an average MRR of $914 and sees an average monthly churn of 2.9%. ConvertKit, an email marketing company, sees over $2 million MRR and has a churn rate of 4.9%.
Churn rate is also affected by price and sales cycle length. Even product type affects churn because it’s easier to switch to alternatives for some products than for others.
It’s essential to track your churn rate over time to get a feel for what “high churn rate” looks like for your company.
“It goes without saying that less churn is always better, but estimating an upper-bound for churn can be helpful for financial modeling and internal prioritization of customer success efforts,” says Tom Tunguz, partner at Redpoint Ventures.
If you find your churn rate is consistently higher than average, survey churning customers to find out why they’re leaving. If possible, get them on a call so you can more easily ask follow-up questions. Patterns in their responses will give you an idea of where to start making changes to reduce churn rate in the future.
9 metrics to track alongside churn rate
Your churn rate alone doesn’t give you the full picture. It tells you what is happening, but not the root cause. Churn rate can’t tell you why your customers are leaving or what you need to do to keep your customers. Both of these are critical pieces of information you need to reduce churn rate in the future.
Churn rate also doesn’t tell you about overall growth rate or revenue. It only shows you how many customers you’re losing. To get a broader view of company health, you also need to look at new customers and upsells within the same period.
Track other metrics alongside customer churn rate to get a more complete picture of company health:
- Gross MRR Churn: Looks at revenue lost from churning customers. It helps you determine whether you’re losing high-value customers or whether most of your churn comes from small accounts.
- Net MRR Churn: Illustrates overall revenue changes from existing customers by accounting for new revenue from upgrades or expansions.
- Net Change in Customers: Takes both new and churning customers into account to show you whether your customer base is growing as a whole.
- Revenue Growth Rate: Shows how much your revenue is growing MOM and gives you an idea of how churn is affecting company growth.
- Activation Rate: Tracks whether new users are completing an initial important step in your product. A low activation rate may indicate that the functionality of your app is one reason customers are churning, or that it is missing capabilities they expected it to have.
- DAU/MAU Ratio: Measures how often people are using your product, which is another indicator of customer satisfaction.
- Net Promoter Score (NPS): Indicates whether people are likely to recommend your product to others. Along with churn rate, NPS helps gauge overall customer satisfaction.
- Customer Satisfaction Score (CSAT): Shows how happy people are with your customer service, usually based on survey responses. CSAT can help you determine whether high churn is due to customer support issues.
- Customer lifetime value (LTV): Shows you how much revenue customers bring in during their time with your company. This can help you determine if a high churn rate is impacting your ability to make up your initial customer acquisition cost.
Recurring revenue metrics, such as net MRR churn and gross MRR churn, are particularly important for SaaS and other subscription-based companies. These metrics will help you see the broader impact of churning customers on your company’s bottom line.
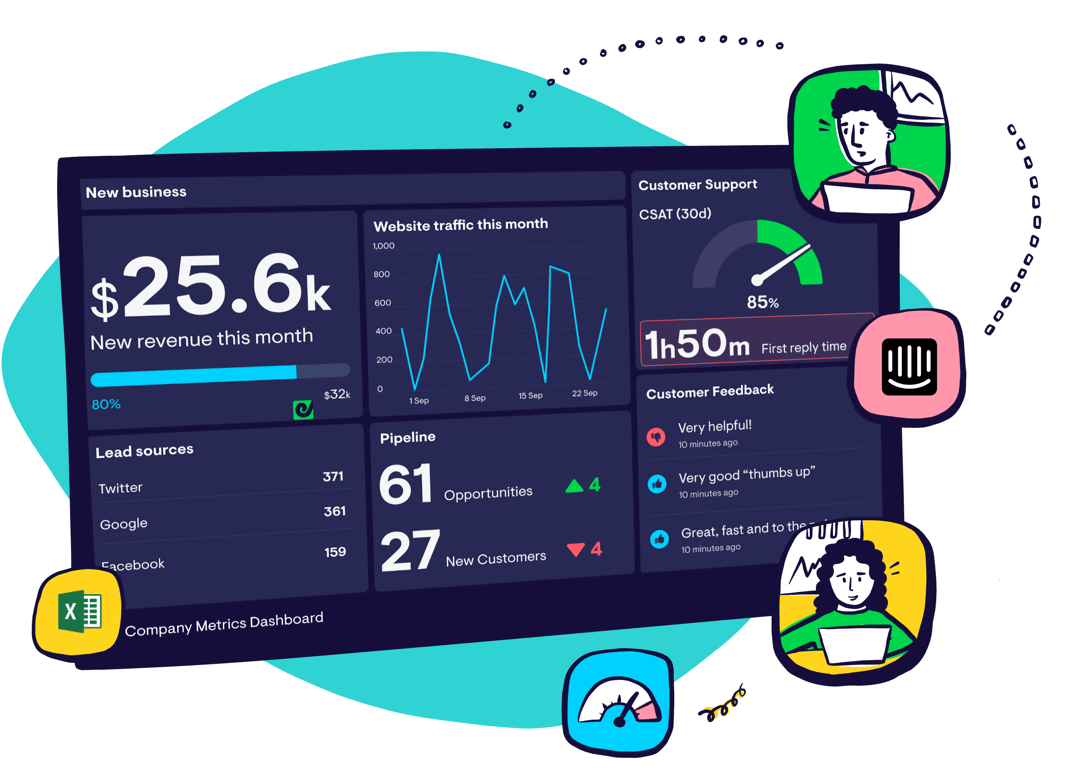
Add customer churn rate to your CEO dashboard
Churn rate is a vital metric for assessing your customer service and your retention strategies. Tracking it will help you detect dramatic fluctuations early on and address problems as quickly as possible.
Add churn rate to your support team’s data dashboard to keep it top of mind. Display the dashboard in the office, or post it in Slack so team members can monitor changes in real time. Include other revenue and customer satisfaction metrics, such as net MRR churn. That way, you can get a quick picture of your company’s overall health.
Looking for ideas of what to add to your dashboard? Check out this example CEO Metric Dashboard.