Average Order Value
What is Average Order Value?
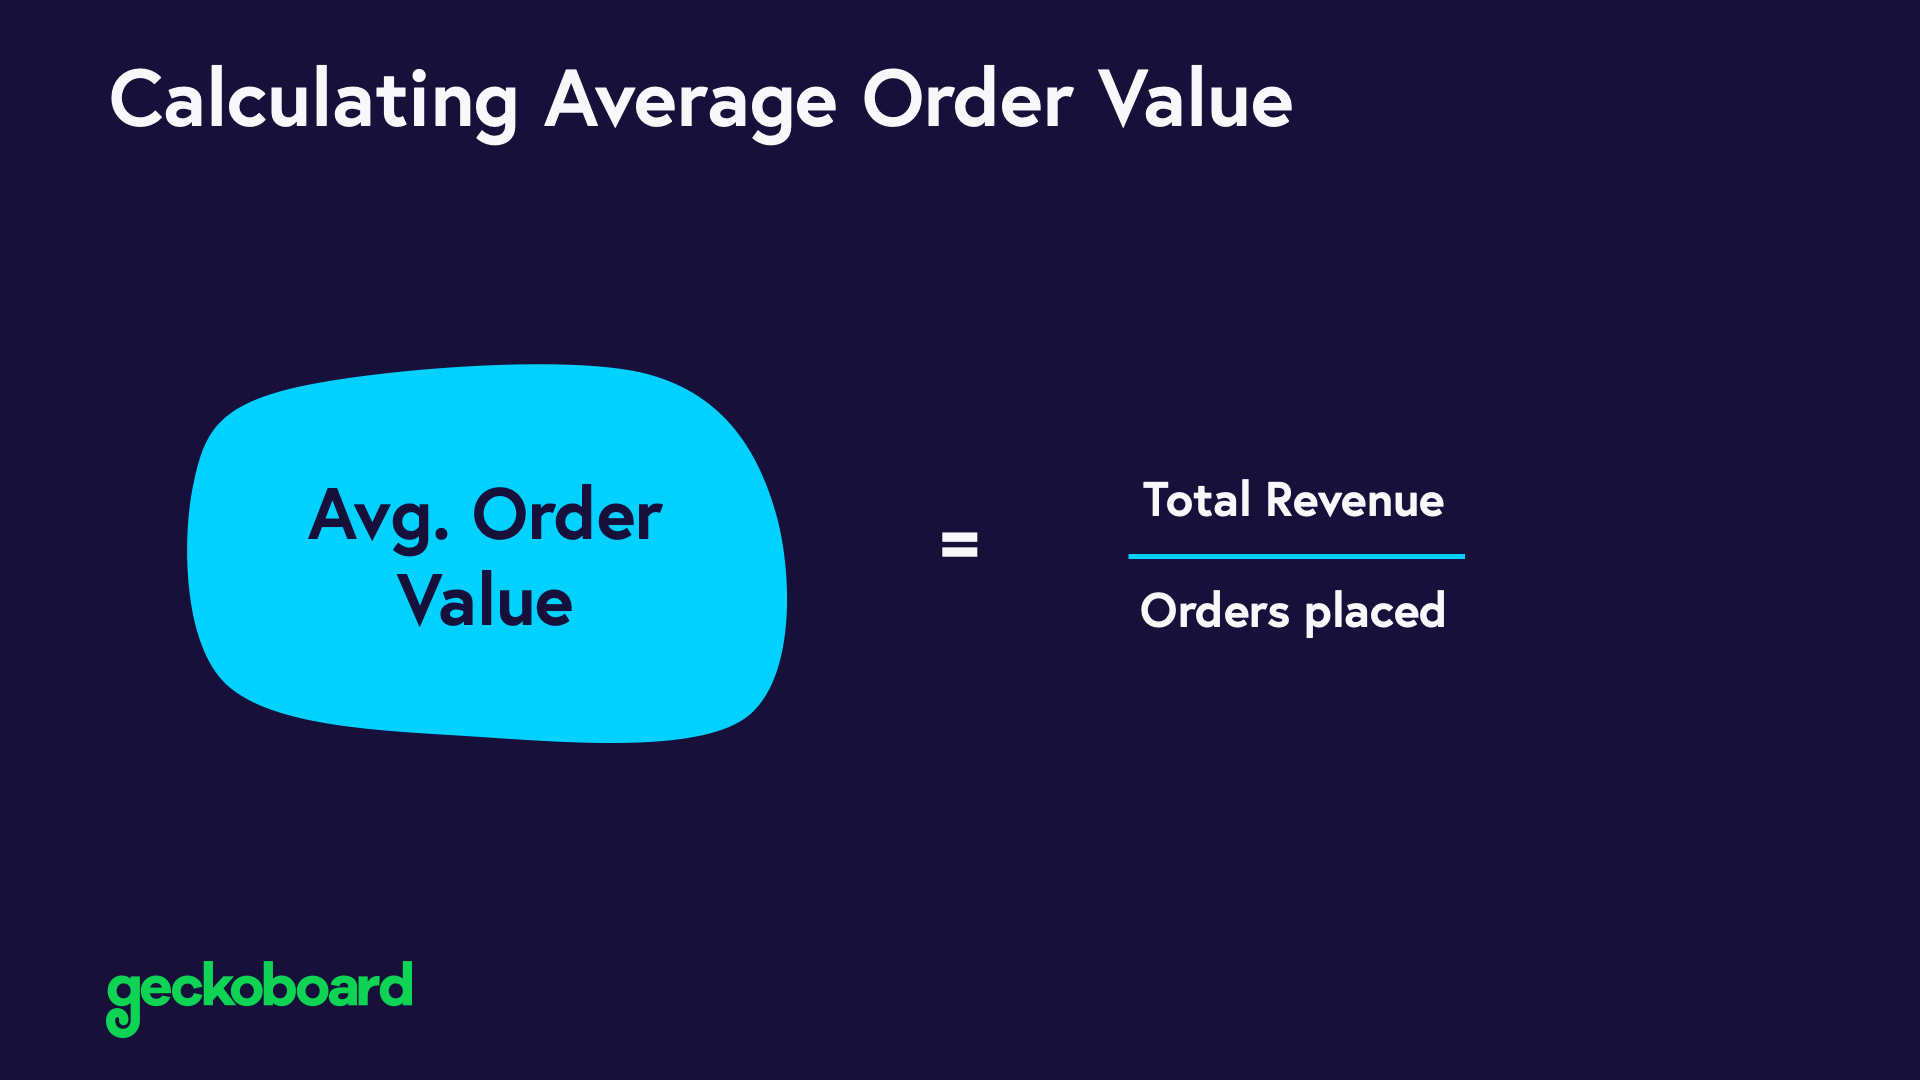
The ecommerce metric Average Order Value (AOV) is the average dollar amount customers spend when they make a purchase from your website. This metric helps online retailers understand customer purchasing behavior.
Advice from Ecommerce Experts: Why Average Order Value is critical
“An increase in the average order value for an online retailer has a strong correlation to an increase in profit. When an ecommerce retailer can sell more on each order, that retailer tends to make more profit overall. Thus, online retailers that are able to increase average order value — AOV — should also become more profitable.” - Armando Roggio, Director of Marketing and Ecommerce at D&B Supply
“Ultimately, average order value boils down to increased profits and continued success for your brand.” - Alex McEachern, Loyalty Marketing Specialist and Ecommerce Enthusiast at Sweet Tooth Rewards
How to calculate Average Order Value:
($) total revenue / (#) orders placed = ($) Average Order Value
The Average Order Value is calculated by dividing the total revenue by the number of orders placed. Often, this metric will be calculated monthly (i.e. total revenue from the month divided by total orders placed that month), but it can also be calculated weekly or even daily.
For example, if your total revenue this week is $4000 from 160 orders, your AOV would be $25.
$4000 / 160 = $25
Pros:
Tracking the Average Order Value is critical for ecommerce businesses to understand and monitor customer purchasing patterns. Increasing AOV is one of the most effective (and usually cheapest) ways to increase revenue since no additional costs are incurred via transactions.
This metric is helpful for calculating your customer lifetime value (LTV) as well as determining the best marketing and pricing strategy.
Cons:
The Average Order Value can be misleading if skewed by a couple of extremely high or extremely low value orders. This is most often encountered when the range of products spans a wide price range.
It’s important to remember that AOV doesn’t show profit unless you use total net profit in place of total revenue.
Relevant Ecommerce Metrics and KPIs:
If you’re adding Average Order Value to your ecommerce dashboard, you might want to also track these related startup metrics for context.
- Customer Acquisition Cost (CAC)
- Gross Profit Margin
- Revenue by Traffic Source
- Shopping Cart Abandonment Rate
Industry Benchmarks
Given the broad range of products available online, the Average Order Value will vary based on the company and product(s). In the United States, most online retailers average about $78 per order.
In order to get a baseline for your company, track your AOV this month compared to a year ago - or even just last month - or find a specific benchmark for your industry / product type.
Research shows that desktop has 20% higher AOV than mobile or tablet AOV.
Additional Notes
AOV can be improved through a variety of tactics including cross-selling (offering complementary products), up-selling (offering a higher-end version of the same product), free shipping with minimum purchase, volume discounts, or coupons.
Want to create a dashboard using this metric? Check out these example Ecommerce Dashboards.