Net Promoter Score (NPS)
What is Net Promoter Score (NPS)?
The Net Promoter Score (NPS) is loyalty metric used in marketing to measure the number of satisfied customers and the average degree of satisfaction. It’s a survey indexed from -100 to 100 that asks the question “On a scale of 0-10, how likely are you to recommend [company] to a friend or colleague?” The NPS score serves as a leading indicator to the viral coefficient and word-of-mouth growth.
How to calculate Net Promoter Score:
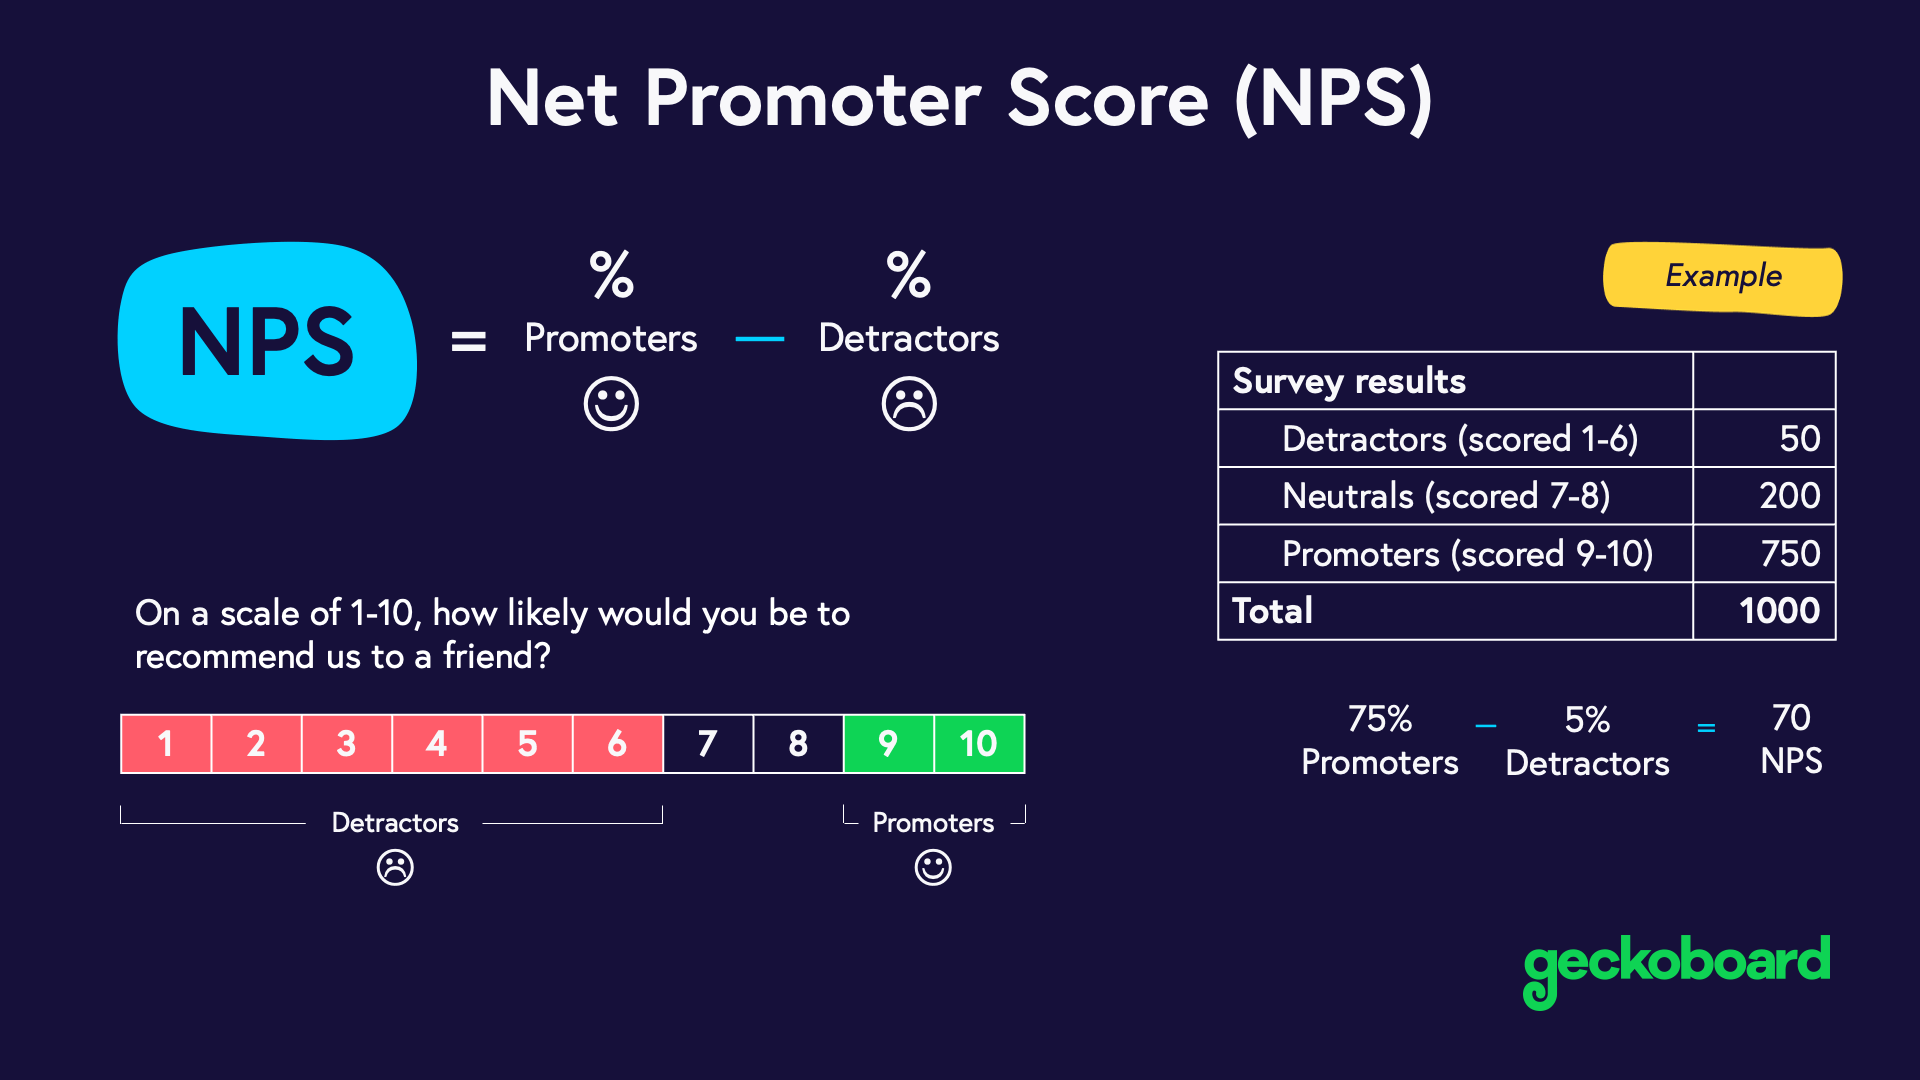
[ (#) promoters - (#) detractors ] / (#) total respondents X 100 = (#) Net Promoter Score
The Net Promoter Score classifies respondents who selected any number between 0-6 as a detractor. Respondents who selected 7 or 8 are considered passives and respondents who selected 9 or 10 are considered promoters.
You can calculate your NPS score by subtracting the number of detractors from the number of promoters, divide by the total number of respondents and then multiply by 100. (Note: Although the NPS score is technically a percentage, it is always shown as an integer.)
Pros:
Truly satisfied customers (promoters - those who select 9 or 10 on the survey) will refer their friends and colleagues, so the greater number of satisfied customers, the higher your growth will be. Research has shown that in most industries the Net Promoter Score accounted for 20-60% of growth. Also, the NPS score is a valuable metric because it’s quantifiable and standardized (leading brands across industries use it).
Breaking down respondents by promoter, passive, or detractor gives you the opportunity to follow up with dissatisfied or passive customers and find out why they’re not promoters. It also helps you weed out the personas who may not be a good fit.
Cons:
Using the NPS survey is a more traditional approach for measuring customer satisfaction and obviously, relies on customers taking the time to respond. This means you’ll inevitably lack data from some customers who won’t respond for one reason or another. Some experts suggest that your most dissatisfied customer will not respond to NPS surveys, which can give false results.
Relevant Marketing Metrics and KPIs:
If you’re adding Net Promoter Score to your marketing dashboard, you might want to also consider tracking these related marketing metrics for context.
- Viral Coefficient
- LTV:CAC
- Monthly Revenue Growth
Industry Benchmarks
Since the Net Promoter Score is standardized, a plethora of NPS benchmarks exist in nearly every industry. In general, leading brands rank more than double their competitors. Looking at external NPS benchmarks (other companies in your same industry) can be helpful to a certain extent, but due to the wide array of variables, sometimes setting internal benchmarks by regularly sending NPS surveys can be more actionable and insightful.
In 2016, the average NPS benchmark was 45 for brokerage/investment companies, 28 for software and apps, 23 for online shopping and entertainment businesses, and just 16 for travel websites.
| Industry | Estimated 2016 Benchmarks for Average NPS |
|---|---|
| Brokerage/Investments | 45 |
| Software and Apps | 28 |
| Online Shopping | 23 |
| Online Entertainment | 23 |
| Travel Websites | 16 |
Additional Notes:
The viral coefficient and the net promoter score (NPS) are related, but they function differently. NPS score tracks the number of satisfied customers who are likely to recommend your product or service. In contrast, the viral coefficient measures the number of customers actually recommending or inviting people to use your product or service. As such, NPS is more of a leading indicator than viral coefficient.