Pirate metrics (AARRR) dashboard examples
A Pirate Metrics dashboard tracks the five stages of business growth — Acquisition, Activation, Retention, Referral, and Revenue (AARRR) — in one view. It keeps the whole team focused on the levers that actually drive growth, not just the metrics that are easiest to measure.
Pirate Metrics (AARRR) dashboard
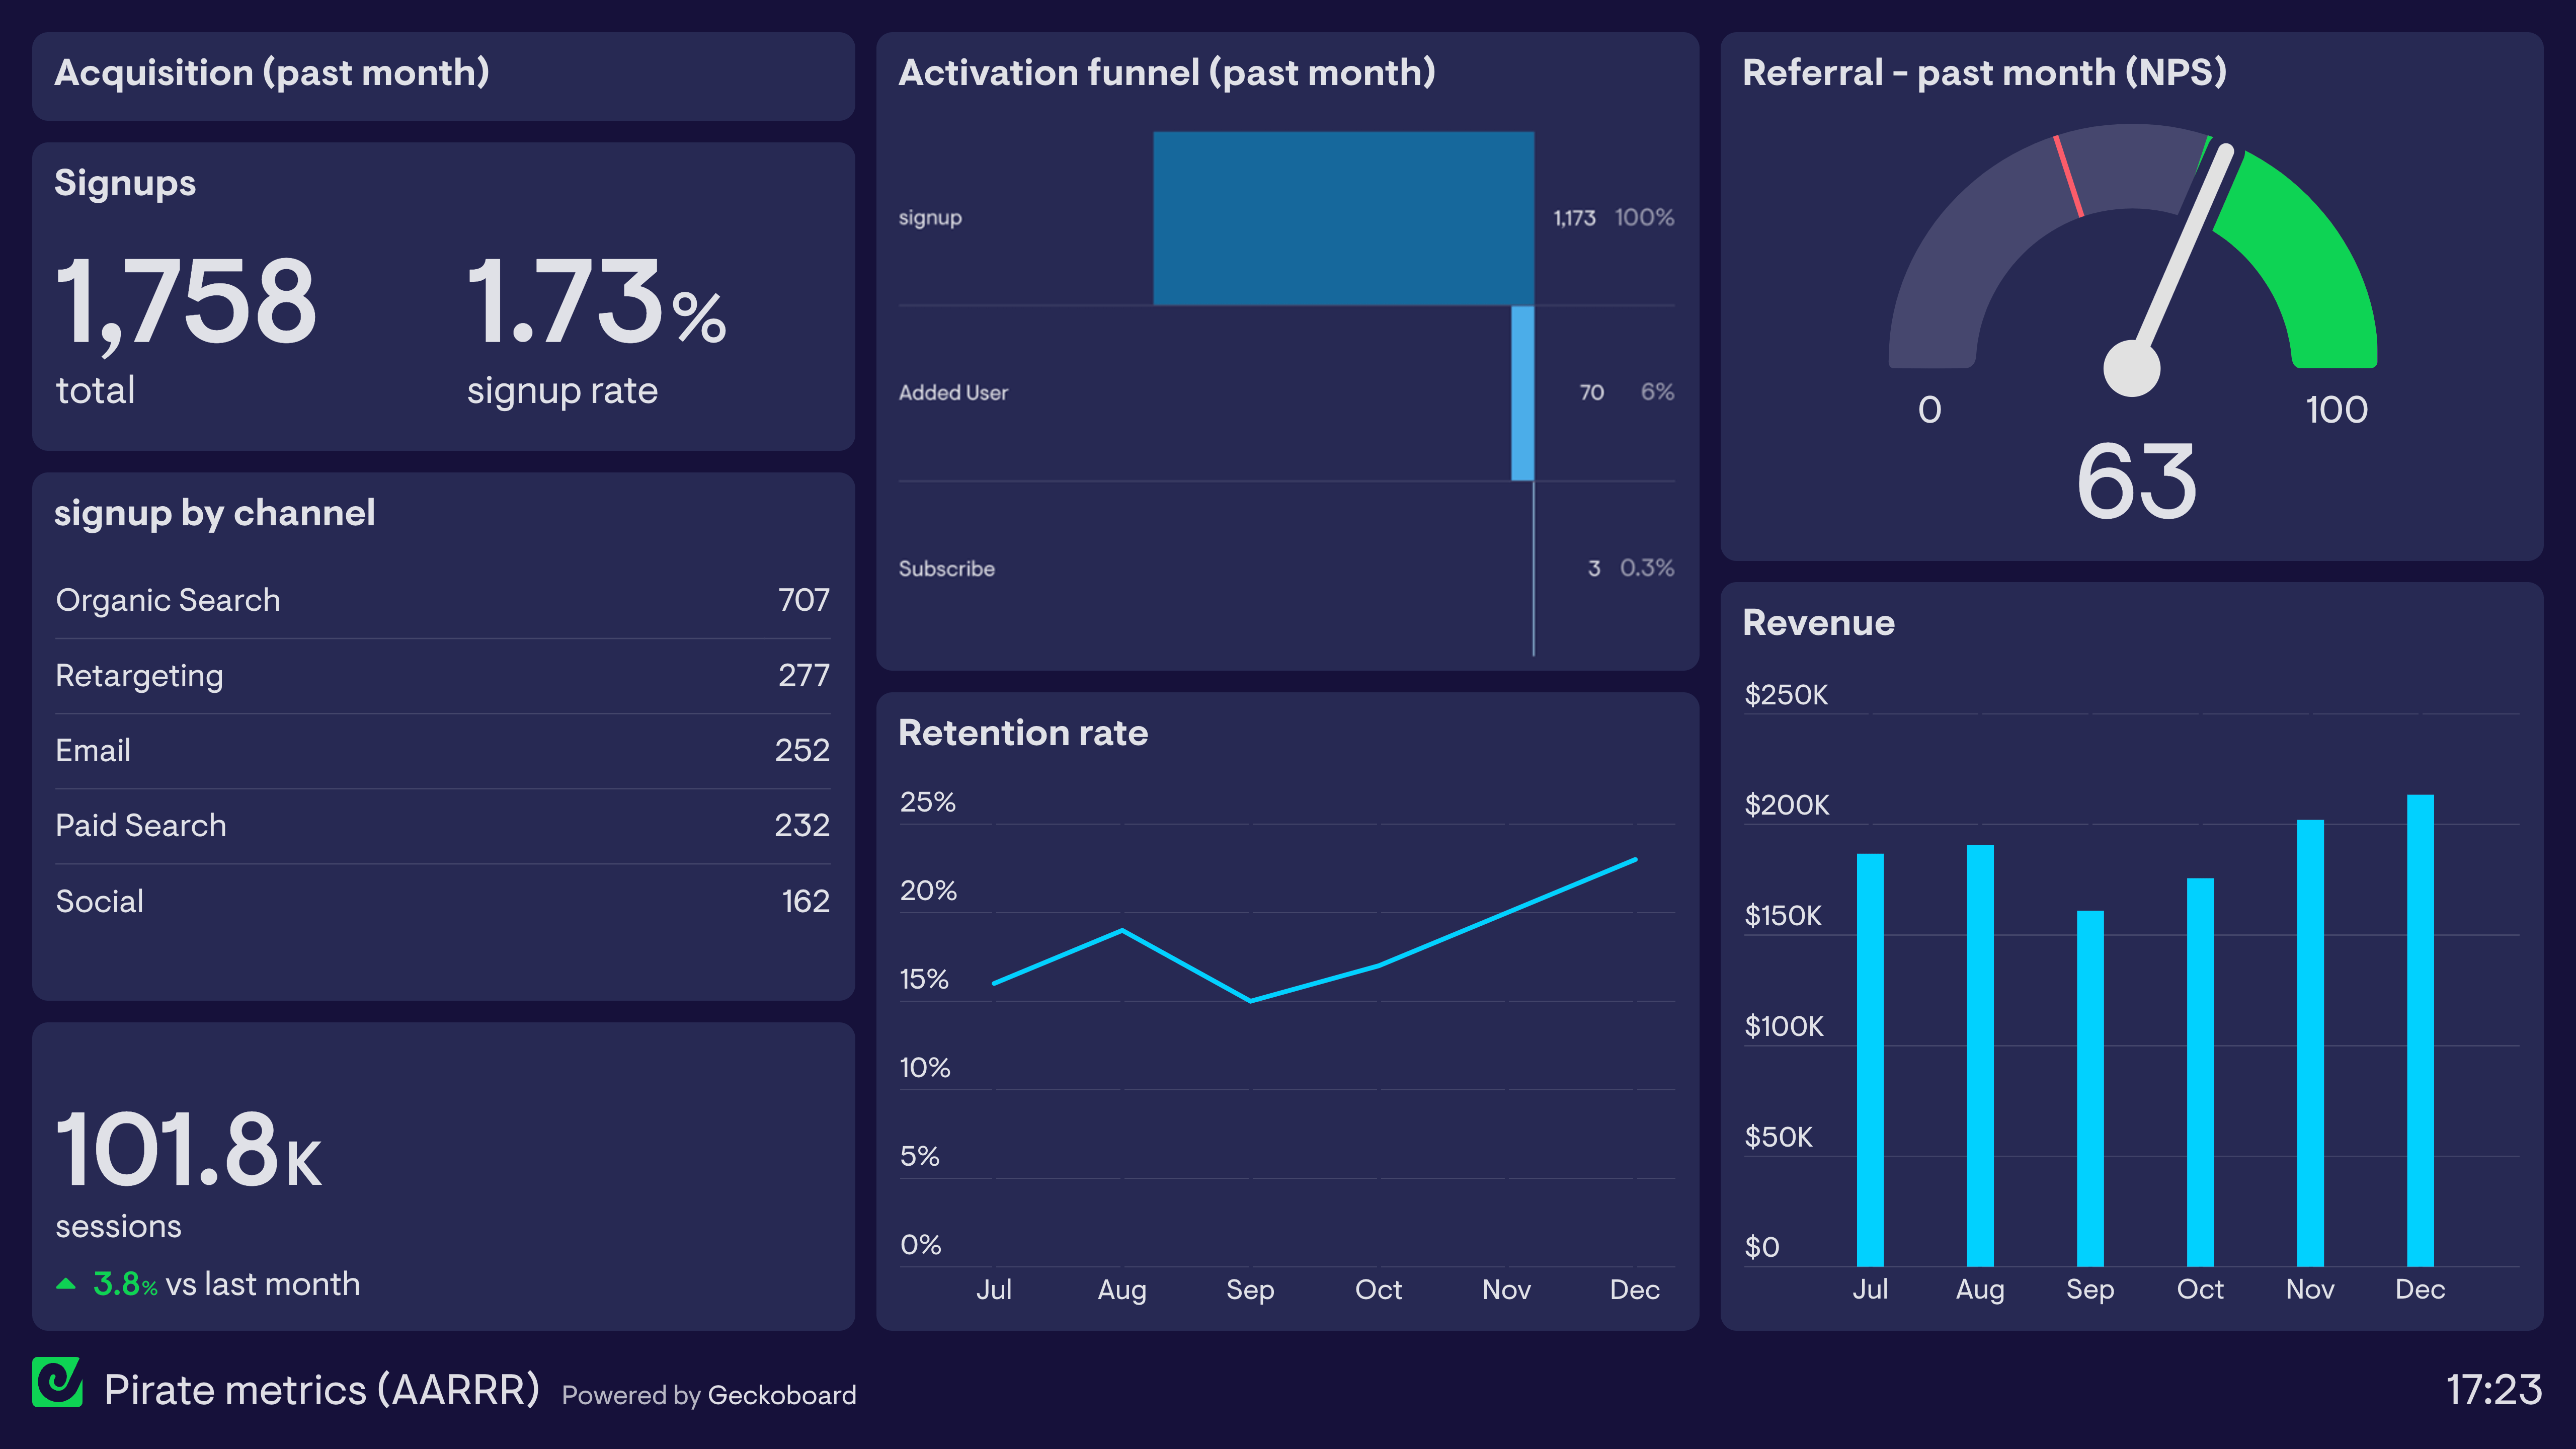
Here we see how Pirate Metrics can be tracked using a single dashboard. There are of course many ways one could to track the different areas or AARRR, and some companies will even use multiple metrics to track each area.
In this example, the acquisition section focuses on the number of signups, signup rate, signups via digital channel, and the total number of web sessions. In the center of the dashboard, the team is tracking activation via a funnel, (i.e. how many people who signed up went on to use the product and subscribe?) Below this, retention rate is measuring the number of trialists who are using the product two weeks after the free trial begins.
On the right hand side, they are measuring referral via a Net Promoter Score (NPS); this is a survey-based metric that measures how likely your customers are to refer your business to a colleague or a friend. Finally, revenue is measured, monthly, in the bottom right hand corner.
Browse other popular examples
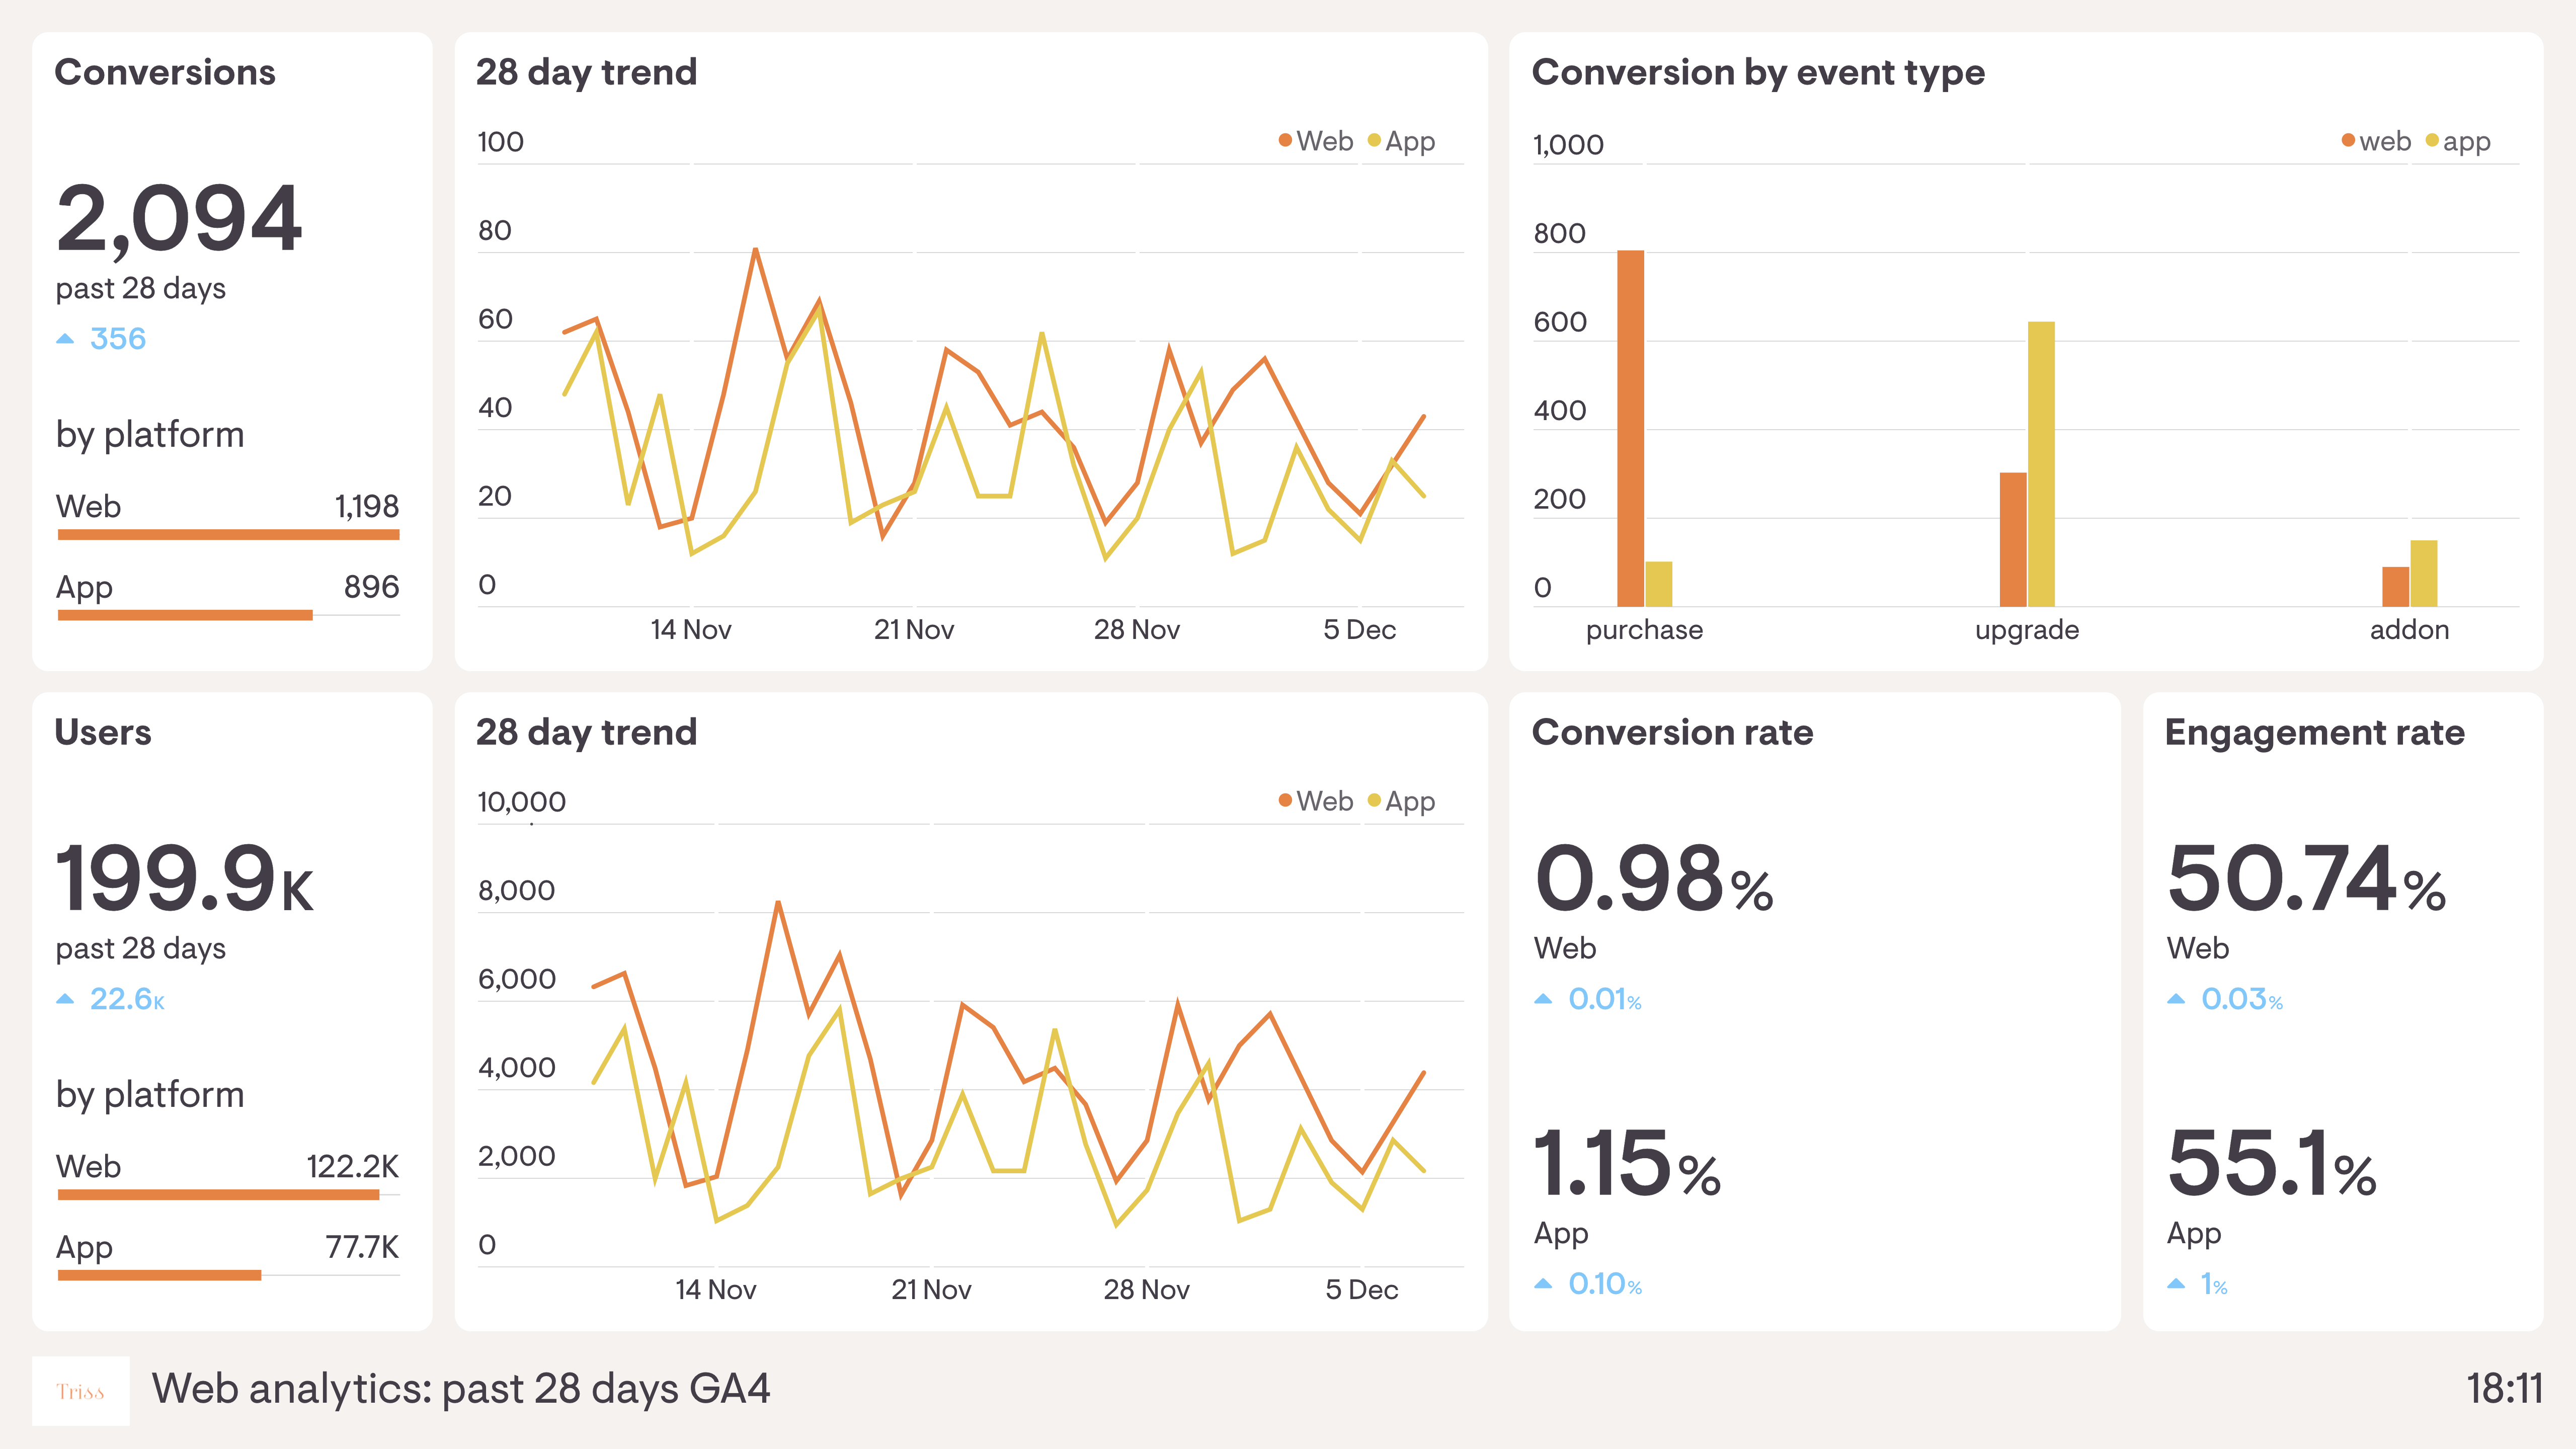
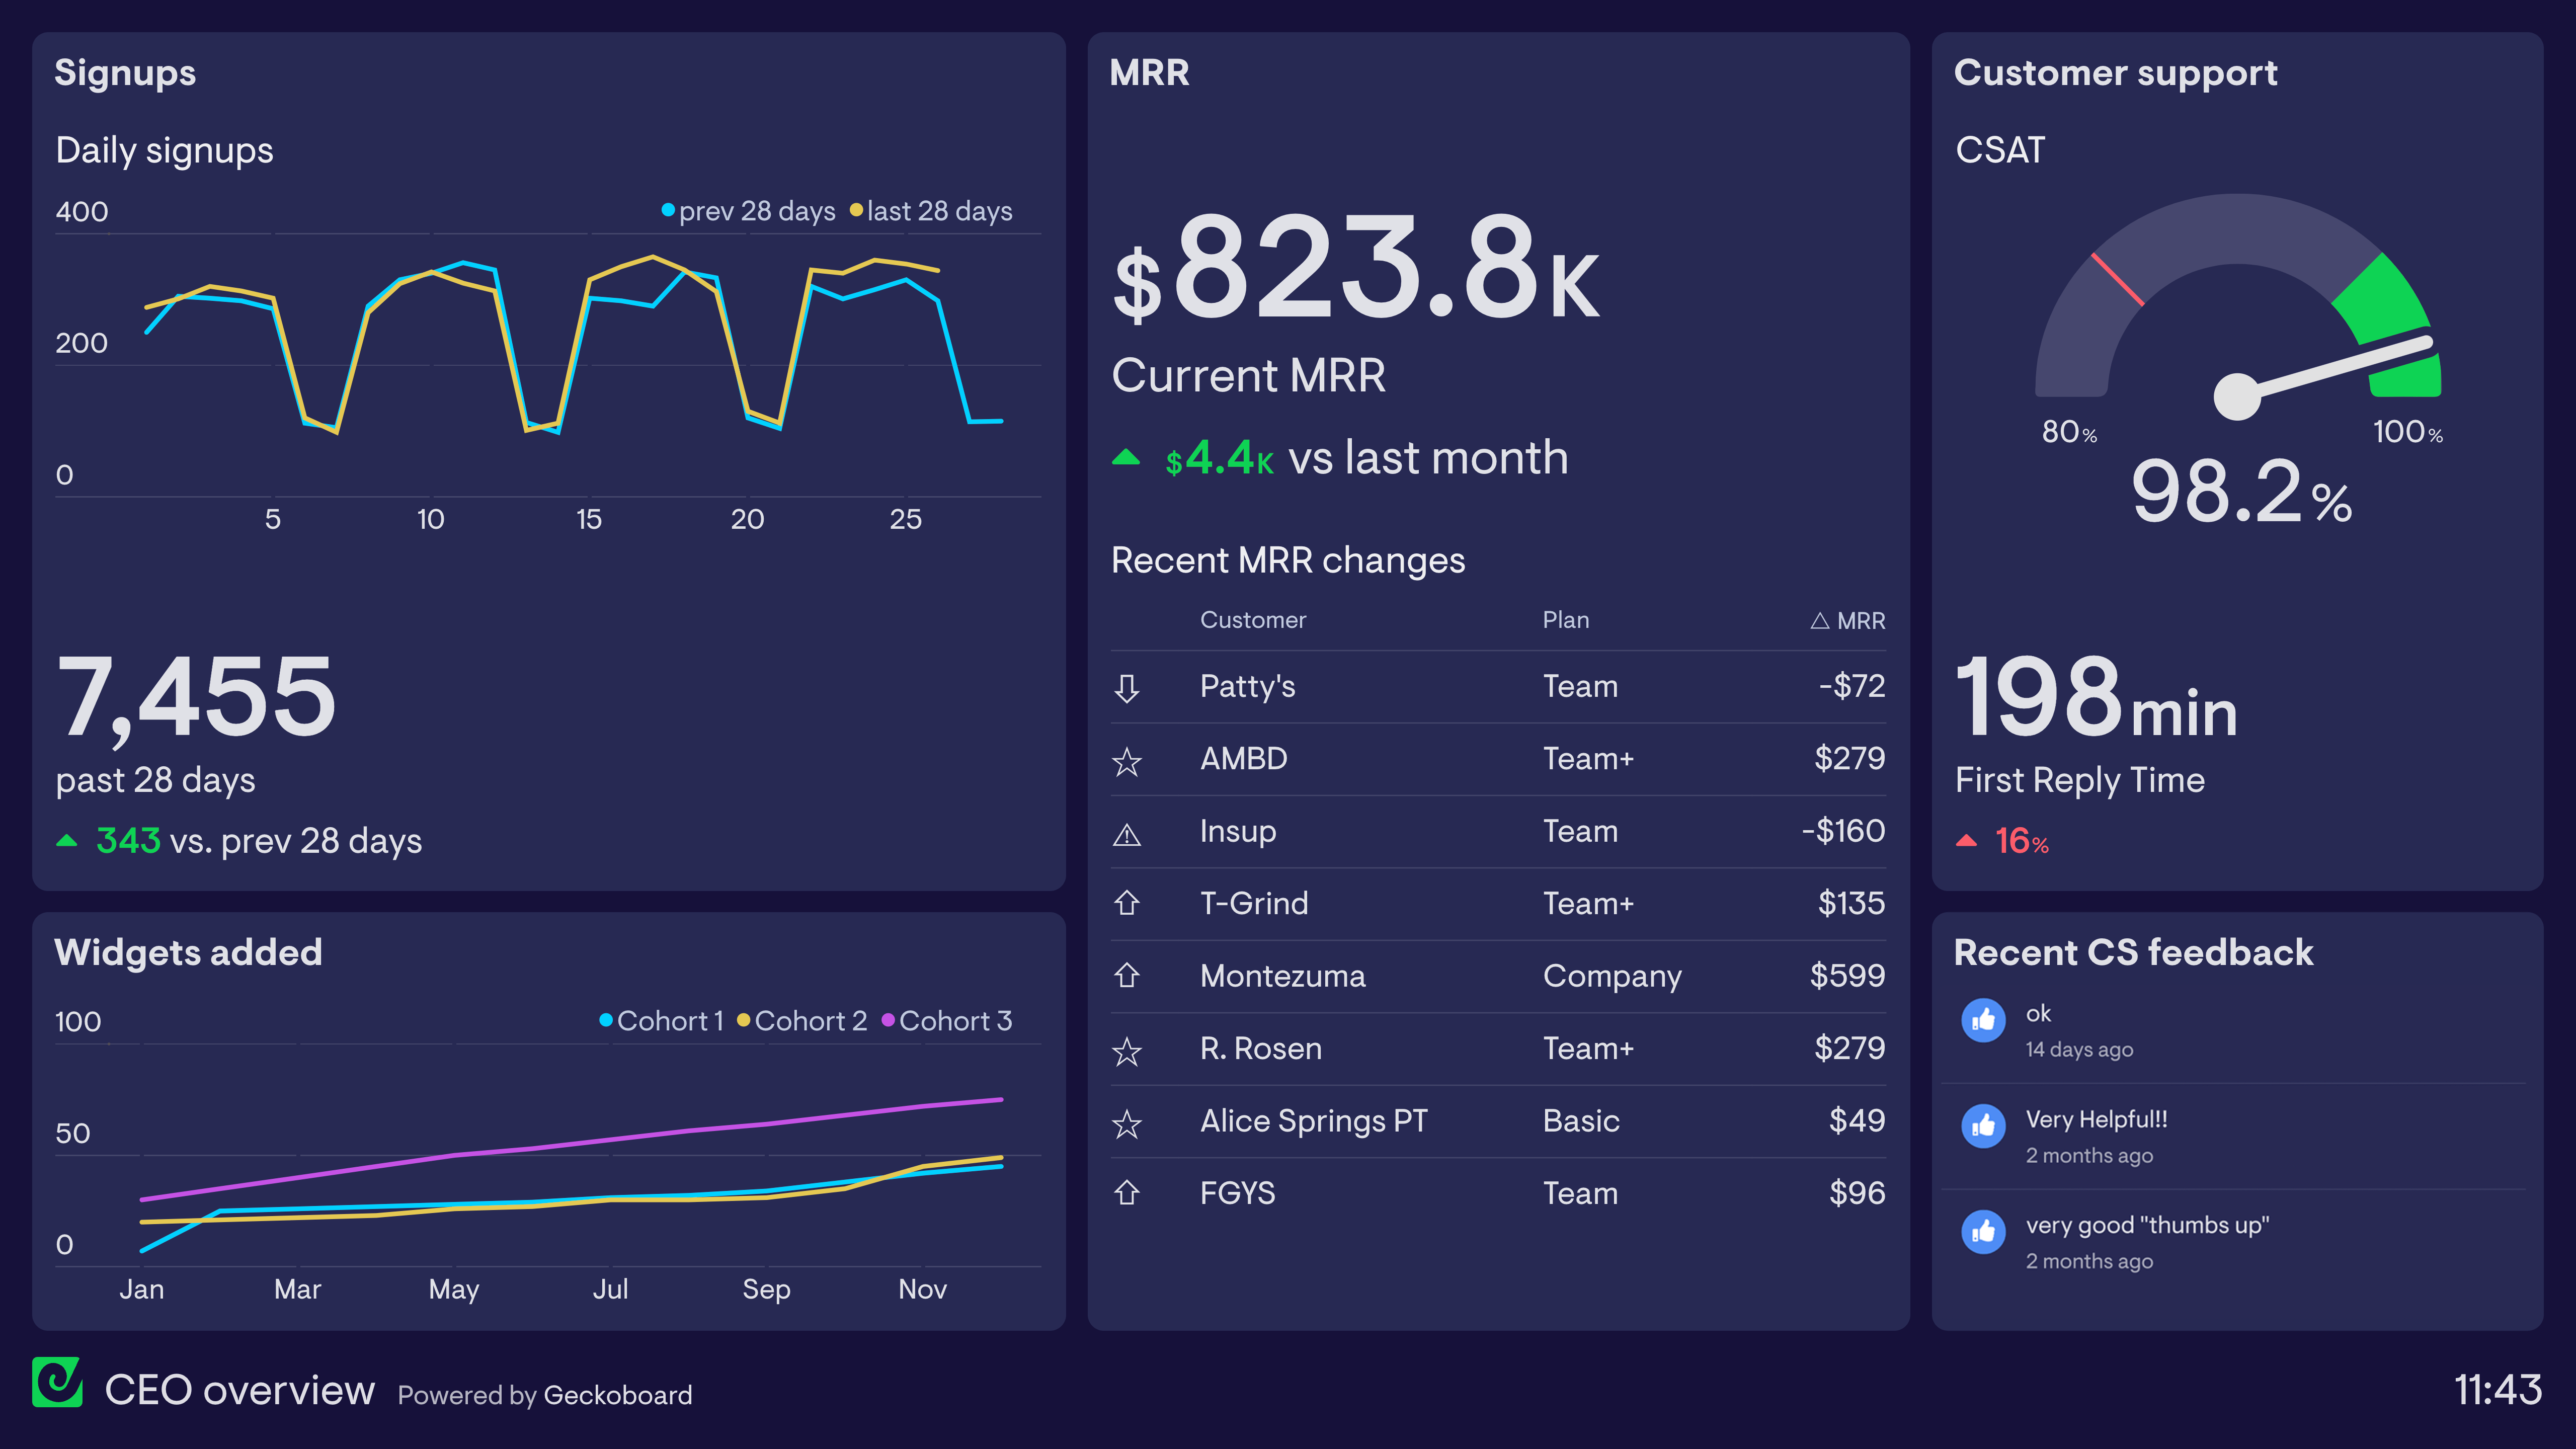
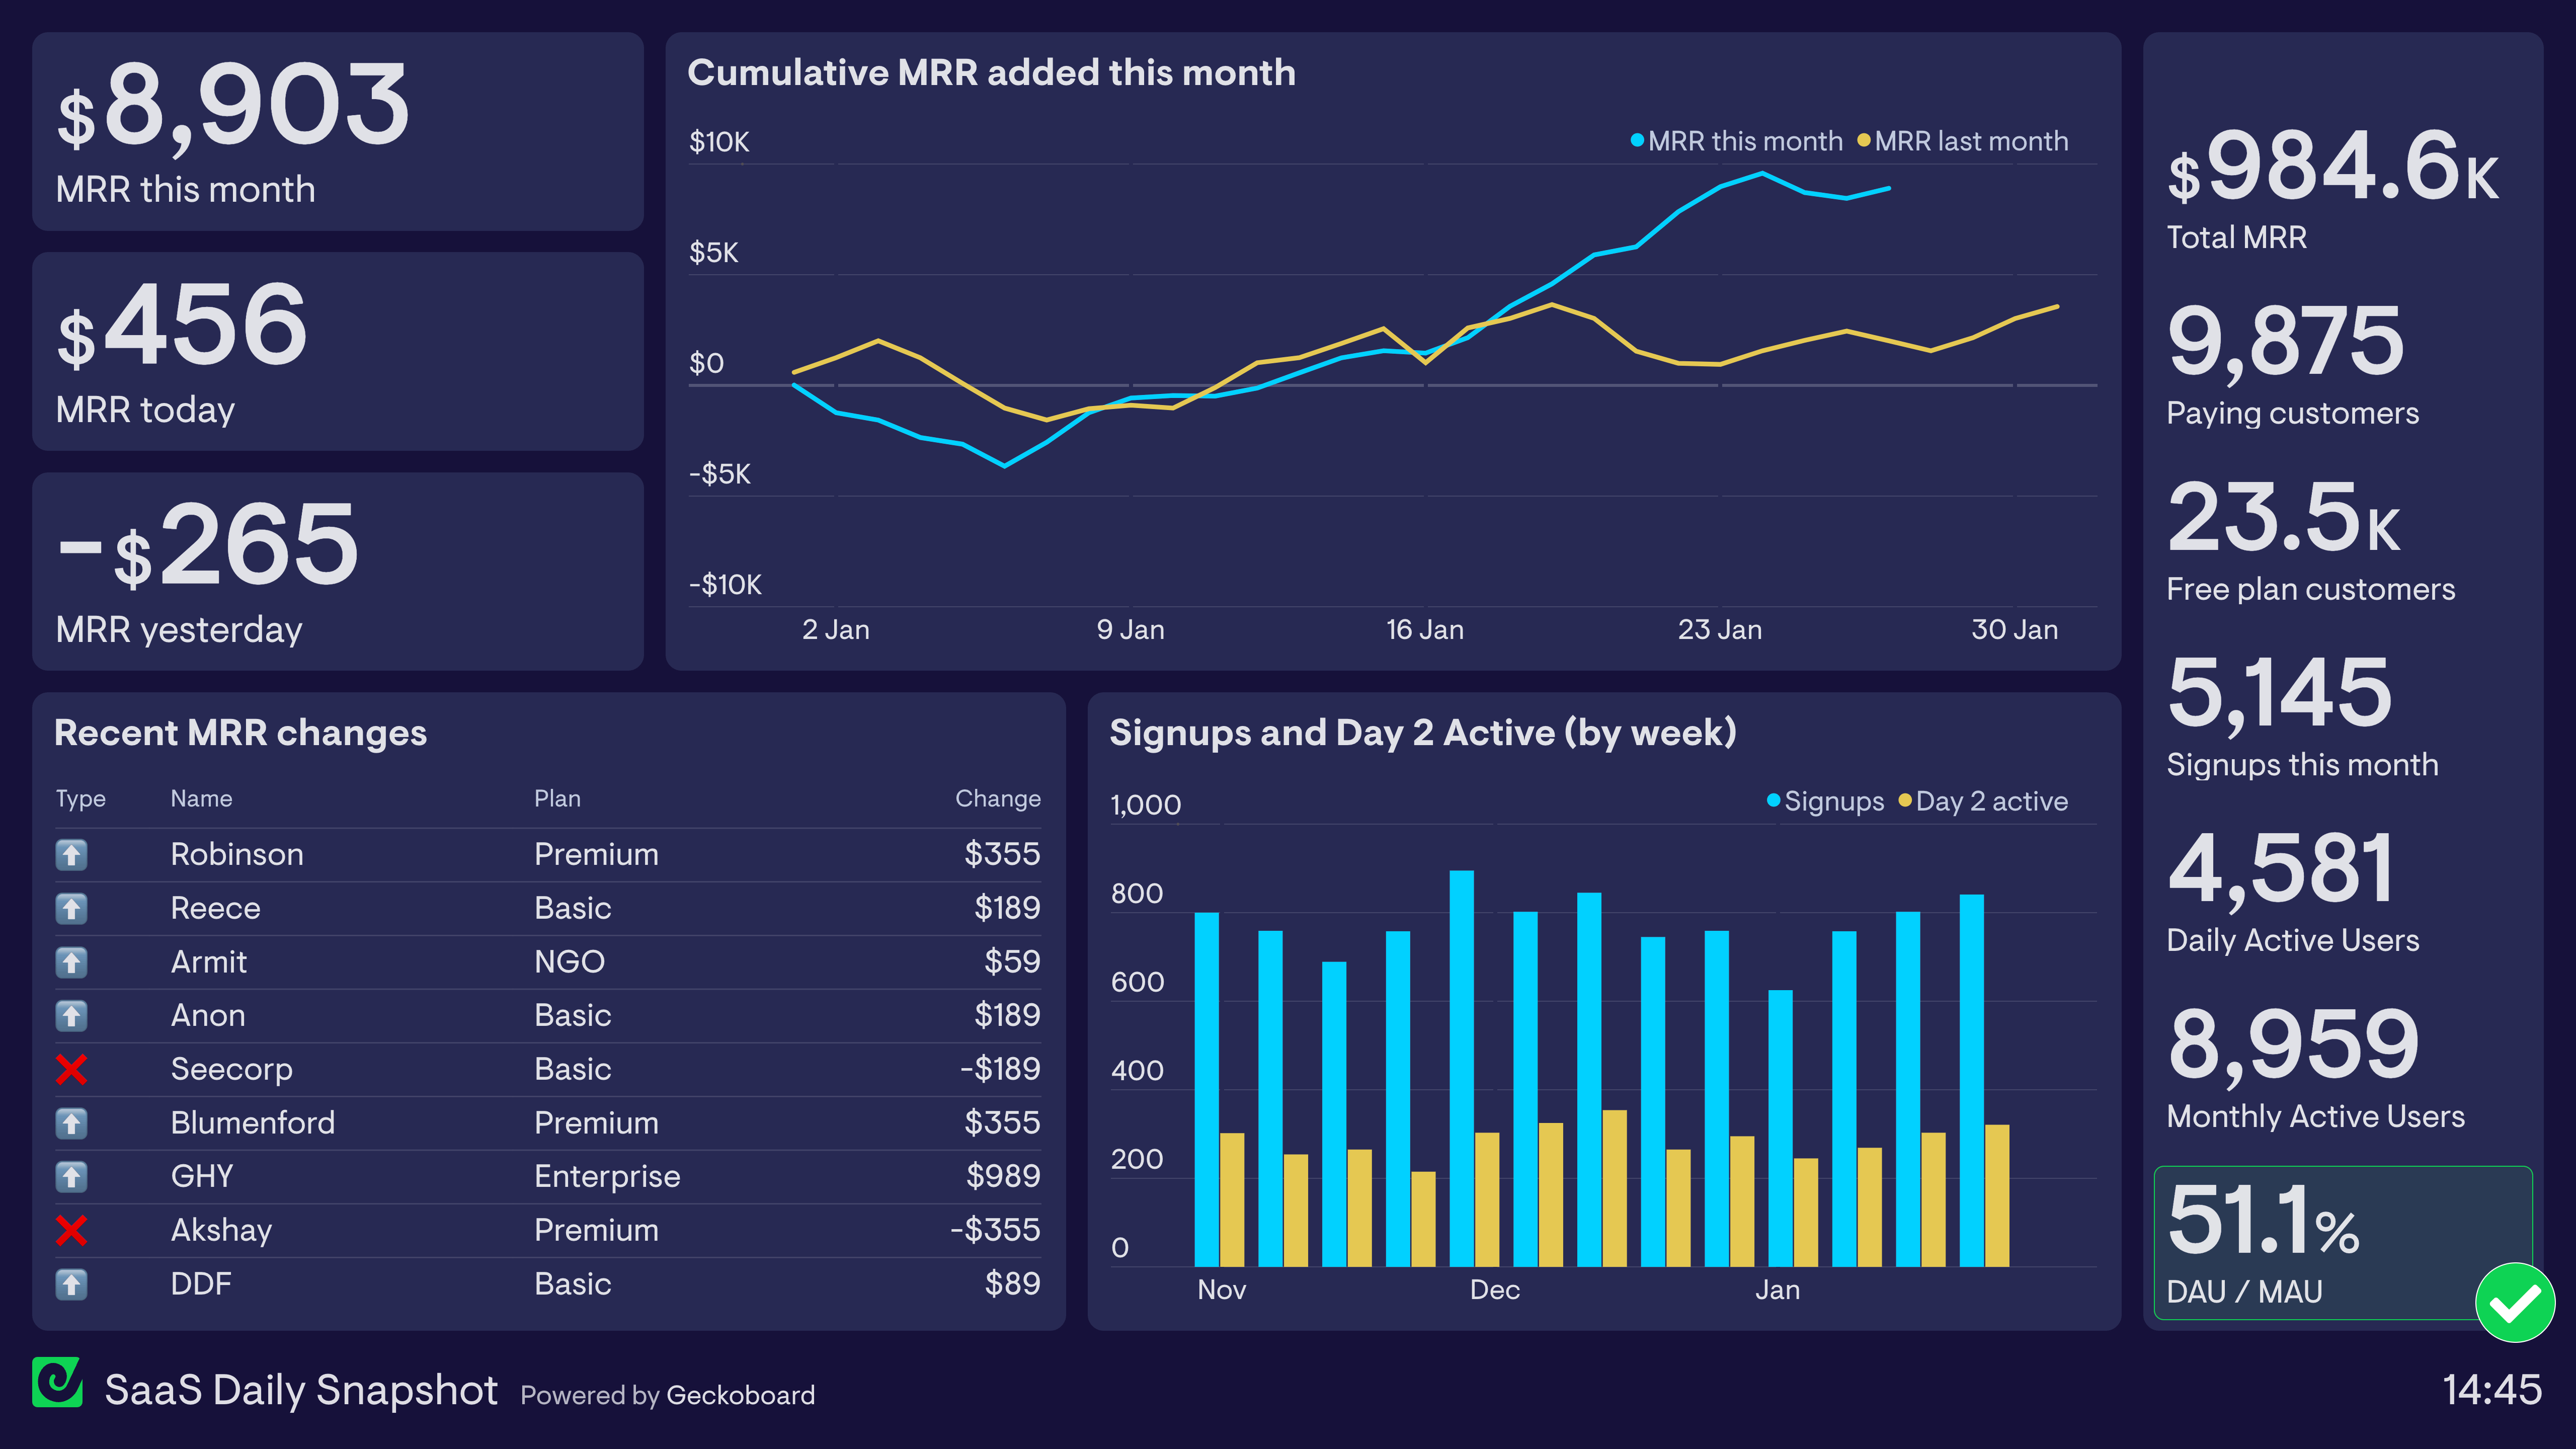
A Pirate Metrics dashboard tracks the five funnel stages — Acquisition, Activation, Retention, Referral, and Revenue — that define how a business converts visitors into paying, loyal customers. It's used by founders, growth teams, and product managers to identify where users drop off and which stage needs the most attention.
Geckoboard is a dashboard tool that pulls data from your product analytics, CRM, and support tools into one live view. It's used by growth-focused teams to keep the metrics that drive the business visible to everyone — not just the analysts who know how to run the queries.
Metrics typically include new user acquisition (by channel), activation rate, retention/churn rate, referral rate, MRR, and revenue growth. Teams combine product analytics, billing, and support data to build the full picture.
Building a custom Pirate Metrics dashboard is straightforward with Geckoboard's dashboard builder. Connect Baremetrics, Google Analytics, Zendesk Support, and SQL databases and custom data sources to cover all five funnel stages, then pick your metrics and build the view you need. Share with your team as a TV dashboard, shared link, or scheduled snapshot. Start a free trial or learn more about how Geckoboard works.
Use it to combine acquisition, product, and billing data into one growth funnel view. It’s also effective for giving leadership a live view of where the business is growing and where it’s leaking customers.