Black Friday dashboard examples
Black Friday dashboards bring the live sales, advertising, website and customer support metrics ecommerce teams need during their busiest trading periods into one place.
These examples show how teams can monitor Black Friday and Cyber Monday performance, spot problems early and stay focused through the wider holiday and peak season.
A Black Friday dashboard gives ecommerce teams a real-time view of sales, campaign performance, site health and customer demand during peak trading. It helps teams see what is happening now, identify issues early and make decisions while there is still time to improve the outcome.
Black Friday ecommerce monitoring dashboard
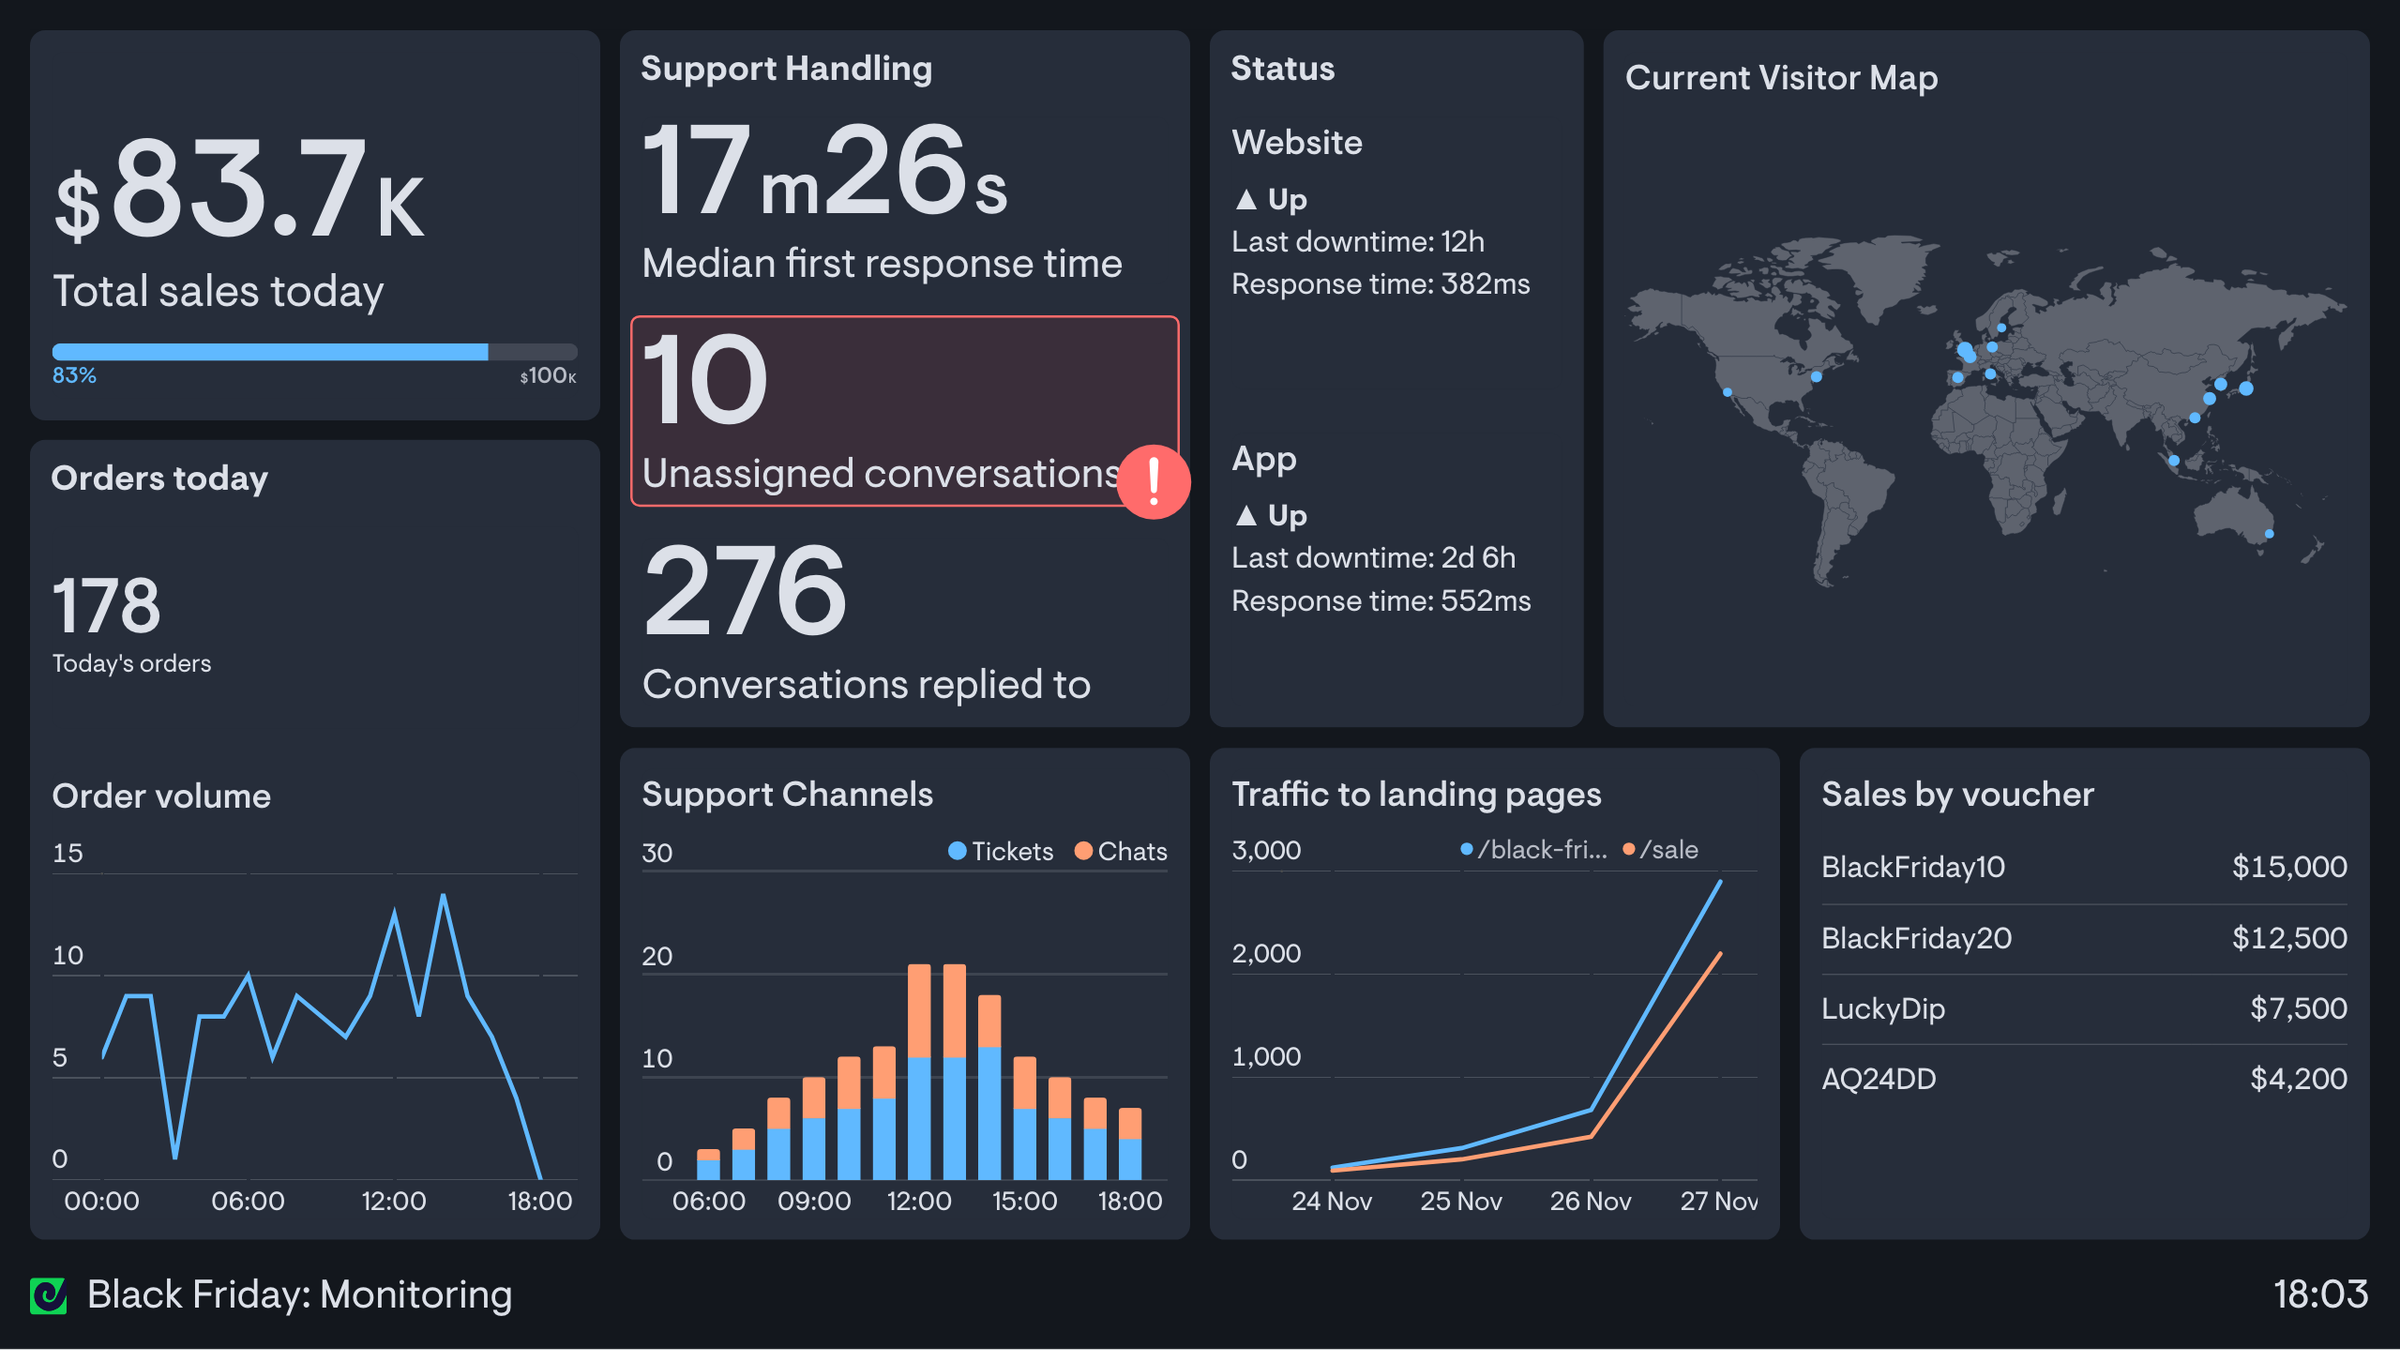
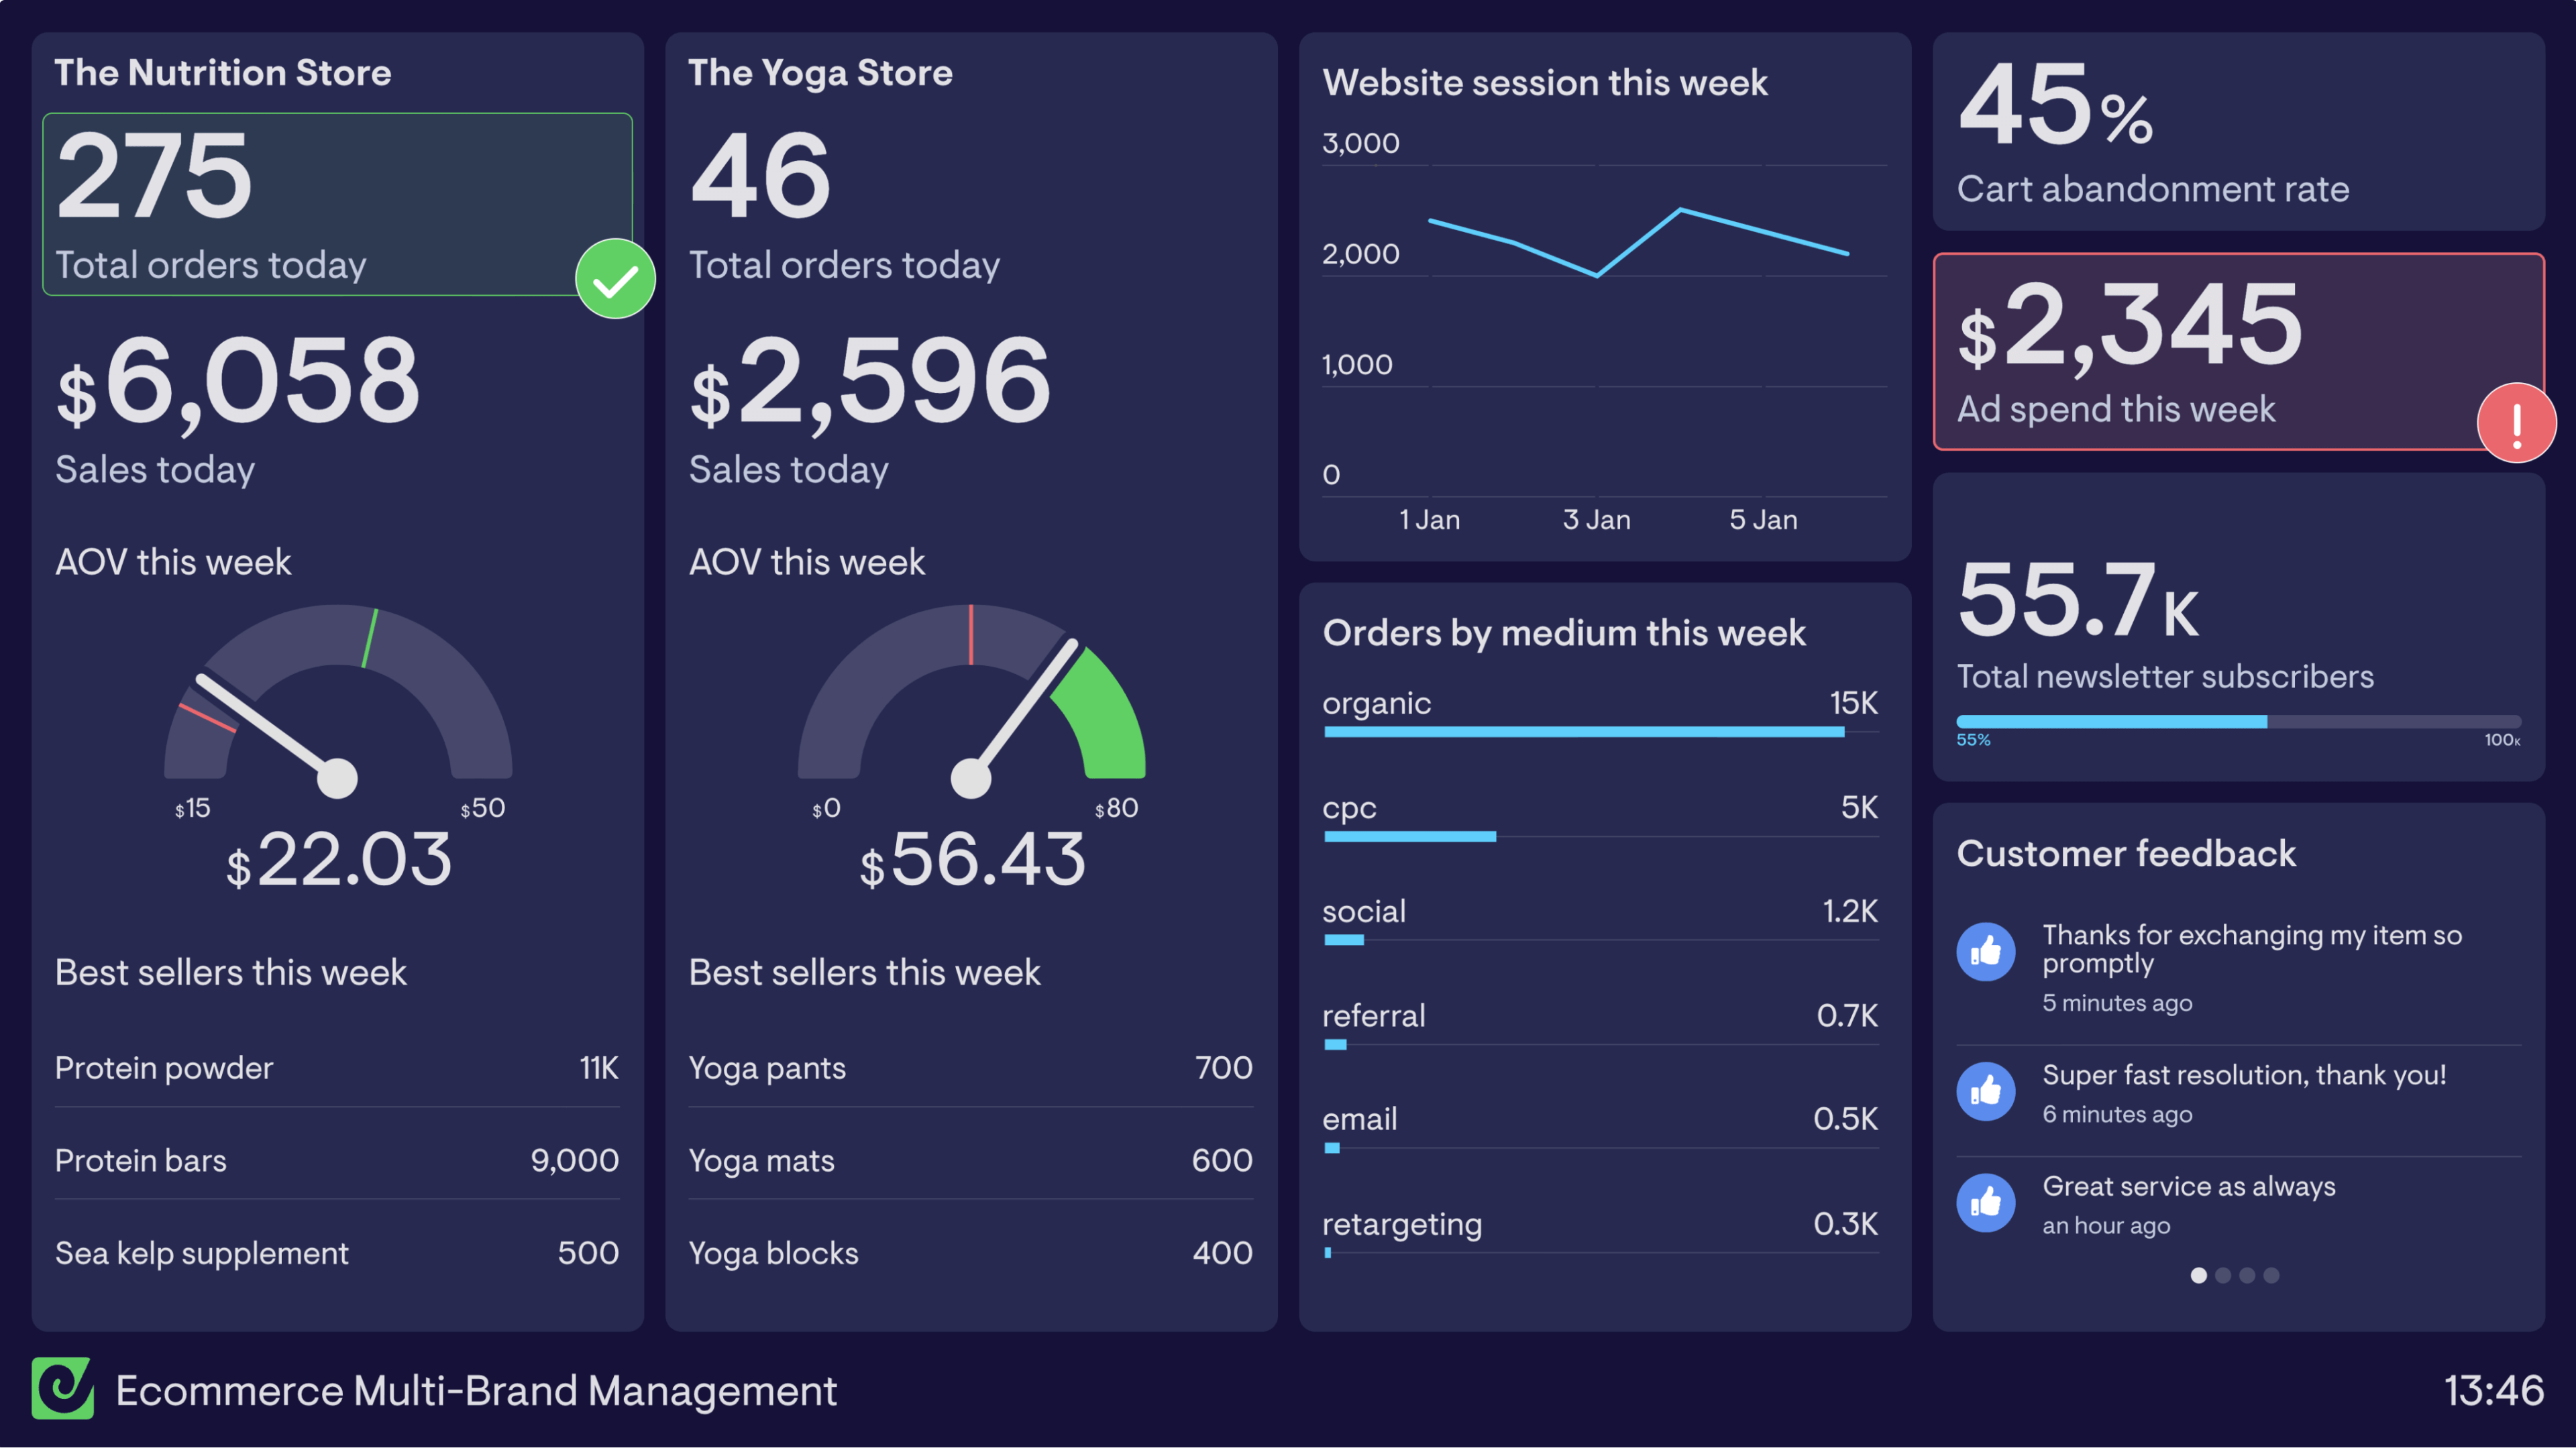
This Black Friday ecommerce monitoring dashboard gives the whole business a shared view of performance during the sale. It combines total sales against target, order volume, support response and workload, website and app availability, live visitor locations, landing-page traffic and voucher revenue.
Ecommerce leaders can see whether trading is on pace, while support, marketing and technical teams can spot the issues that may put revenue or customer experience at risk. An unassigned support queue, unusual channel mix, traffic surge or availability problem becomes visible to everyone at the same time, making it easier to coordinate a response before a small change becomes a costly incident.
The dashboard is designed to stay visible throughout Black Friday and Cyber Monday as a common operating picture for the business. It reduces the need to reconcile separate reports and gives every team the context to understand how its work affects the wider event.
Black Friday ads performance dashboard
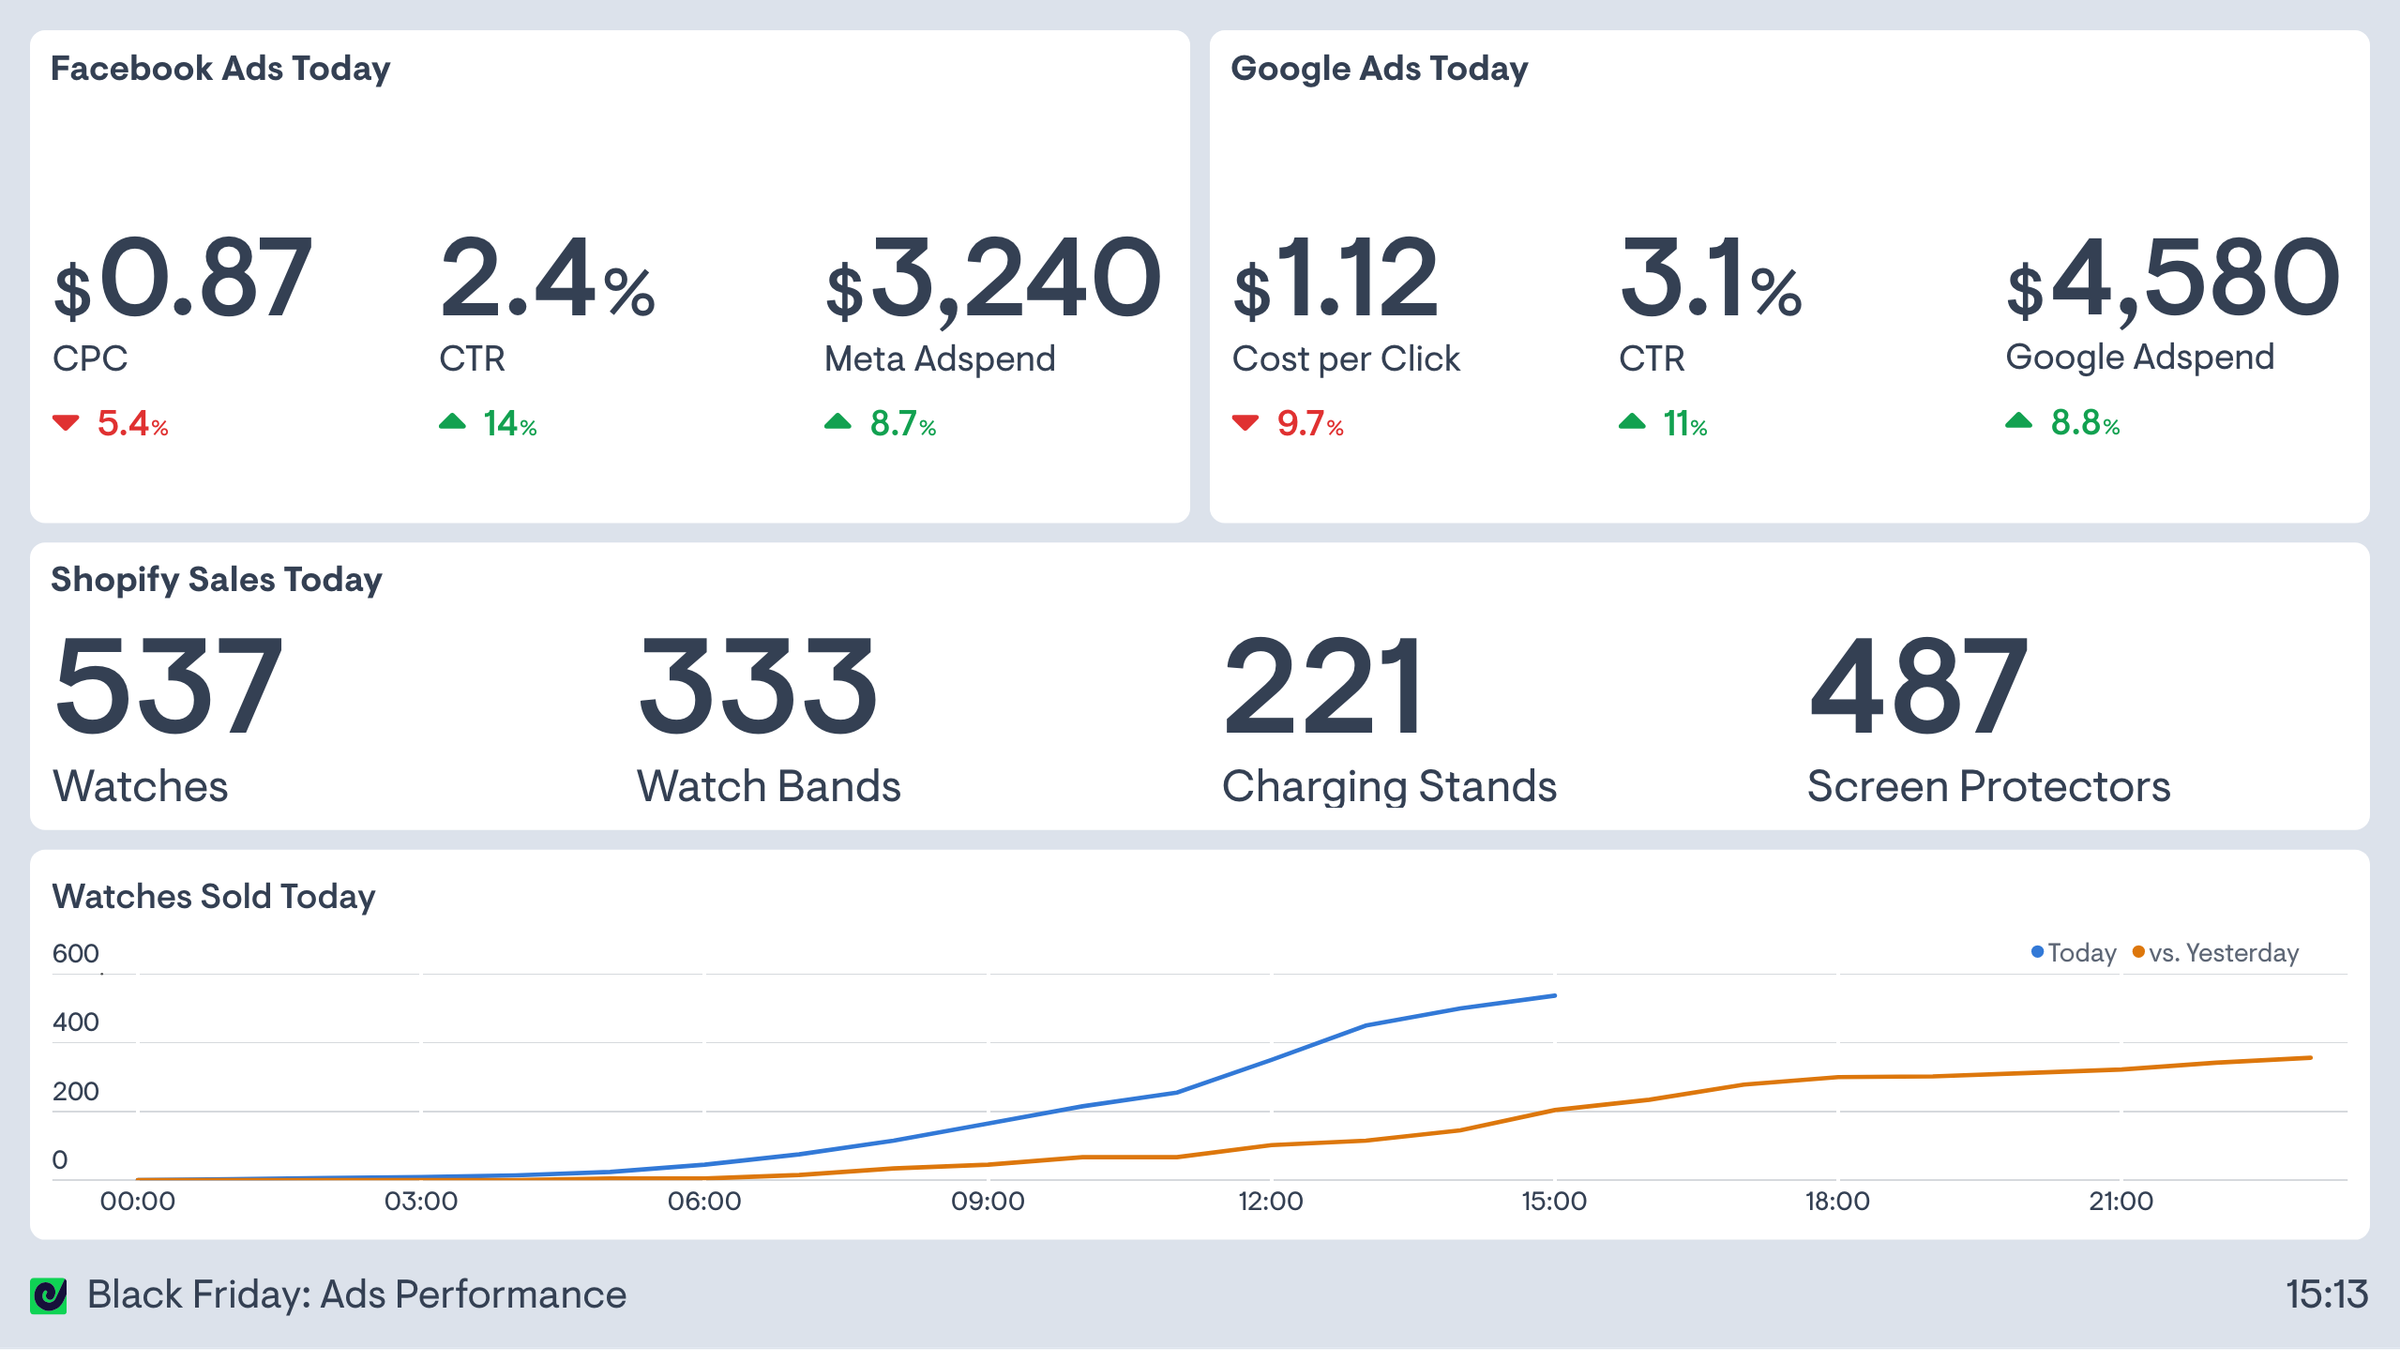
This Black Friday ads performance dashboard brings paid media efficiency and ecommerce demand into one view. It tracks Facebook Ads and Google Ads cost per click, click-through rate and spend, then places those leading indicators alongside live Shopify sales by product.
Marketing teams can see whether increased spend is creating the response they expected and compare campaign movement with the products customers are actually buying. If spend climbs without a corresponding change in sales, the team can investigate targeting, creative, landing pages or stock. If performance strengthens, they have timely evidence to support a careful budget shift while the event is still running.
The sales trend compares today with the previous day, giving the team context for pacing without opening multiple ad platforms and store reports. For a complete profitability view, teams can add conversion rate, revenue or return on ad spend alongside the metrics shown here.
Black Friday Shopify sales dashboard
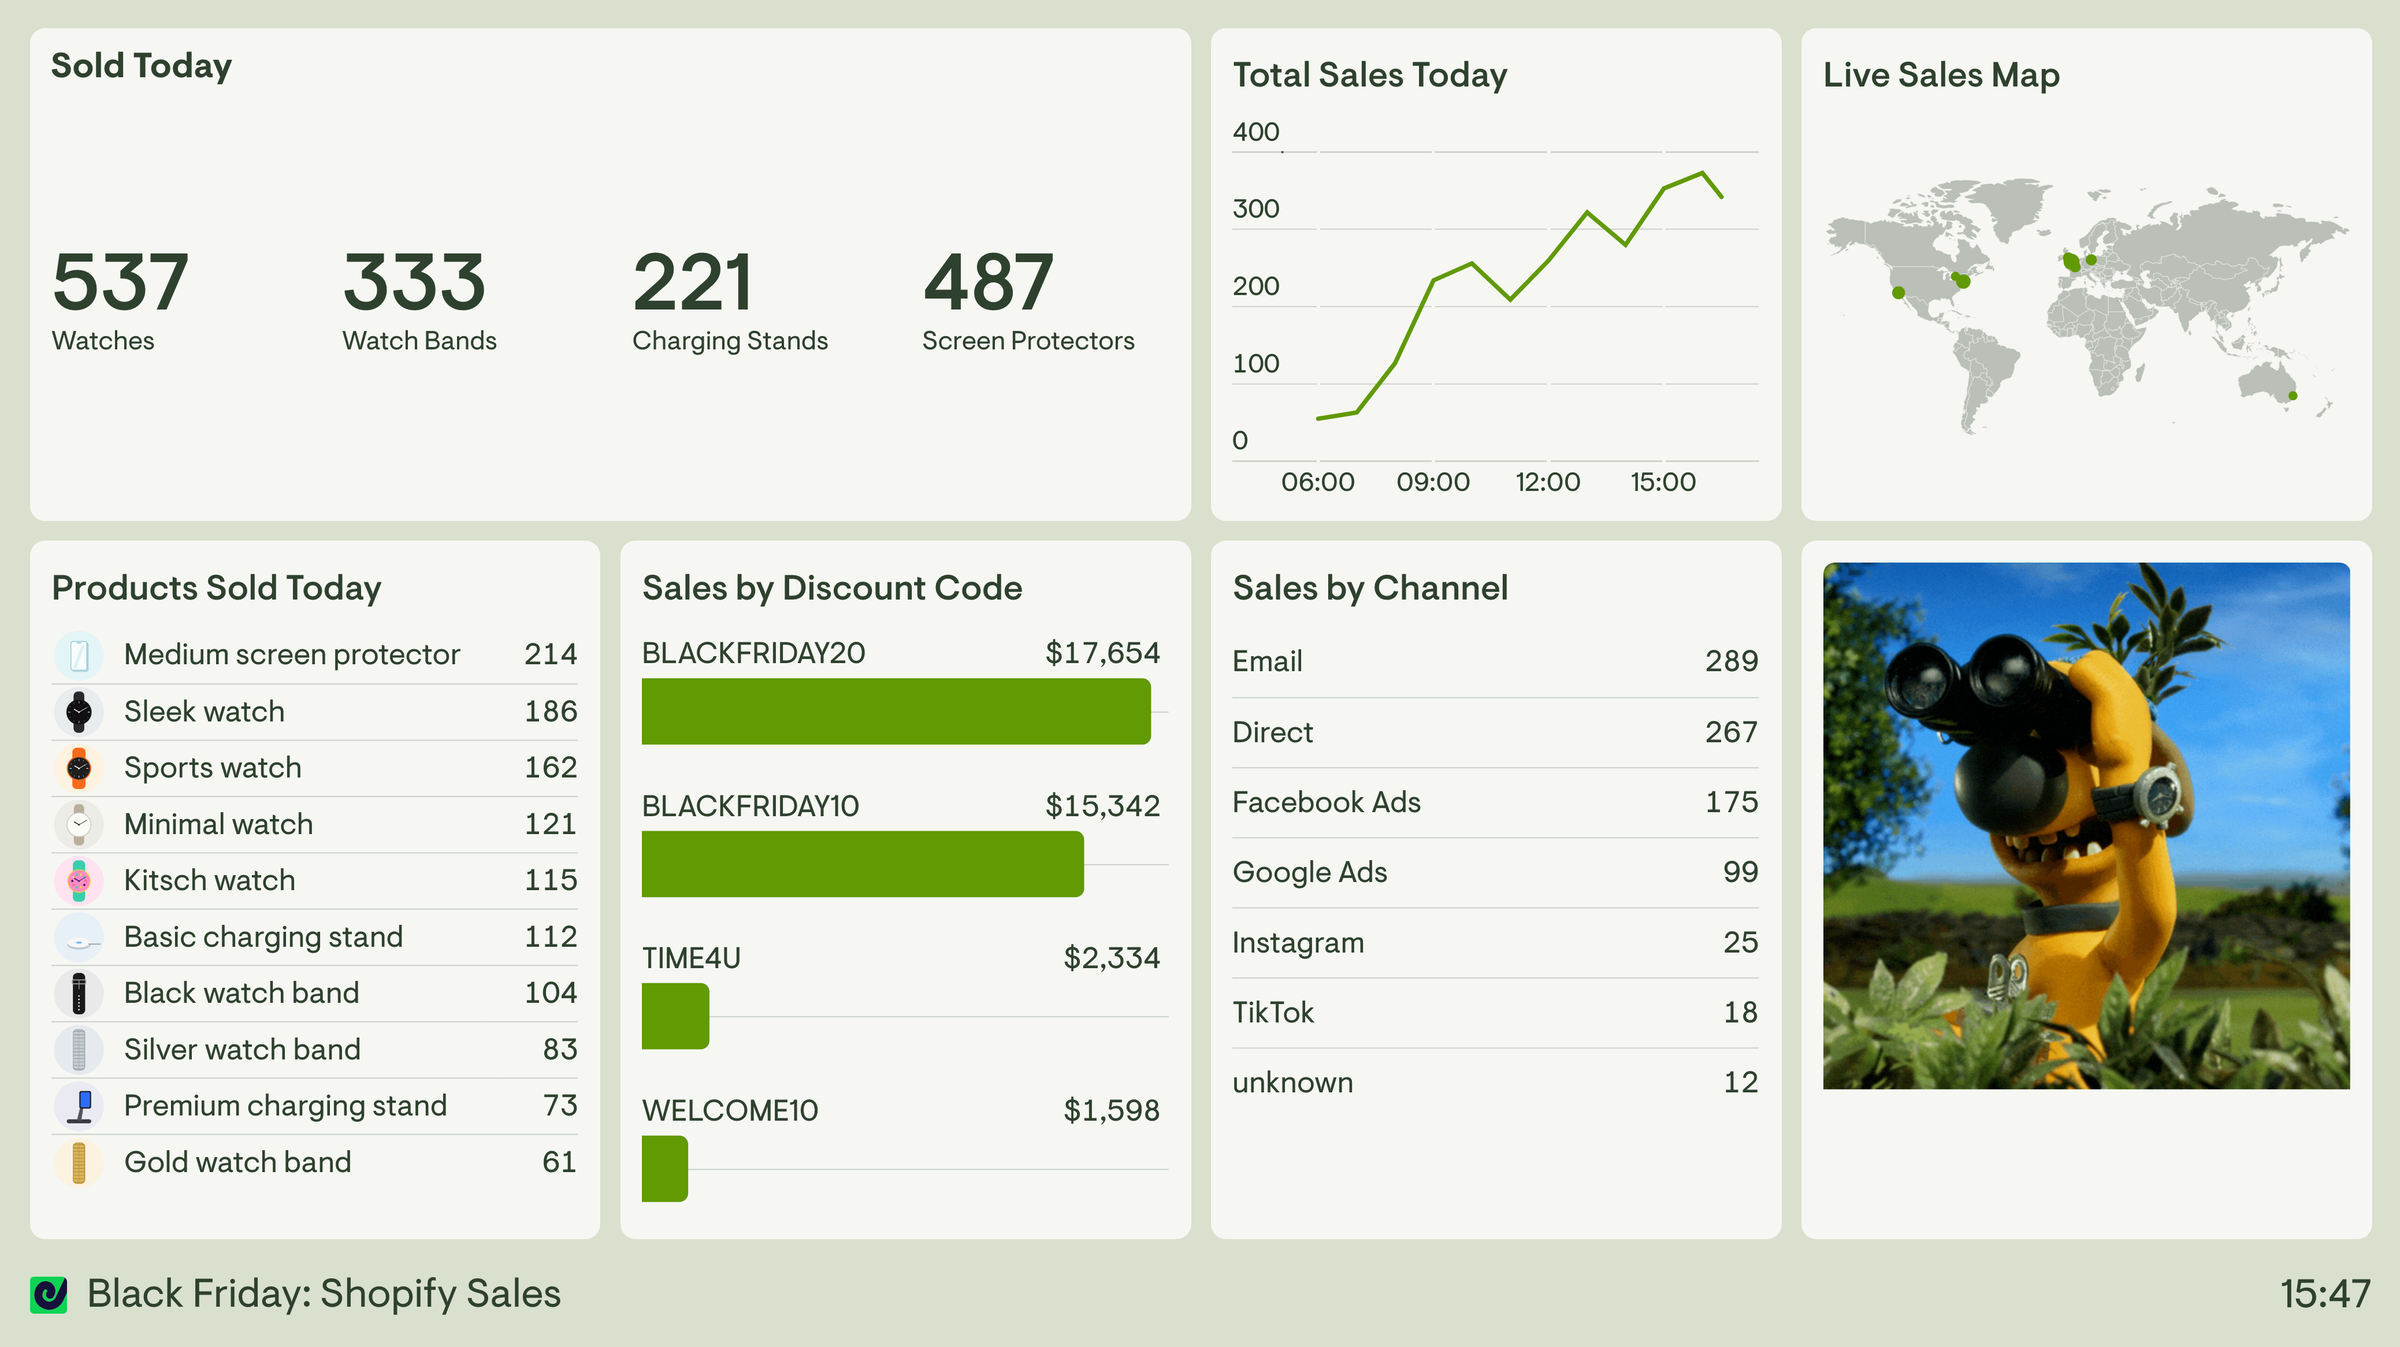
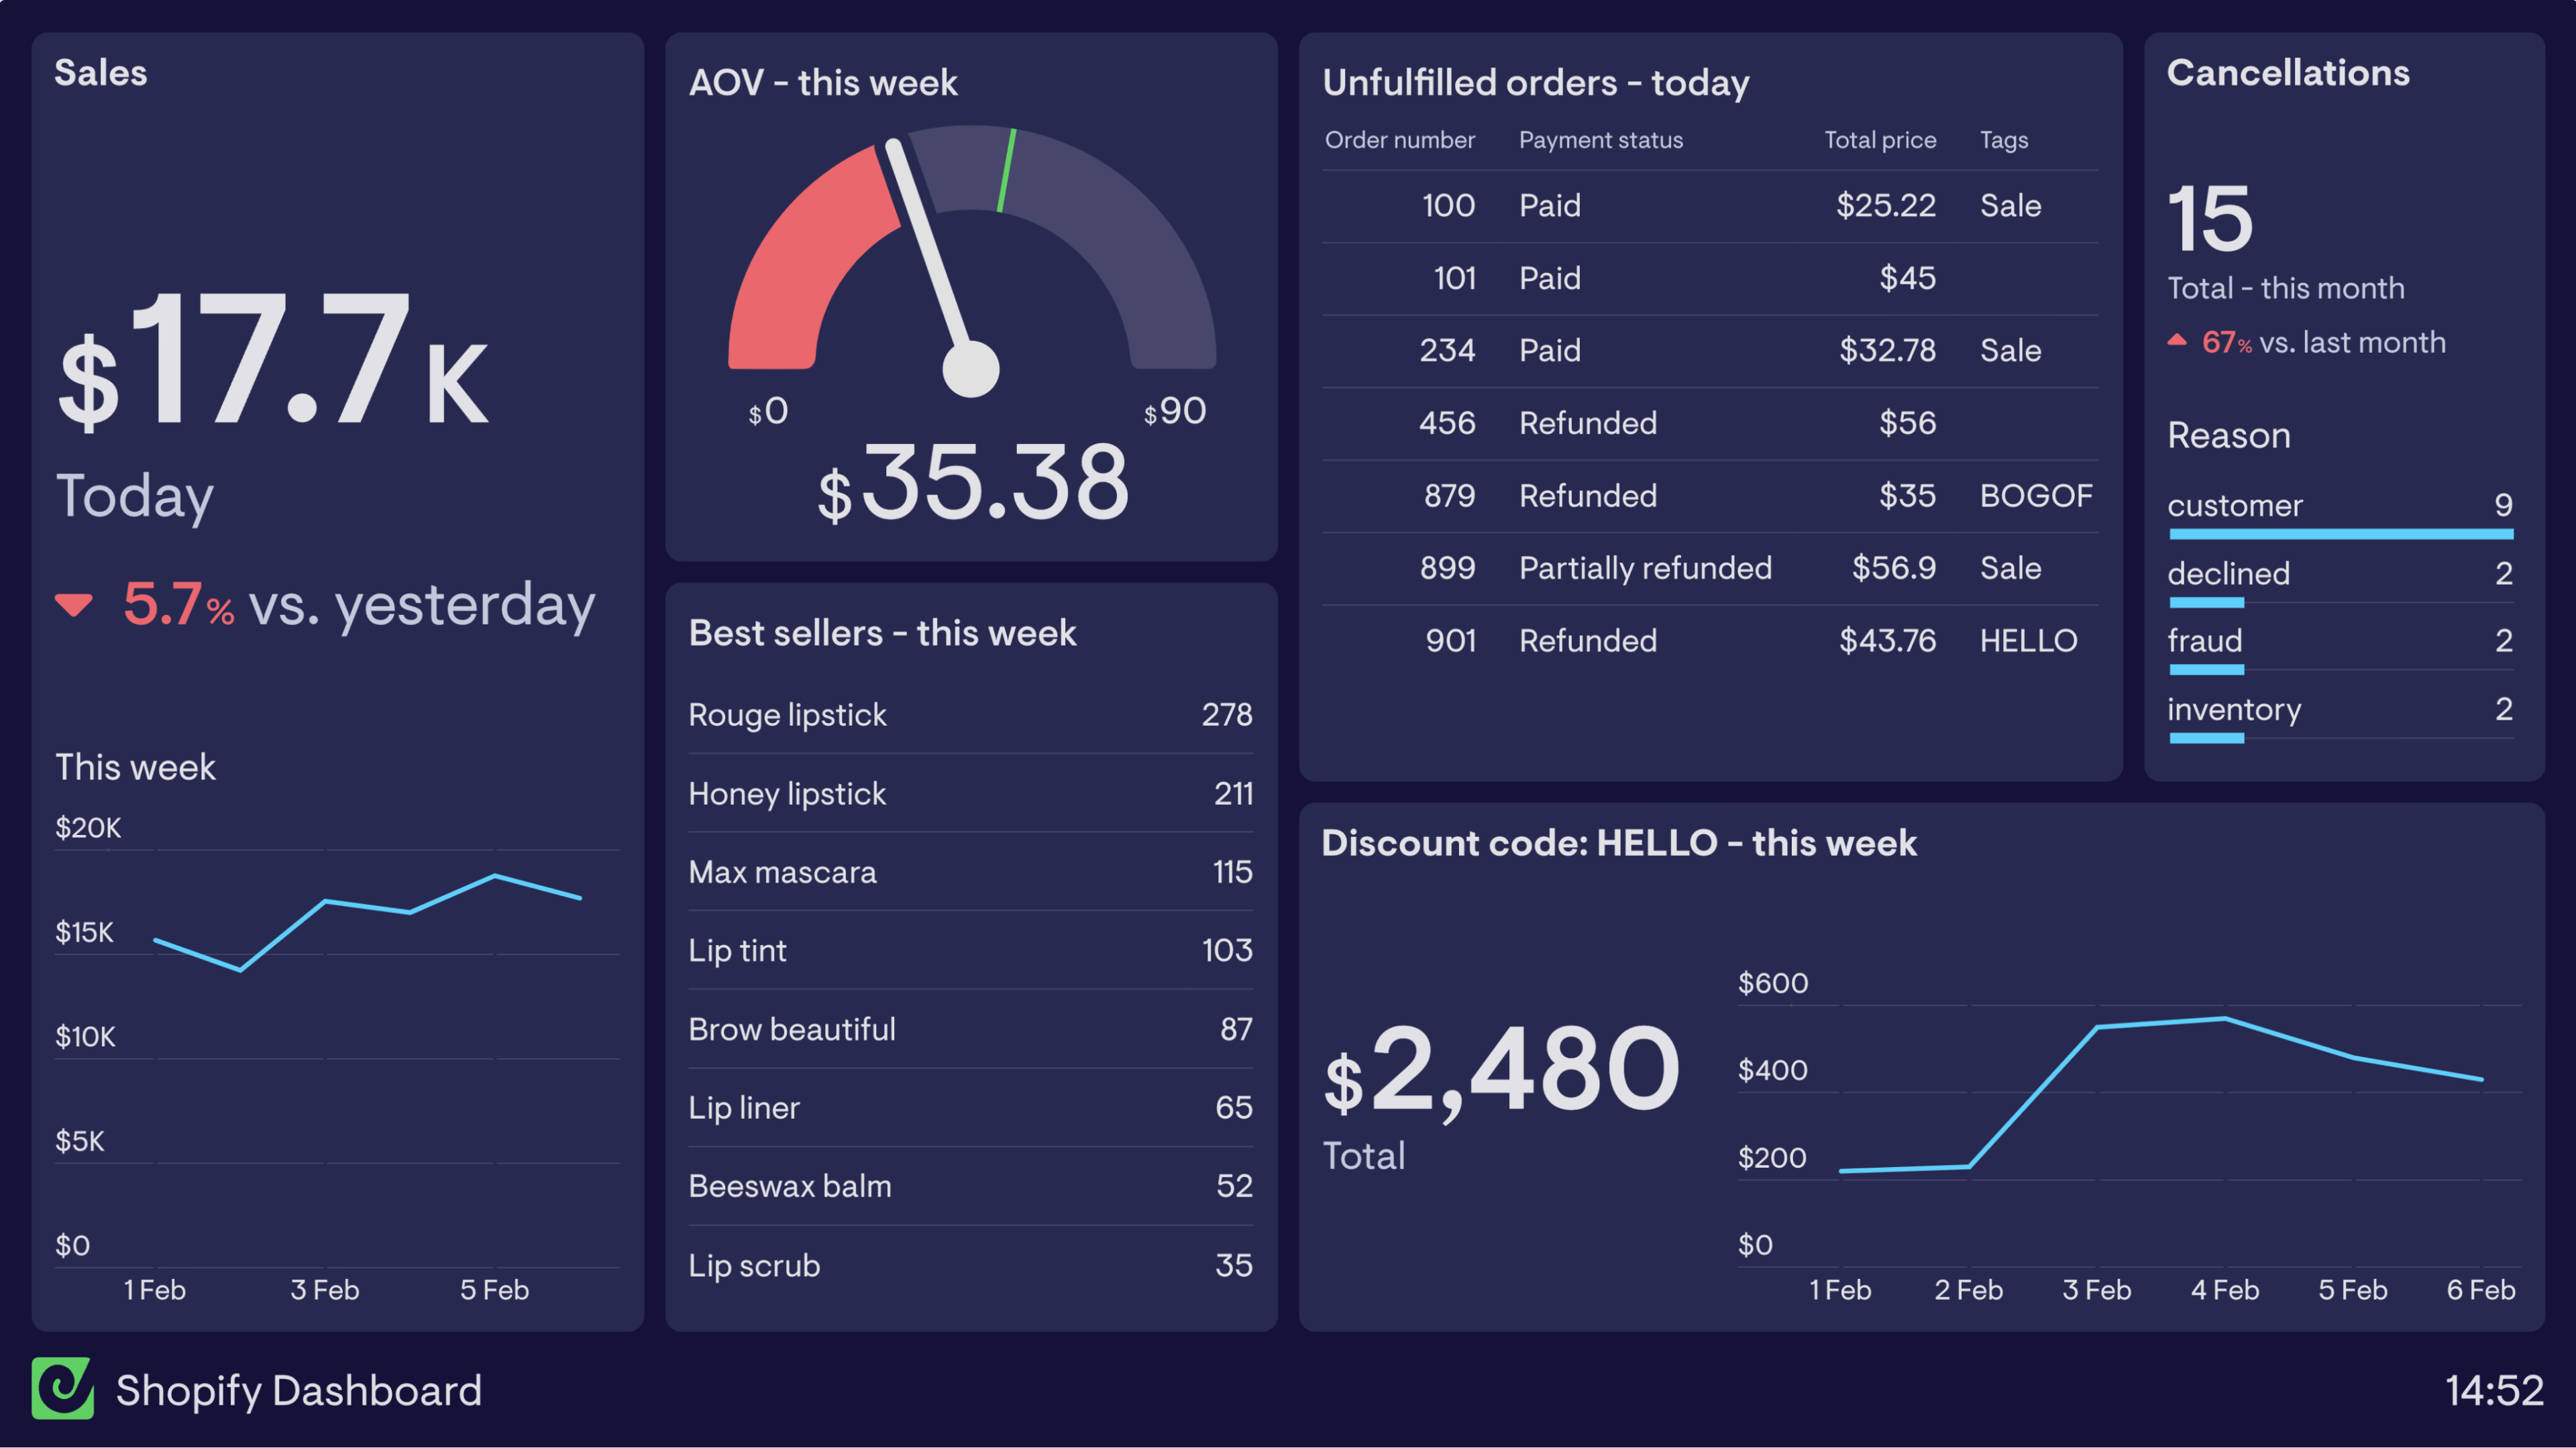
This Black Friday Cyber Monday (BFCM) Shopify sales dashboard helps keep the momentum up during one of the busiest trading periods of the year. Large product-category totals and the live sales chart make progress easy to see at a glance, helping the team celebrate momentum as orders build through the day.
A product ranking shows exactly what customers are buying, while sales by discount code and channel reveal which promotions and sources are contributing to demand. The live map adds geographic context, helping teams see where orders are arriving from without moving between Shopify and campaign reports.
The dashboard is useful for short, practical trading decisions, such as featuring a fast-moving product, giving a quieter category more visibility or checking stock before increasing promotion. The animated image adds a little fun to the screen and helps keep spirits high, without distracting from the numbers the team needs.
Peak season customer support dashboard
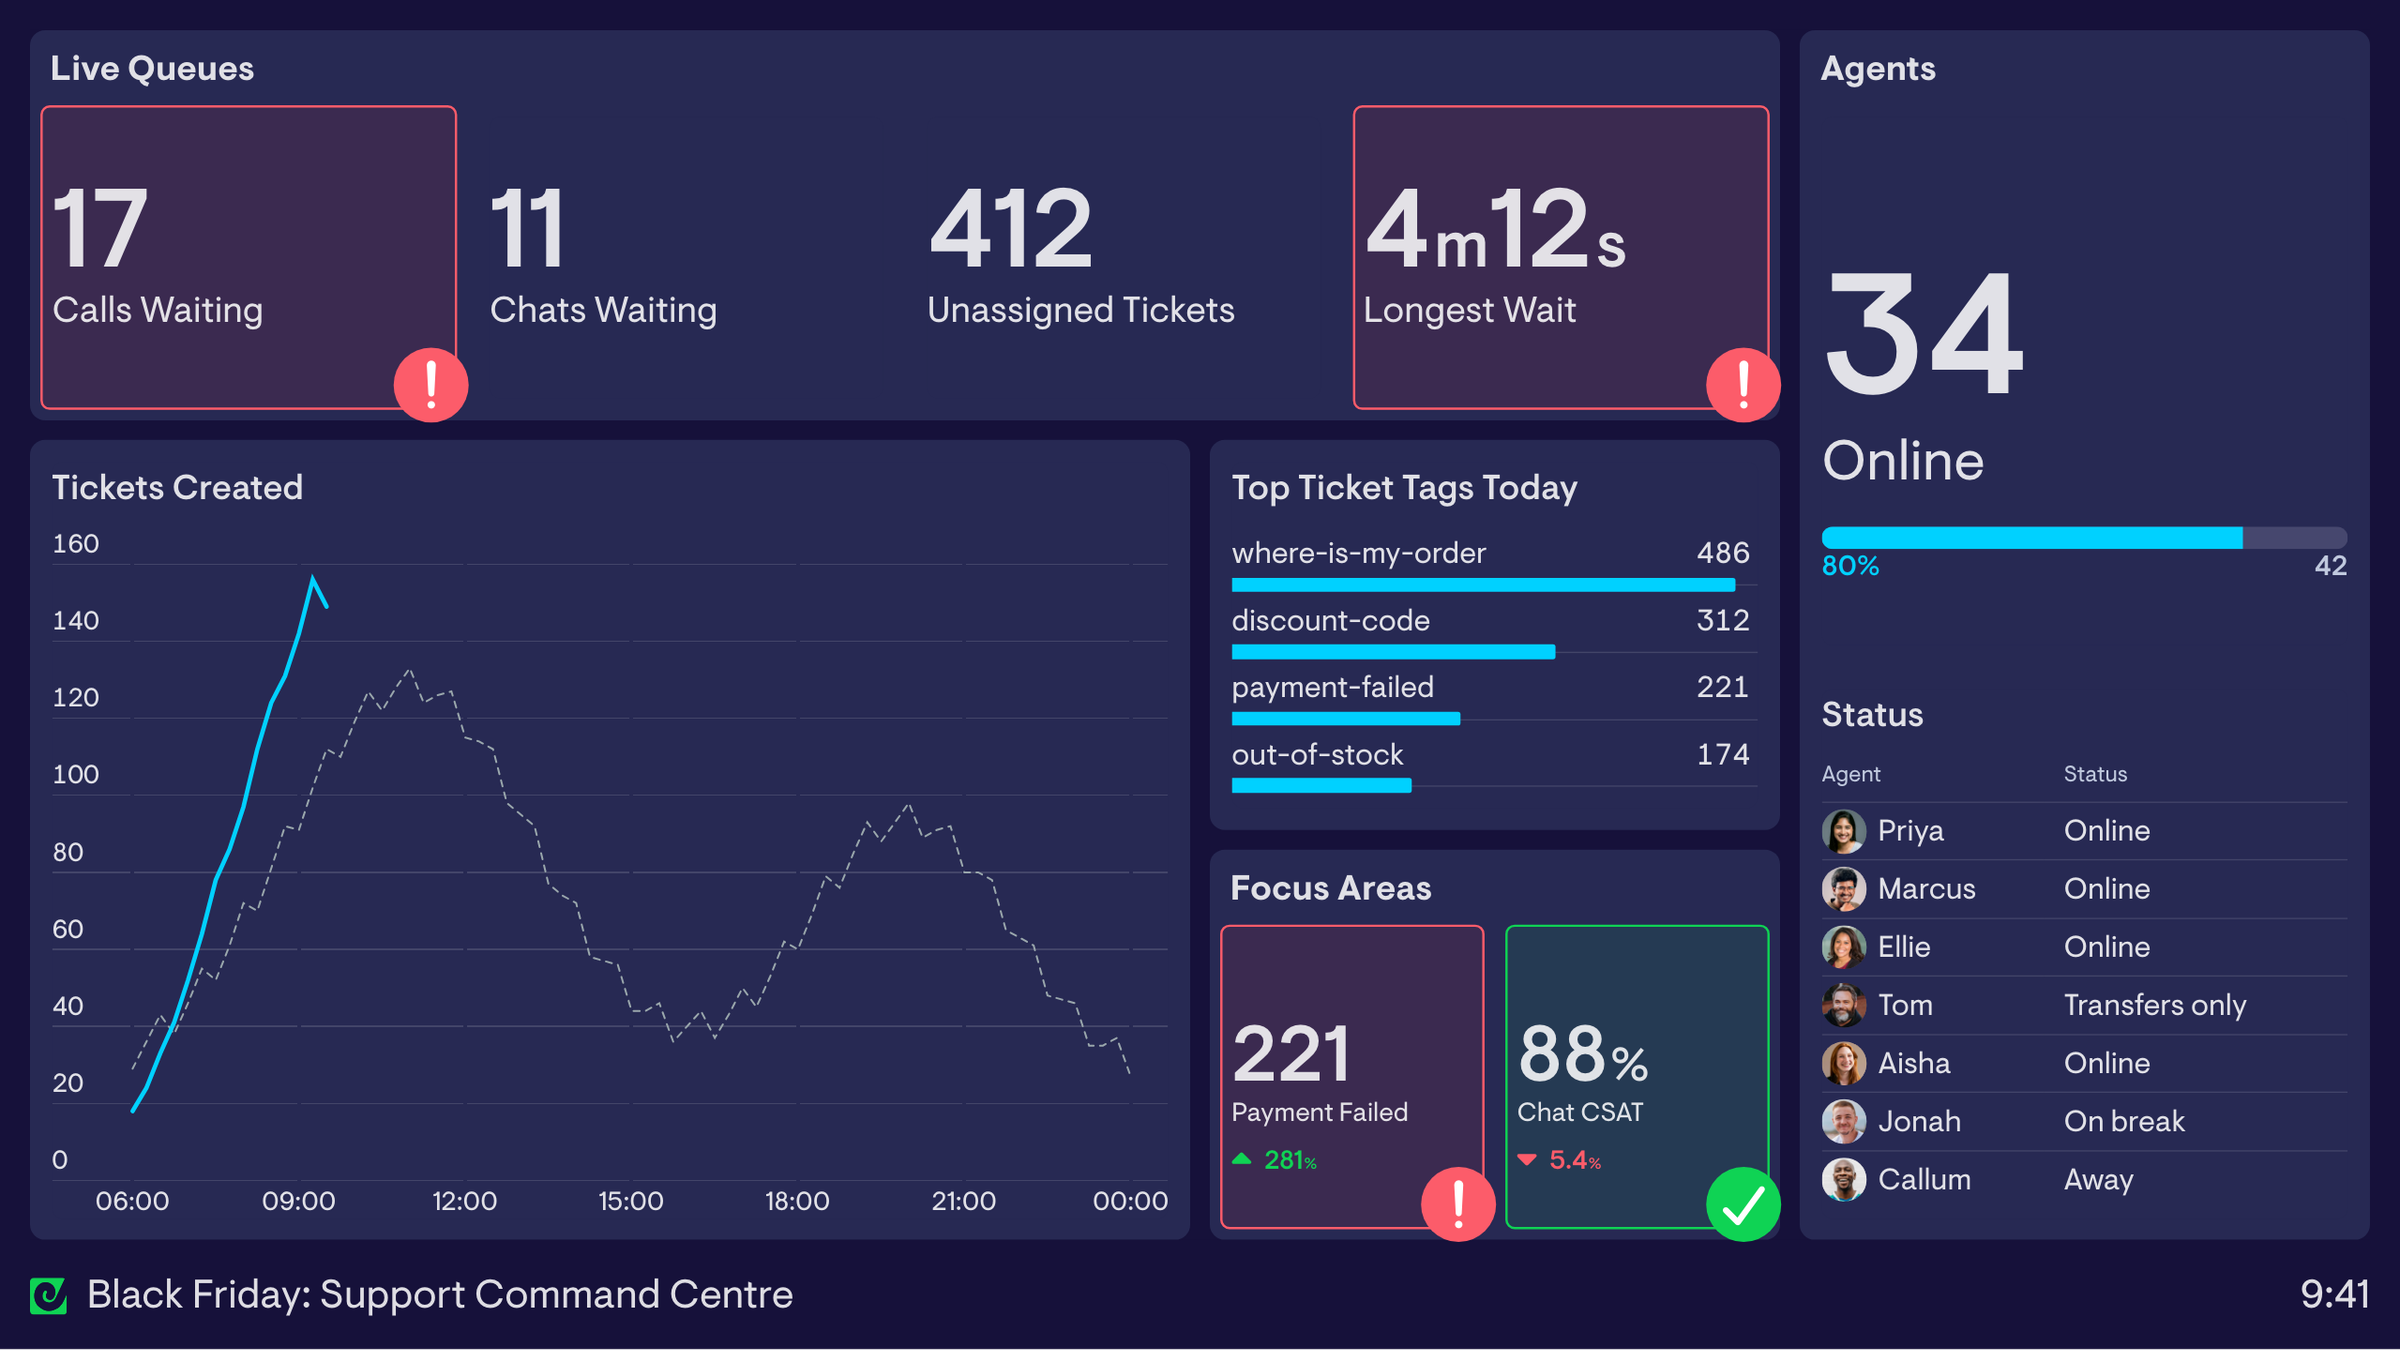
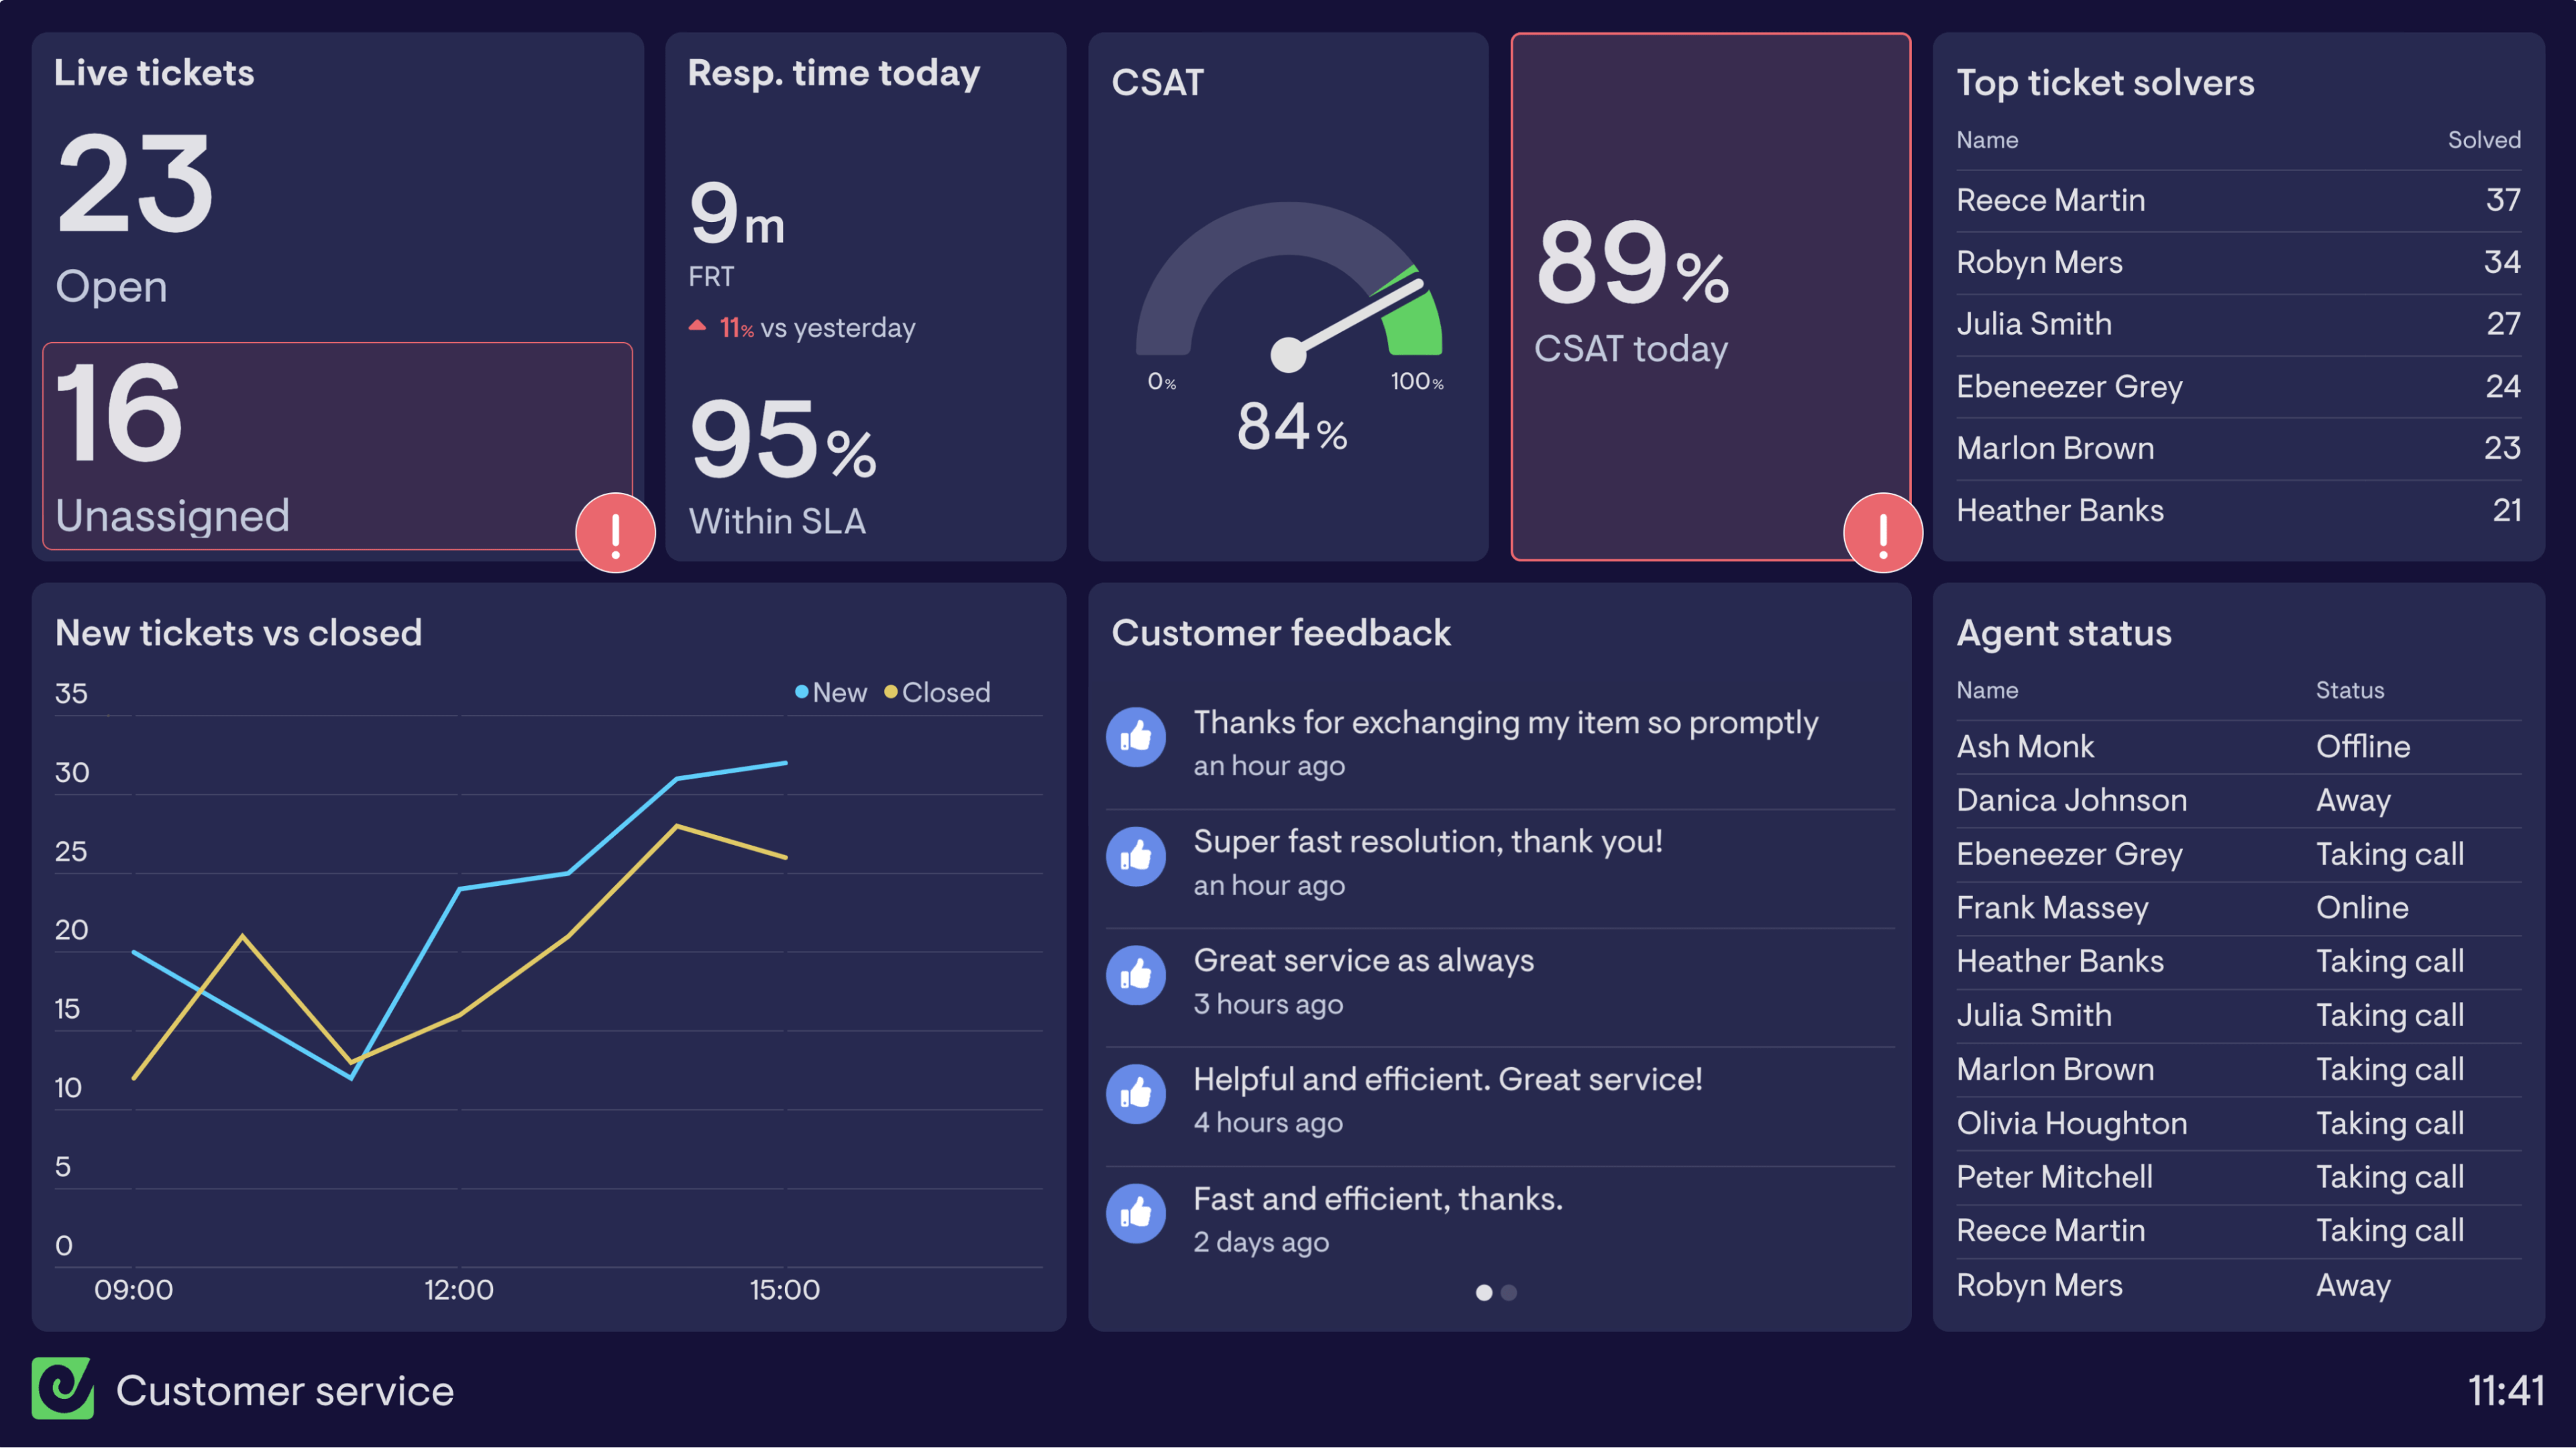
This peak season customer support dashboard gives the team a clear view of the work that needs attention now. The live queue keeps calls waiting, chats waiting, unassigned tickets and longest wait prominent, while threshold alerts make urgent pressure visible before it turns into a sustained backlog.
The dashboard deliberately keeps the metric set focused. Tickets created shows how today’s demand compares with a normal or previous pattern, top tags reveal the customer issues driving contact, and focus metrics keep payment failures and chat CSAT visible. Team leaders can use these signals to move people, escalate recurring problems or publish proactive guidance instead of simply asking agents to work faster.
Agent availability gives the whole team a quick way to see who is online, away, on a break or handling transfers, and helps managers keep track of coverage across the shift. This example fits Black Friday, Thanksgiving and the Christmas holiday season, however would also work for any company or industry with a predictable surge in demand.
Browse other popular examples
A Black Friday dashboard brings live sales, advertising, website and customer support metrics into one screen, so ecommerce teams can see how trading is going during their busiest period without switching between reports. It helps teams spot problems, such as a support backlog or a stalled campaign, while there is still time to act.
Geckoboard is a live dashboard tool that connects to Shopify, ad platforms, Zendesk and other tools ecommerce teams already use. Dashboards update automatically, so during Black Friday and Cyber Monday every team has a current view of trading, marketing and support performance.
Common metrics include total sales versus target, order volume, ad spend and click-through rate, product and discount code performance, support queue length and response time, and website or app availability. Which metrics matter most depends on whether the dashboard is built for trading, marketing, support or a company-wide view.
Building a custom Black Friday dashboard is straightforward with Geckoboard's dashboard builder. Connect Shopify for sales, Google Ads or Facebook Ads for campaign performance, and Zendesk for support data, then pick your metrics and build the view your team needs. Share it as a TV dashboard, shared link, or scheduled snapshot. Start a free trial or learn more about how Geckoboard works.
Use it to put live trading performance on a screen the whole business can see, coordinate a faster response when support queues or site availability slip, and keep marketing and merchandising decisions grounded in what is actually selling.