Zendesk employee service dashboard examples
Internal service teams rarely deal with just one type of request — IT, HR, facilities, and access requests land in the same queue and compete for the same capacity. This dashboard gives the whole team a shared view of demand, responsiveness, and employee experience across all of them.
Zendesk employee service dashboard
What’s on the dashboard
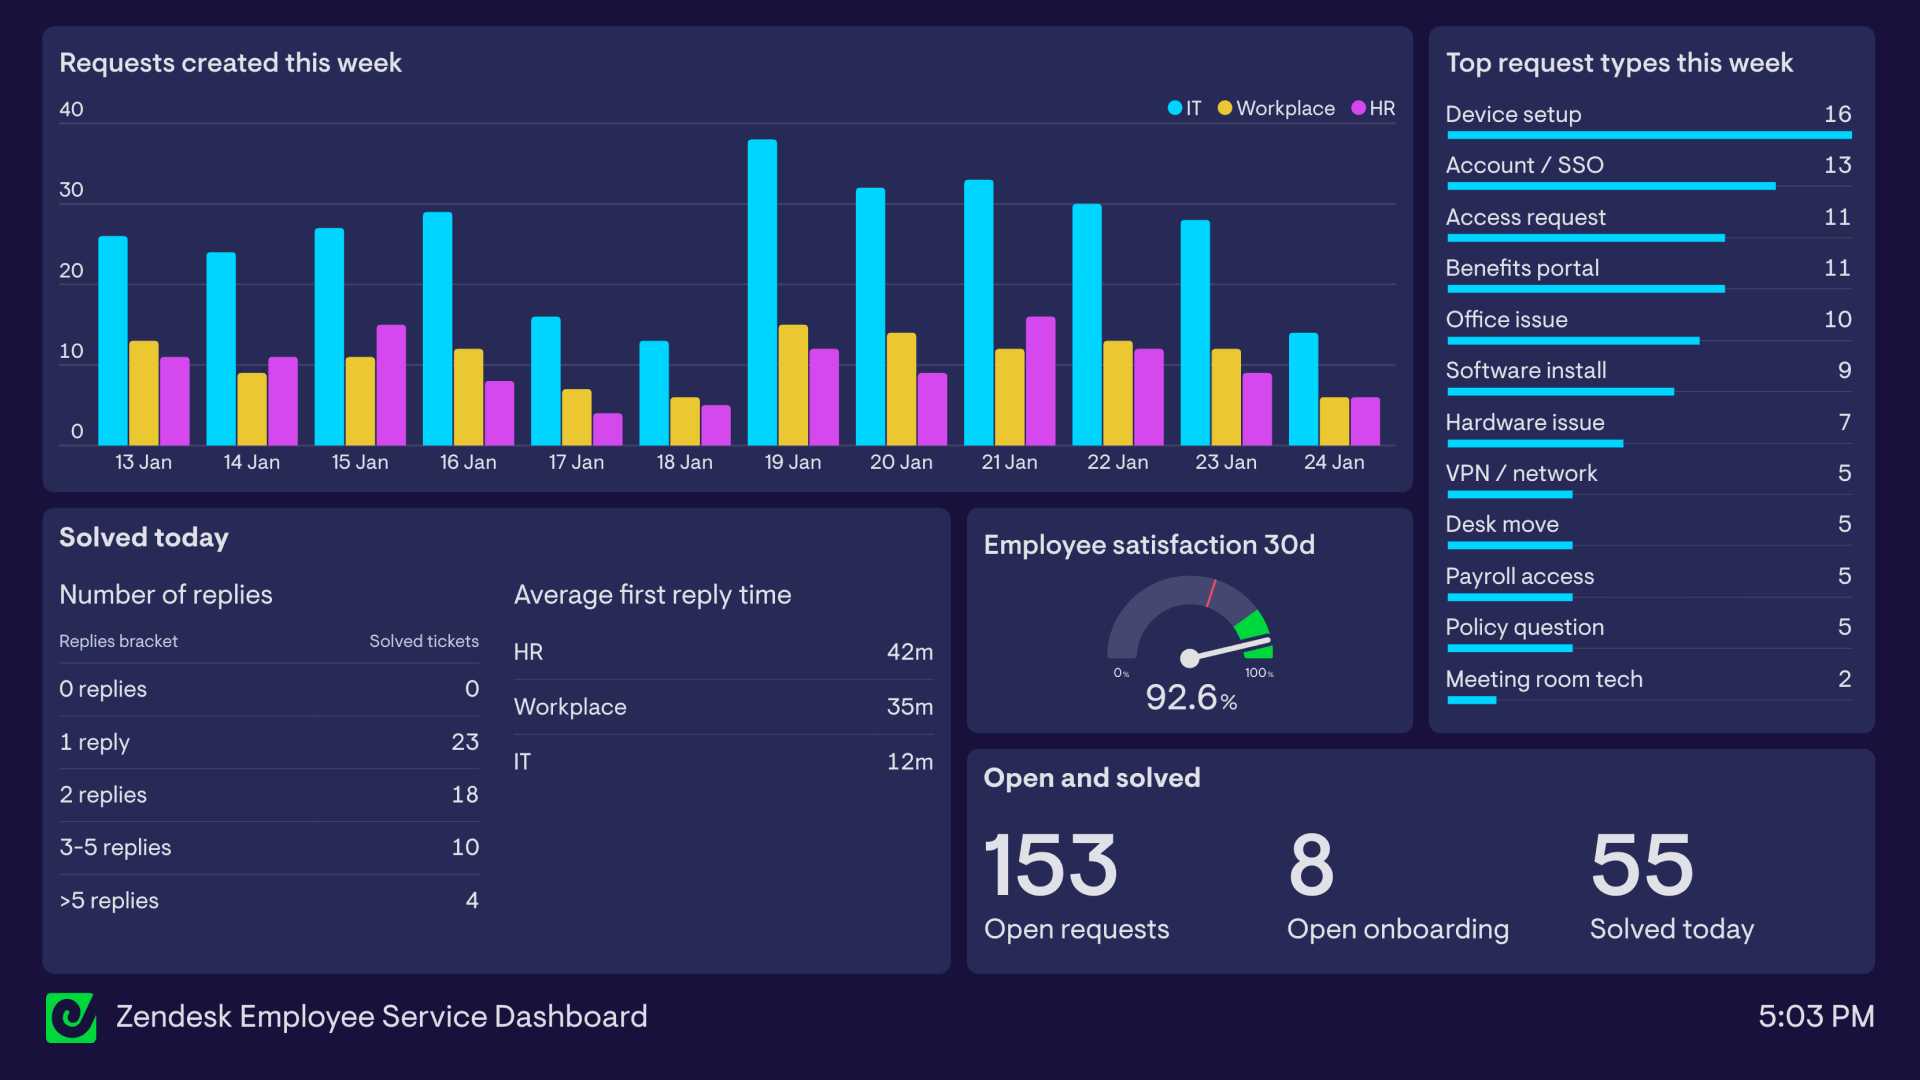
Requests created this week Series: IT, Workplace, HR. Why it matters: shows demand shape and which team is carrying volume this week.
Top request types this week (ranked bar list) Examples: device setup, account/SSO, access request, benefits portal, office issue, software install, hardware issue, VPN/network, desk move, payroll access, policy question, meeting room tech. Why it matters: makes repeatable work obvious - and helps teams prioritise self-serve, templates, and automation.
Solved today Reply brackets: 0 replies, 1 reply, 2 replies, 3–5 replies, >5 replies. Why it matters: quick sense-check of complexity today. If “3–5 replies” and “>5 replies” climb, the desk is dealing with harder work.
Average first reply time (by team) Rows: HR, Workplace, IT. Why it matters: highlights bottlenecks and sets expectations internally (especially during onboarding spikes).
Employee satisfaction 30d (gauge) What it shows: rolling satisfaction (for example: 92.6%). Why it matters: keeps employee experience visible alongside operations.
Open and solved (number tiles) What it shows: Open requests, Open onboarding, and Solved today. Why it matters: gives a clean “health snapshot”: what’s outstanding, what’s urgent (onboarding), and whether throughput is keeping up.
FAQ
What’s the difference between employee service and ITSM? ITSM is typically the IT service desk discipline. Employee service is the broader internal support model across IT, workplace, and HR — often sharing tooling, categories, and SLAs.
What should you track first? Start with volume by team, top request types, first reply time, onboarding backlog, and a simple satisfaction measure (if you collect it). You can get sophisticated later.
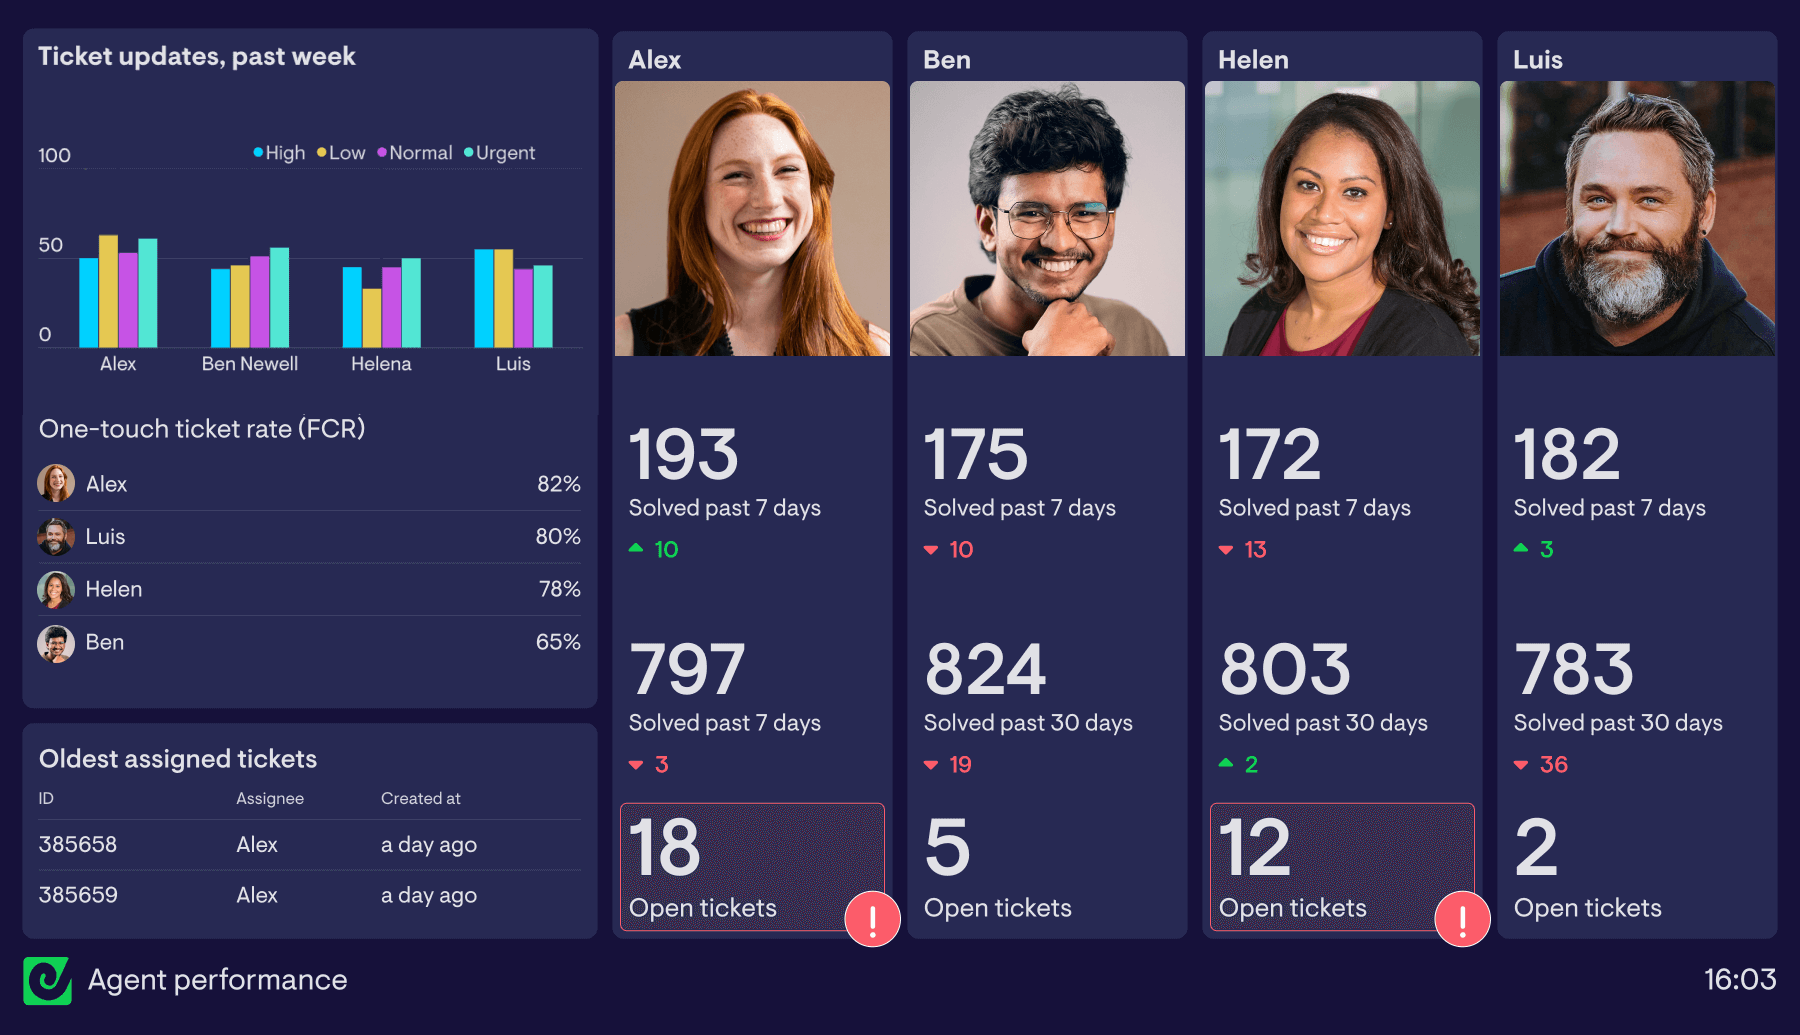
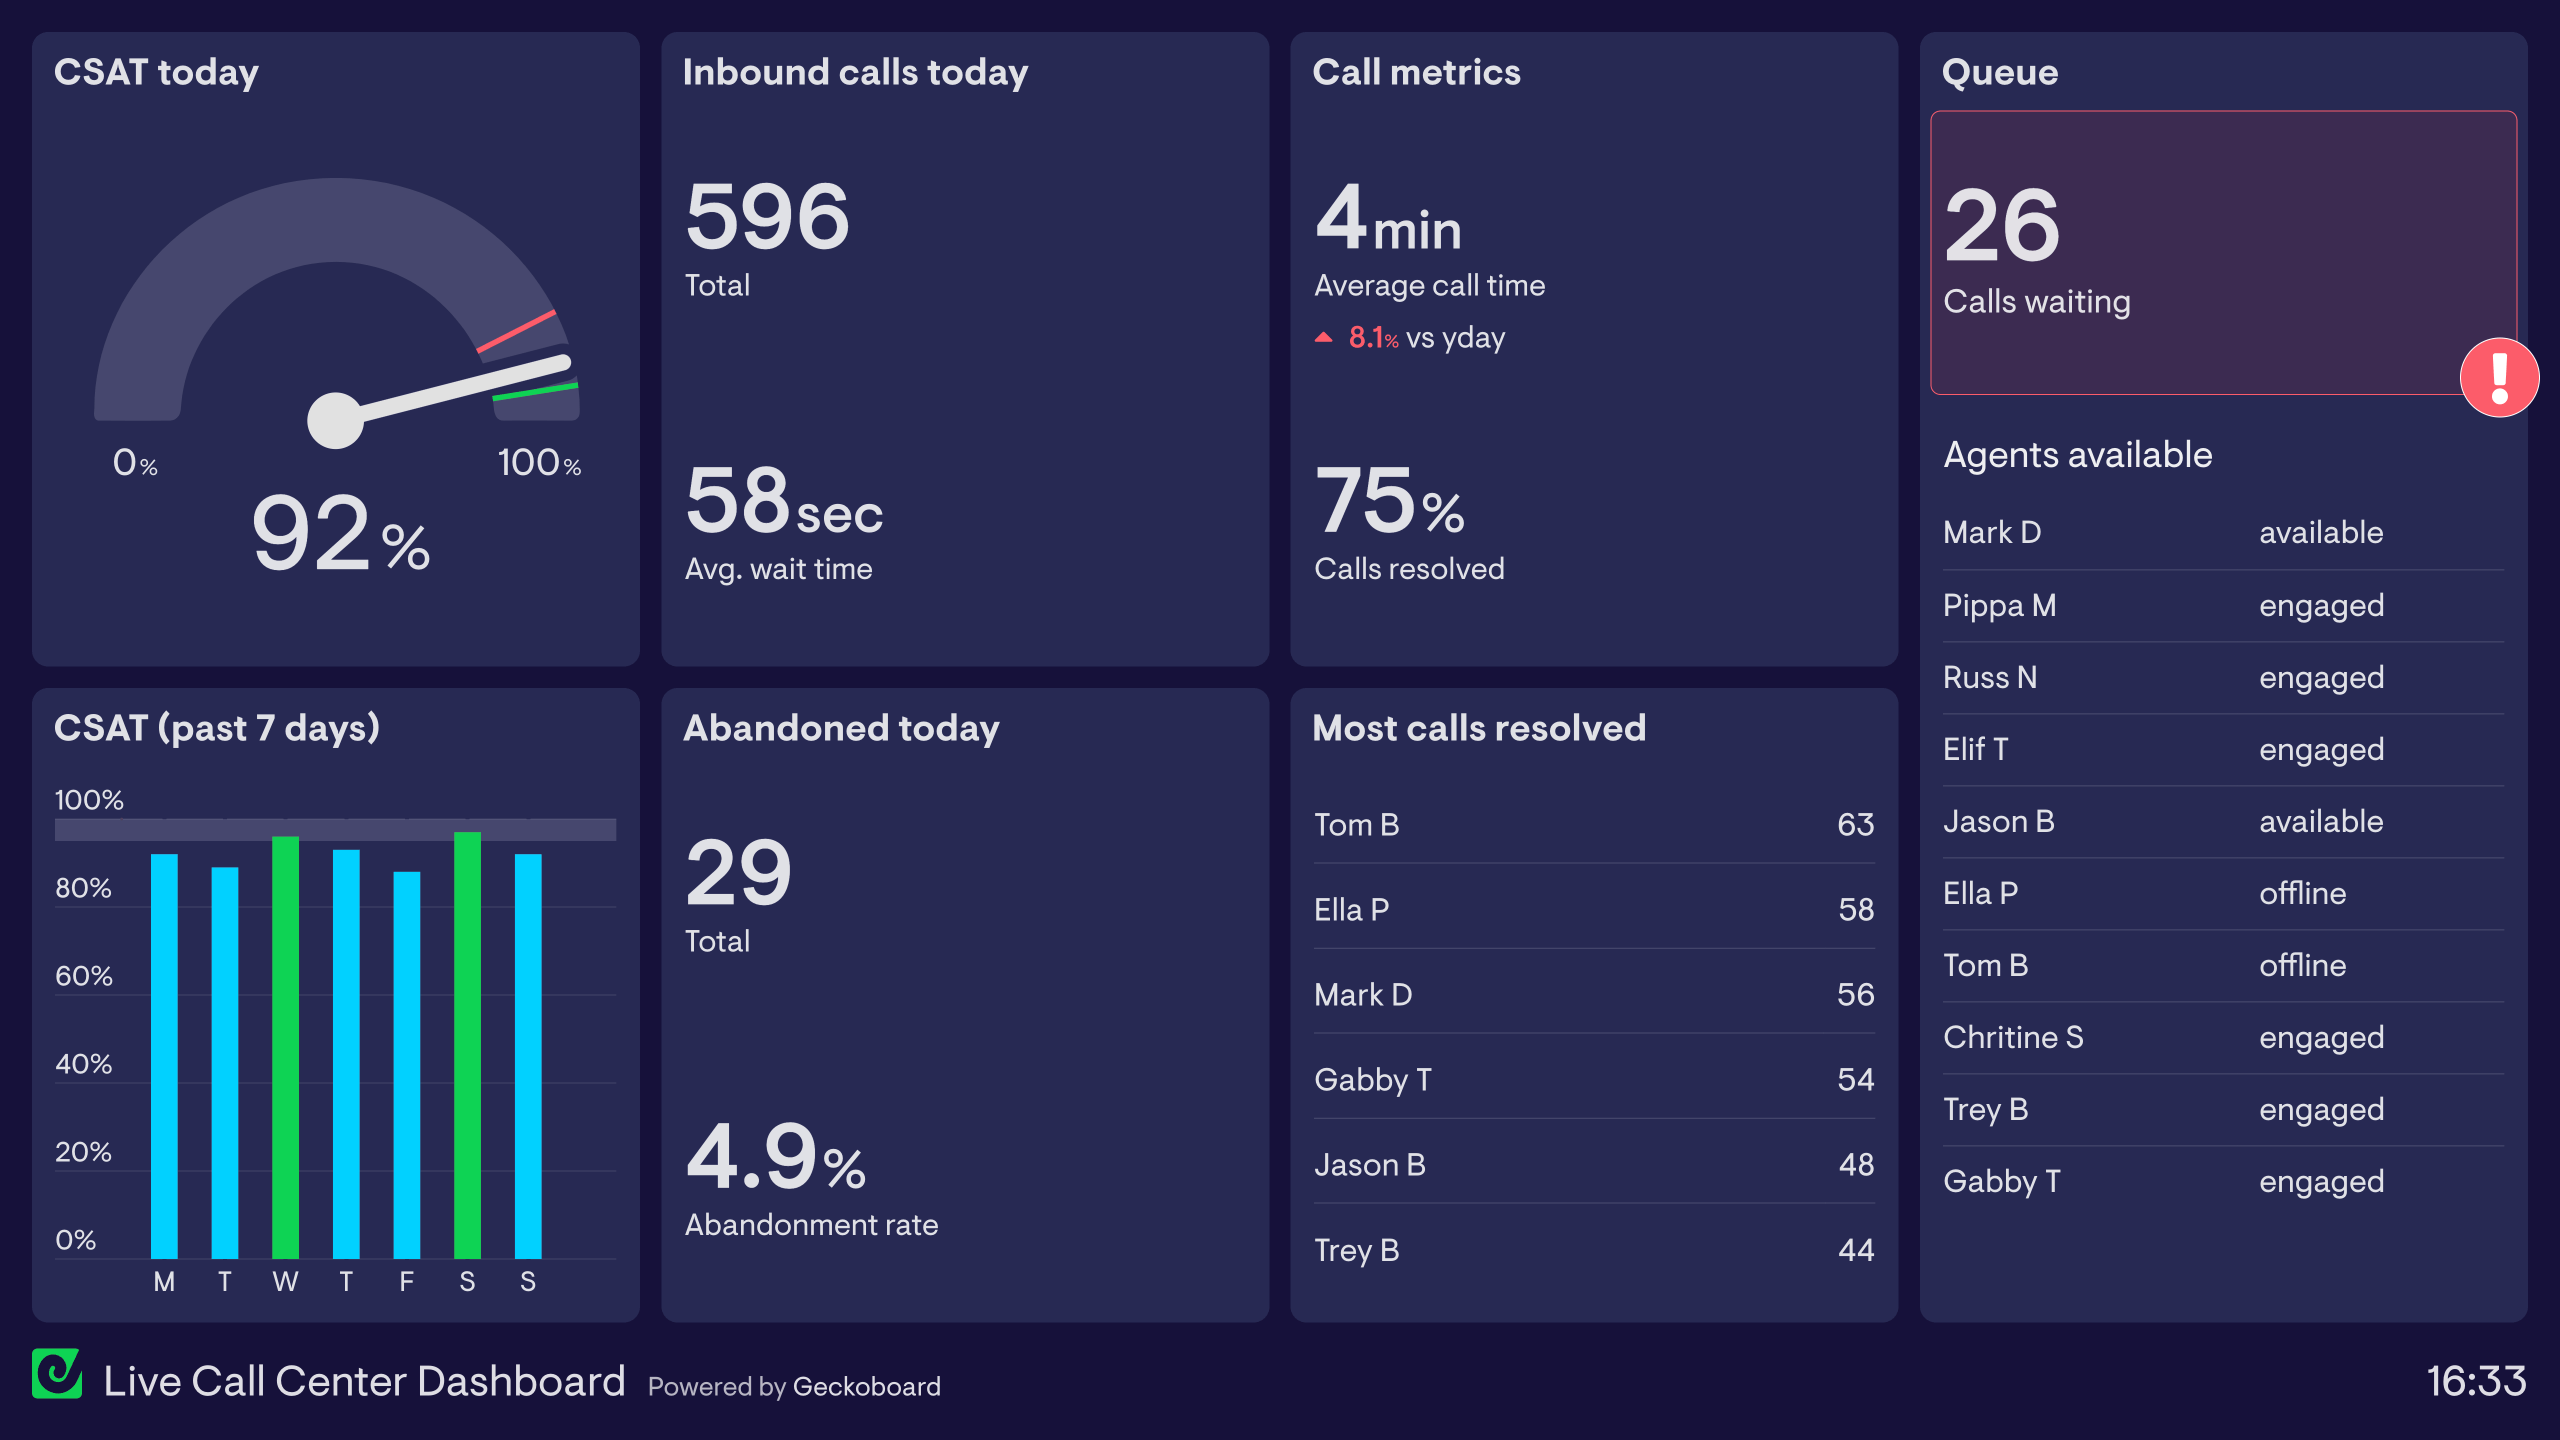
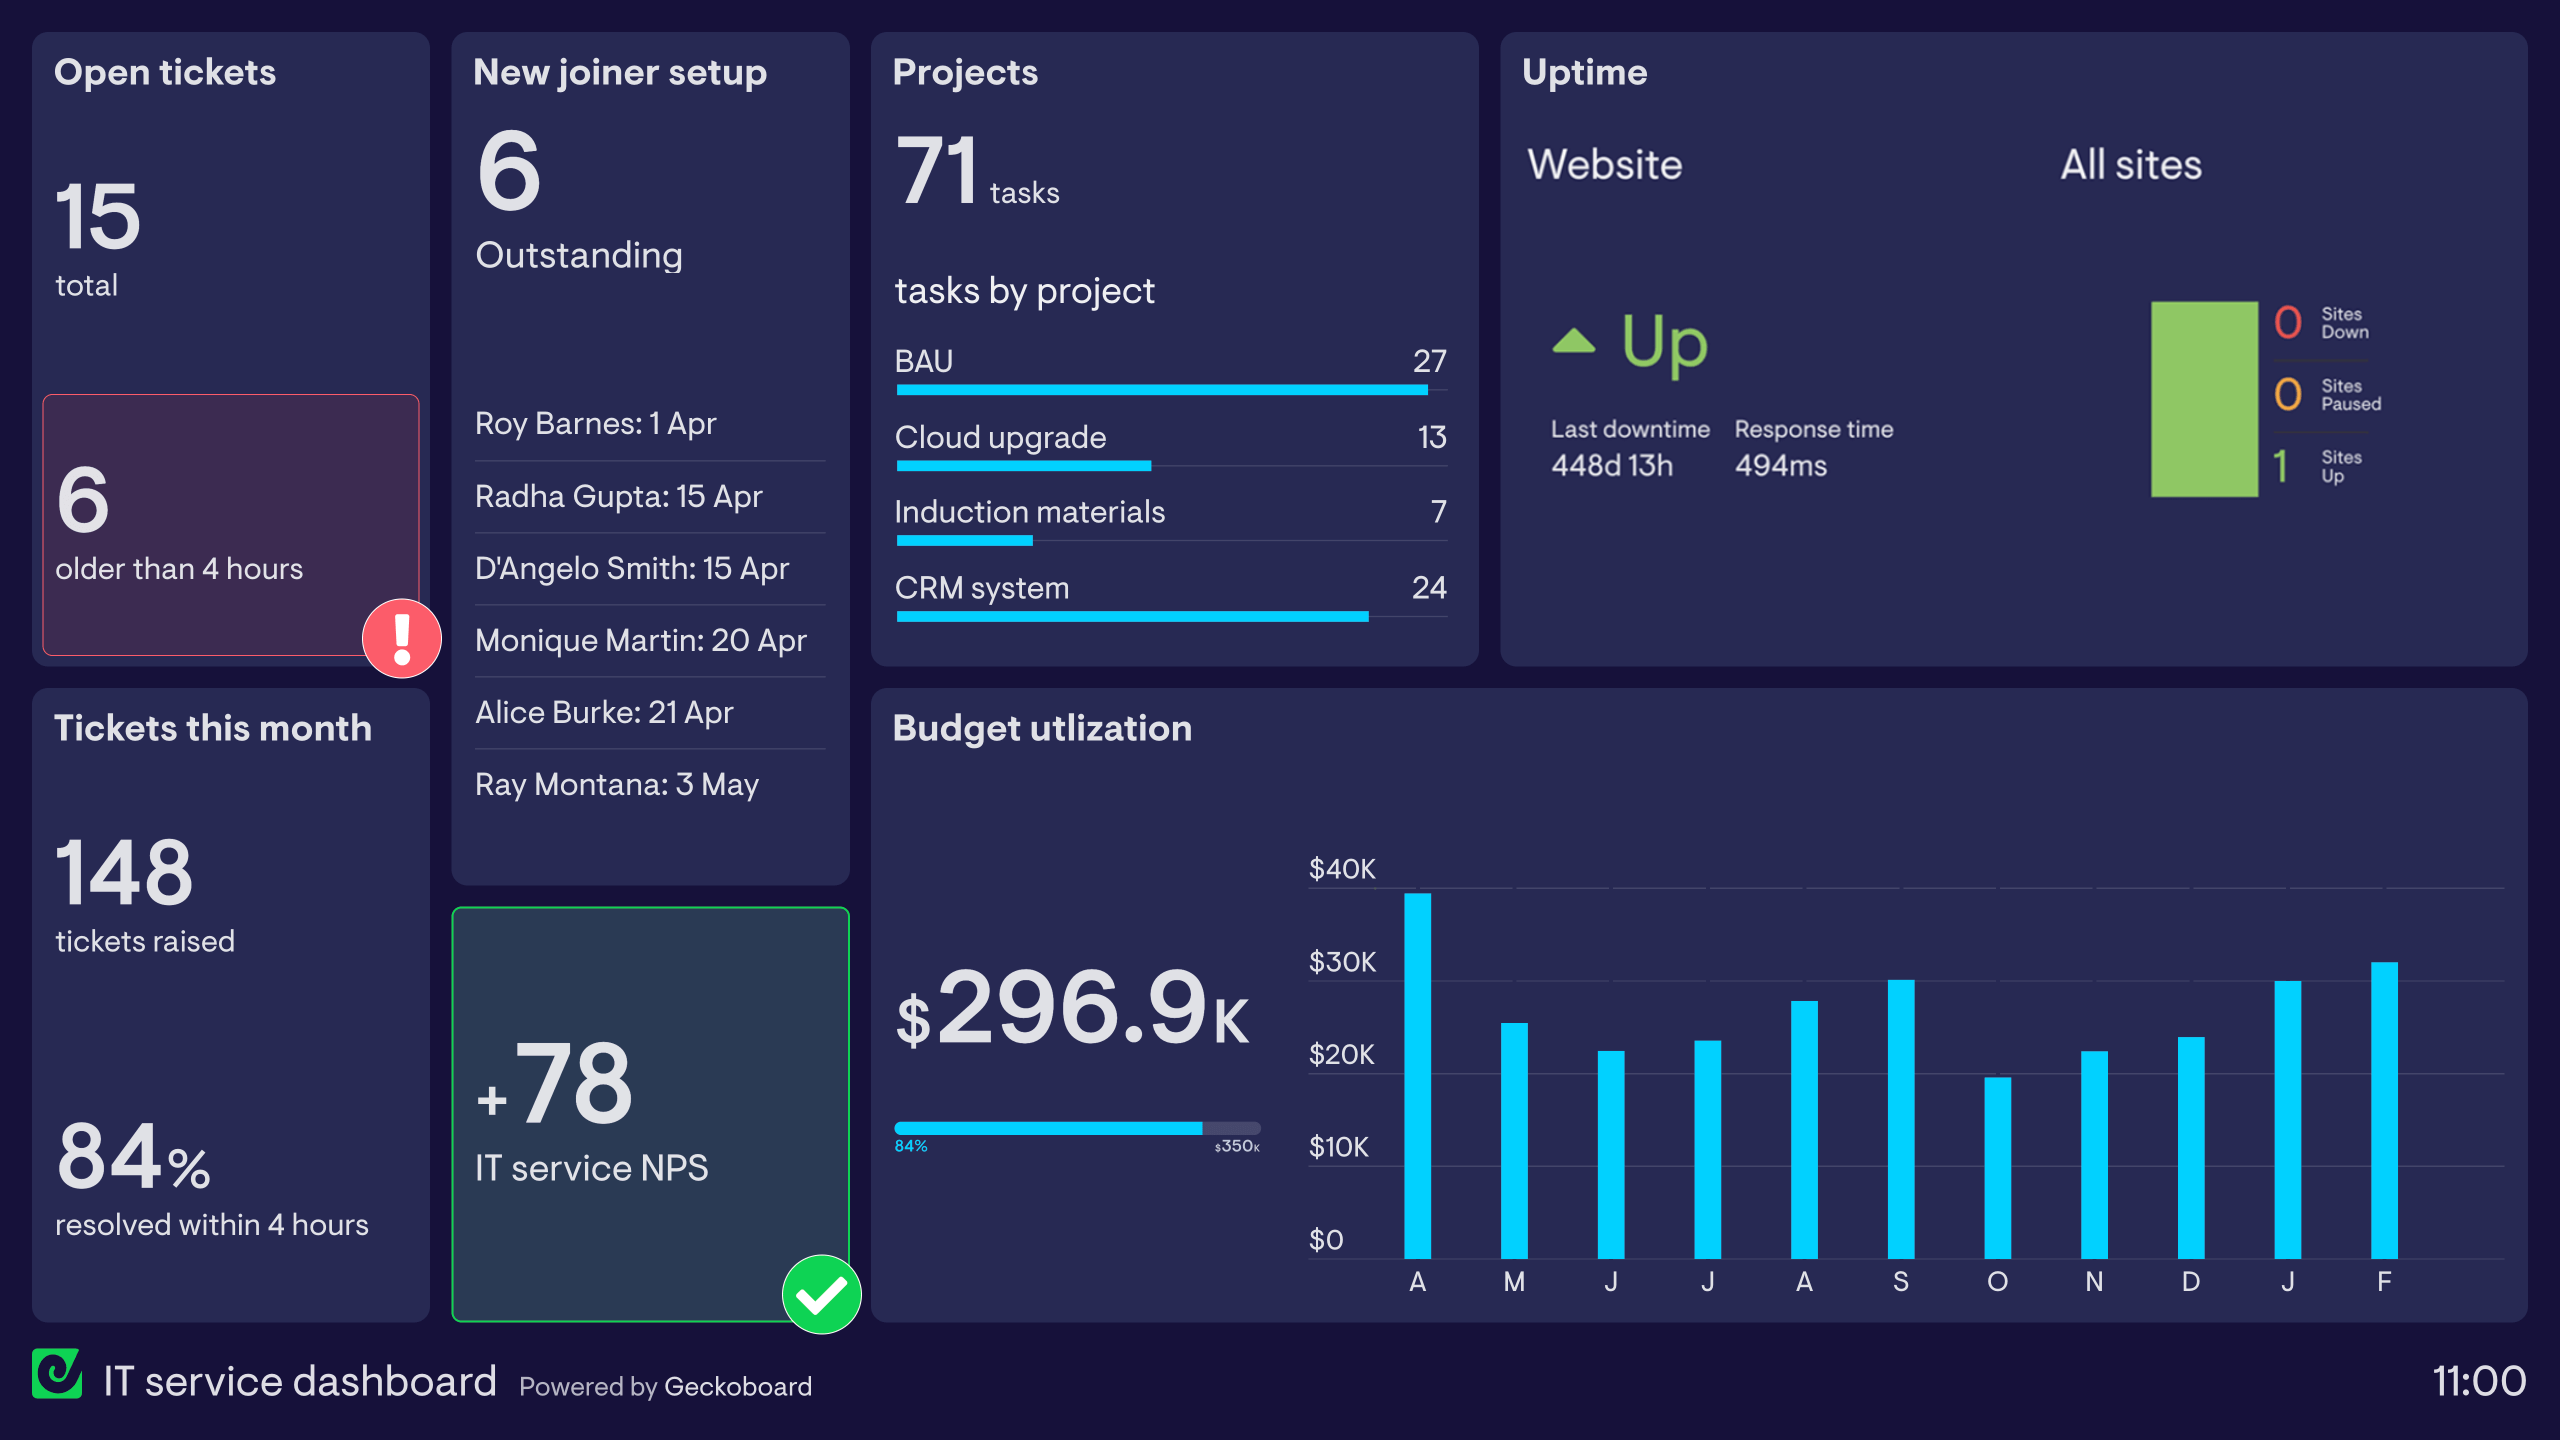
A Zendesk employee service dashboard tracks the performance of an internal IT or HR helpdesk built on Zendesk — monitoring ticket volume, resolution times, and employee satisfaction for internal service requests. It helps IT and HR teams ensure employees get fast, consistent service and gives managers visibility into internal support demand.
Geckoboard is a live dashboard tool that connects to Zendesk Support alongside spreadsheets and your other internal tools to display service desk metrics on a shared screen. It's used by IT, HR, and facilities teams who need a live view of demand and service levels — visible to the whole team, not just the manager.
Key metrics include open employee tickets, tickets resolved, time to first response, average resolution time, CSAT from employees, and tickets by department or request type.
Building a custom Zendesk employee service dashboard is straightforward with Geckoboard's dashboard builder. Connect Zendesk Support to pull internal helpdesk ticket and agent data into a live dashboard, then pick your metrics and build the view you need. Share with your team as a TV dashboard, shared link, or scheduled snapshot. Start a free trial or learn more about how Geckoboard works.
Use it to see internal ticket backlogs building so IT and HR teams can address them before employee satisfaction suffers. You can also send leadership scheduled snapshots of service performance, which helps IT leaders make the case for team capacity or tooling investment.