Zendesk service desk dashboard examples
This dashboard is built for the day-to-day work of running an internal service desk — keeping the queue healthy, catching SLA risk before it becomes a breach, and making workload visible across the team. If Zendesk is your ITSM tool, this gives you the live operational view that Zendesk's own reports don't.
Zendesk service desk dashboard
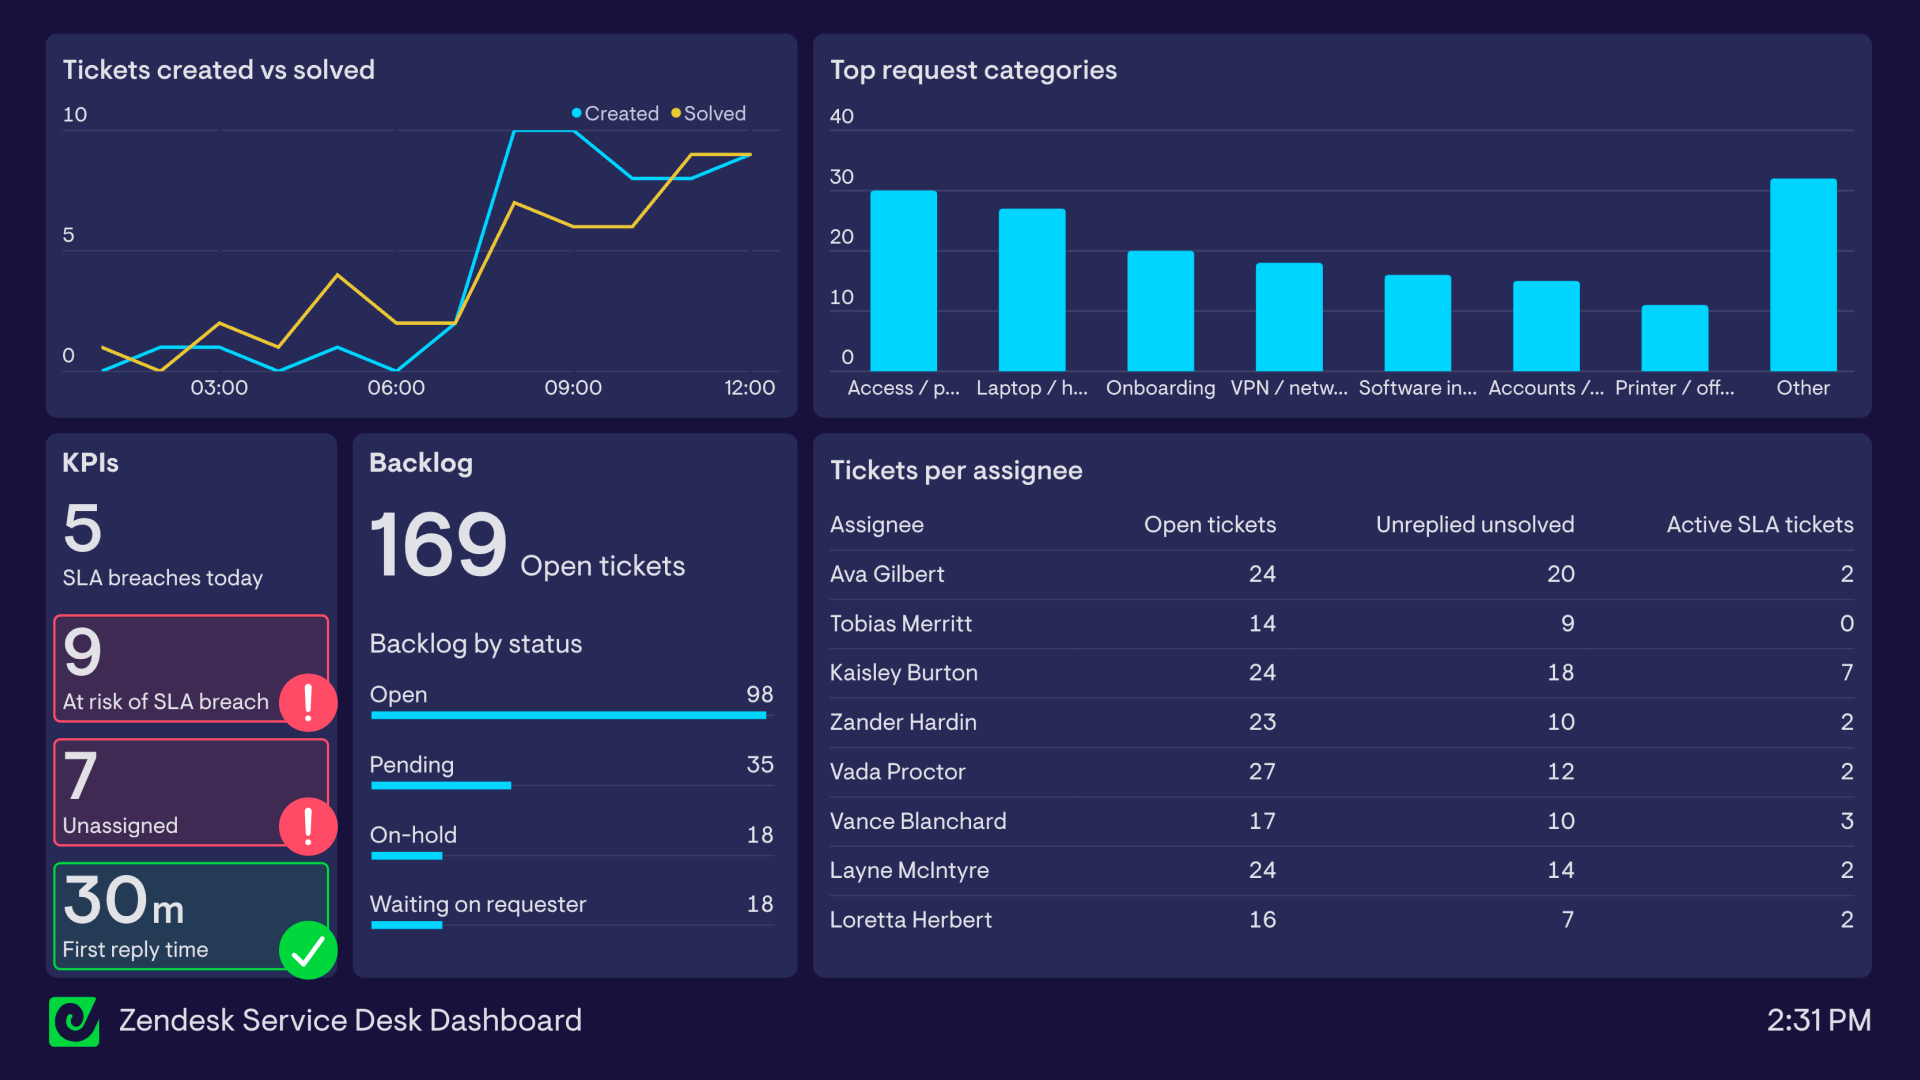
What’s on the dashboard
Tickets created vs solved (line chart) What it shows: created and solved tickets over the last few hours. Why it matters: if created is outpacing solved, you’re accumulating debt. If solved is higher, you’re recovering.
Top request categories (bar chart) What it shows: current demand mix by category (access, hardware, onboarding, VPN/network, software installs, accounts/SSO, printer/office, other). Why it matters: gives quick context for why the queue looks the way it does - and highlights where self-serve or automation could remove volume.
KPIs SLA breaches today: what’s already gone wrong today. At risk of SLA breach: the early warning you can act on. Unassigned tickets: hidden work; usually the fastest fix. First reply time: the speed metric employees actually feel.
Backlog Open tickets: the baseline queue size. Backlog by status: Open, Pending, On-hold, Waiting on requester. Why it matters: status mix explains whether you’re blocked (waiting), actively working (open), or stuck in limbo (on-hold).
Tickets per assignee (table) Columns: Open tickets, Unreplied unsolved, Active SLA tickets. Why it matters: this is the “capacity + risk” view in one place. Open tickets shows load, unreplied unsolved shows where first response is slipping, and active SLA tickets surfaces who has time-sensitive work.
How teams typically use it
In practice, this is the dashboard you glance at during the day:
- Morning kick-off (“are we already behind?”)
- Midday drift check (“is the backlog creeping?”)
- End-of-day handover (“what can’t wait?”)
FAQ
What should a Zendesk IT service desk dashboard include? Ticket flow (created vs solved), backlog size and status mix, SLA risk, first reply time, and workload by assignee.
Is this different from a customer support Zendesk dashboard? Yes — internal service desks tend to care more about backlog health, assignment, and operational drift than customer-facing metrics like CSAT.
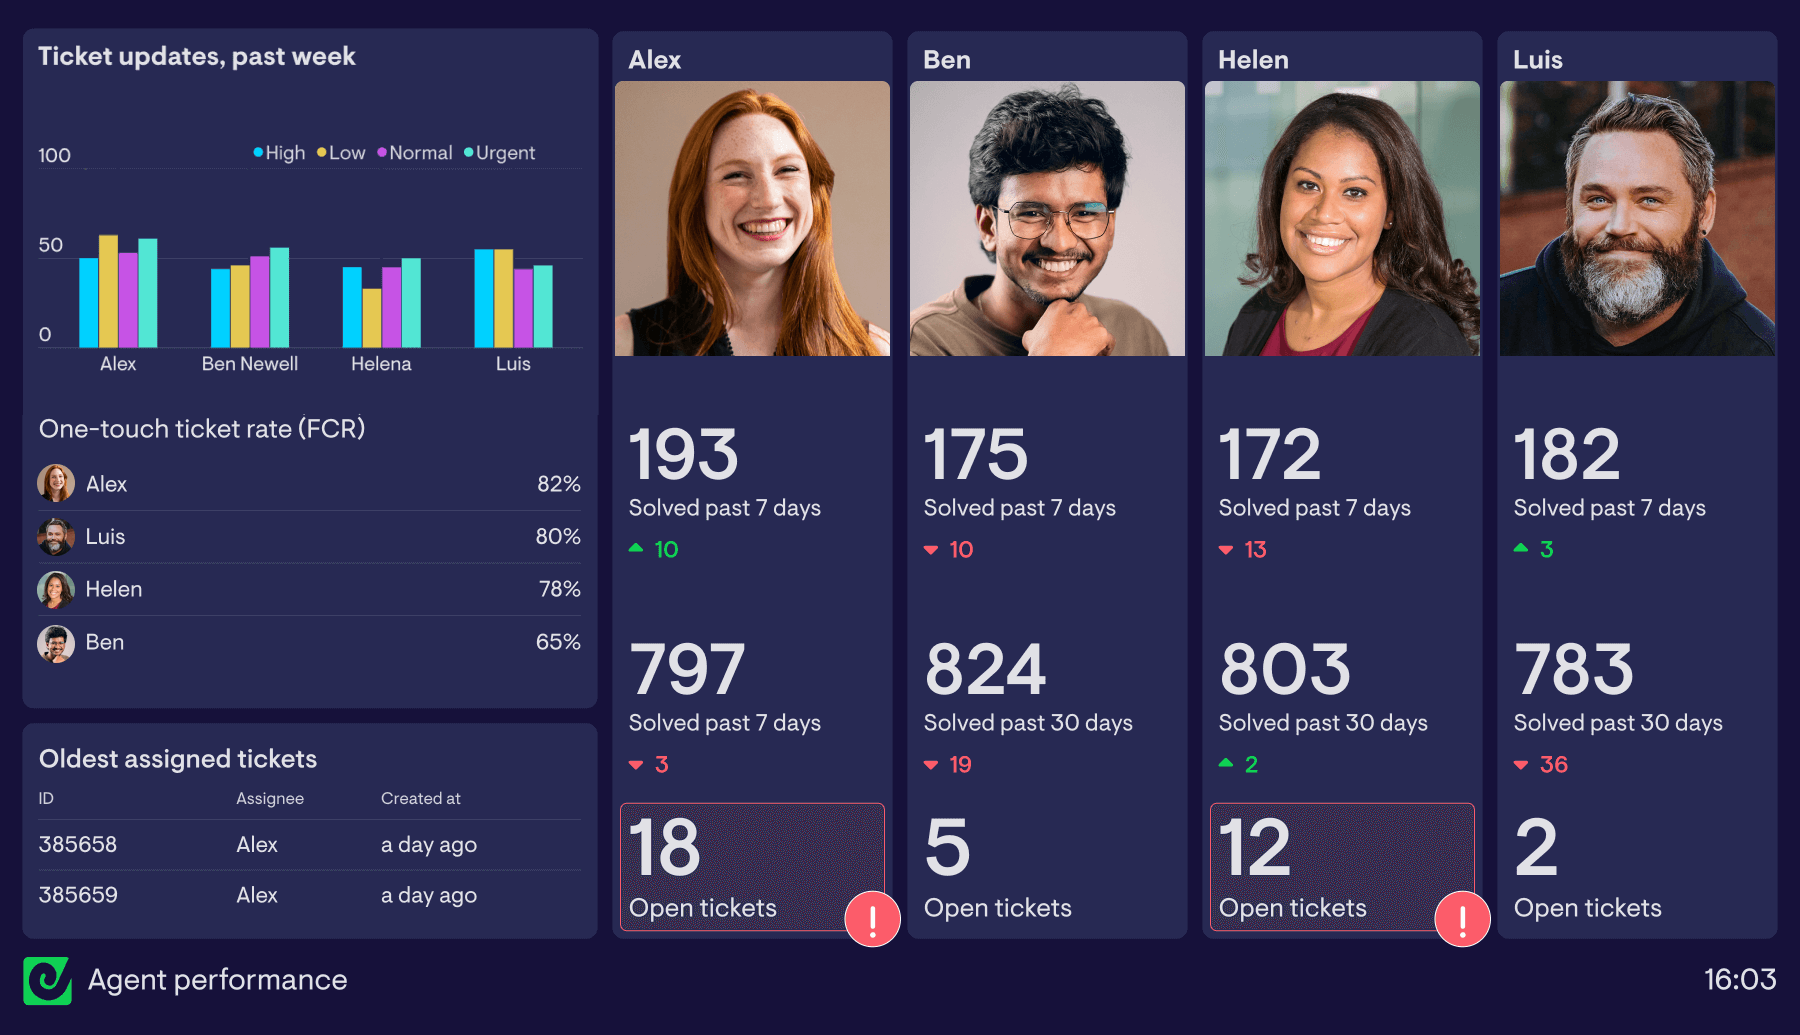
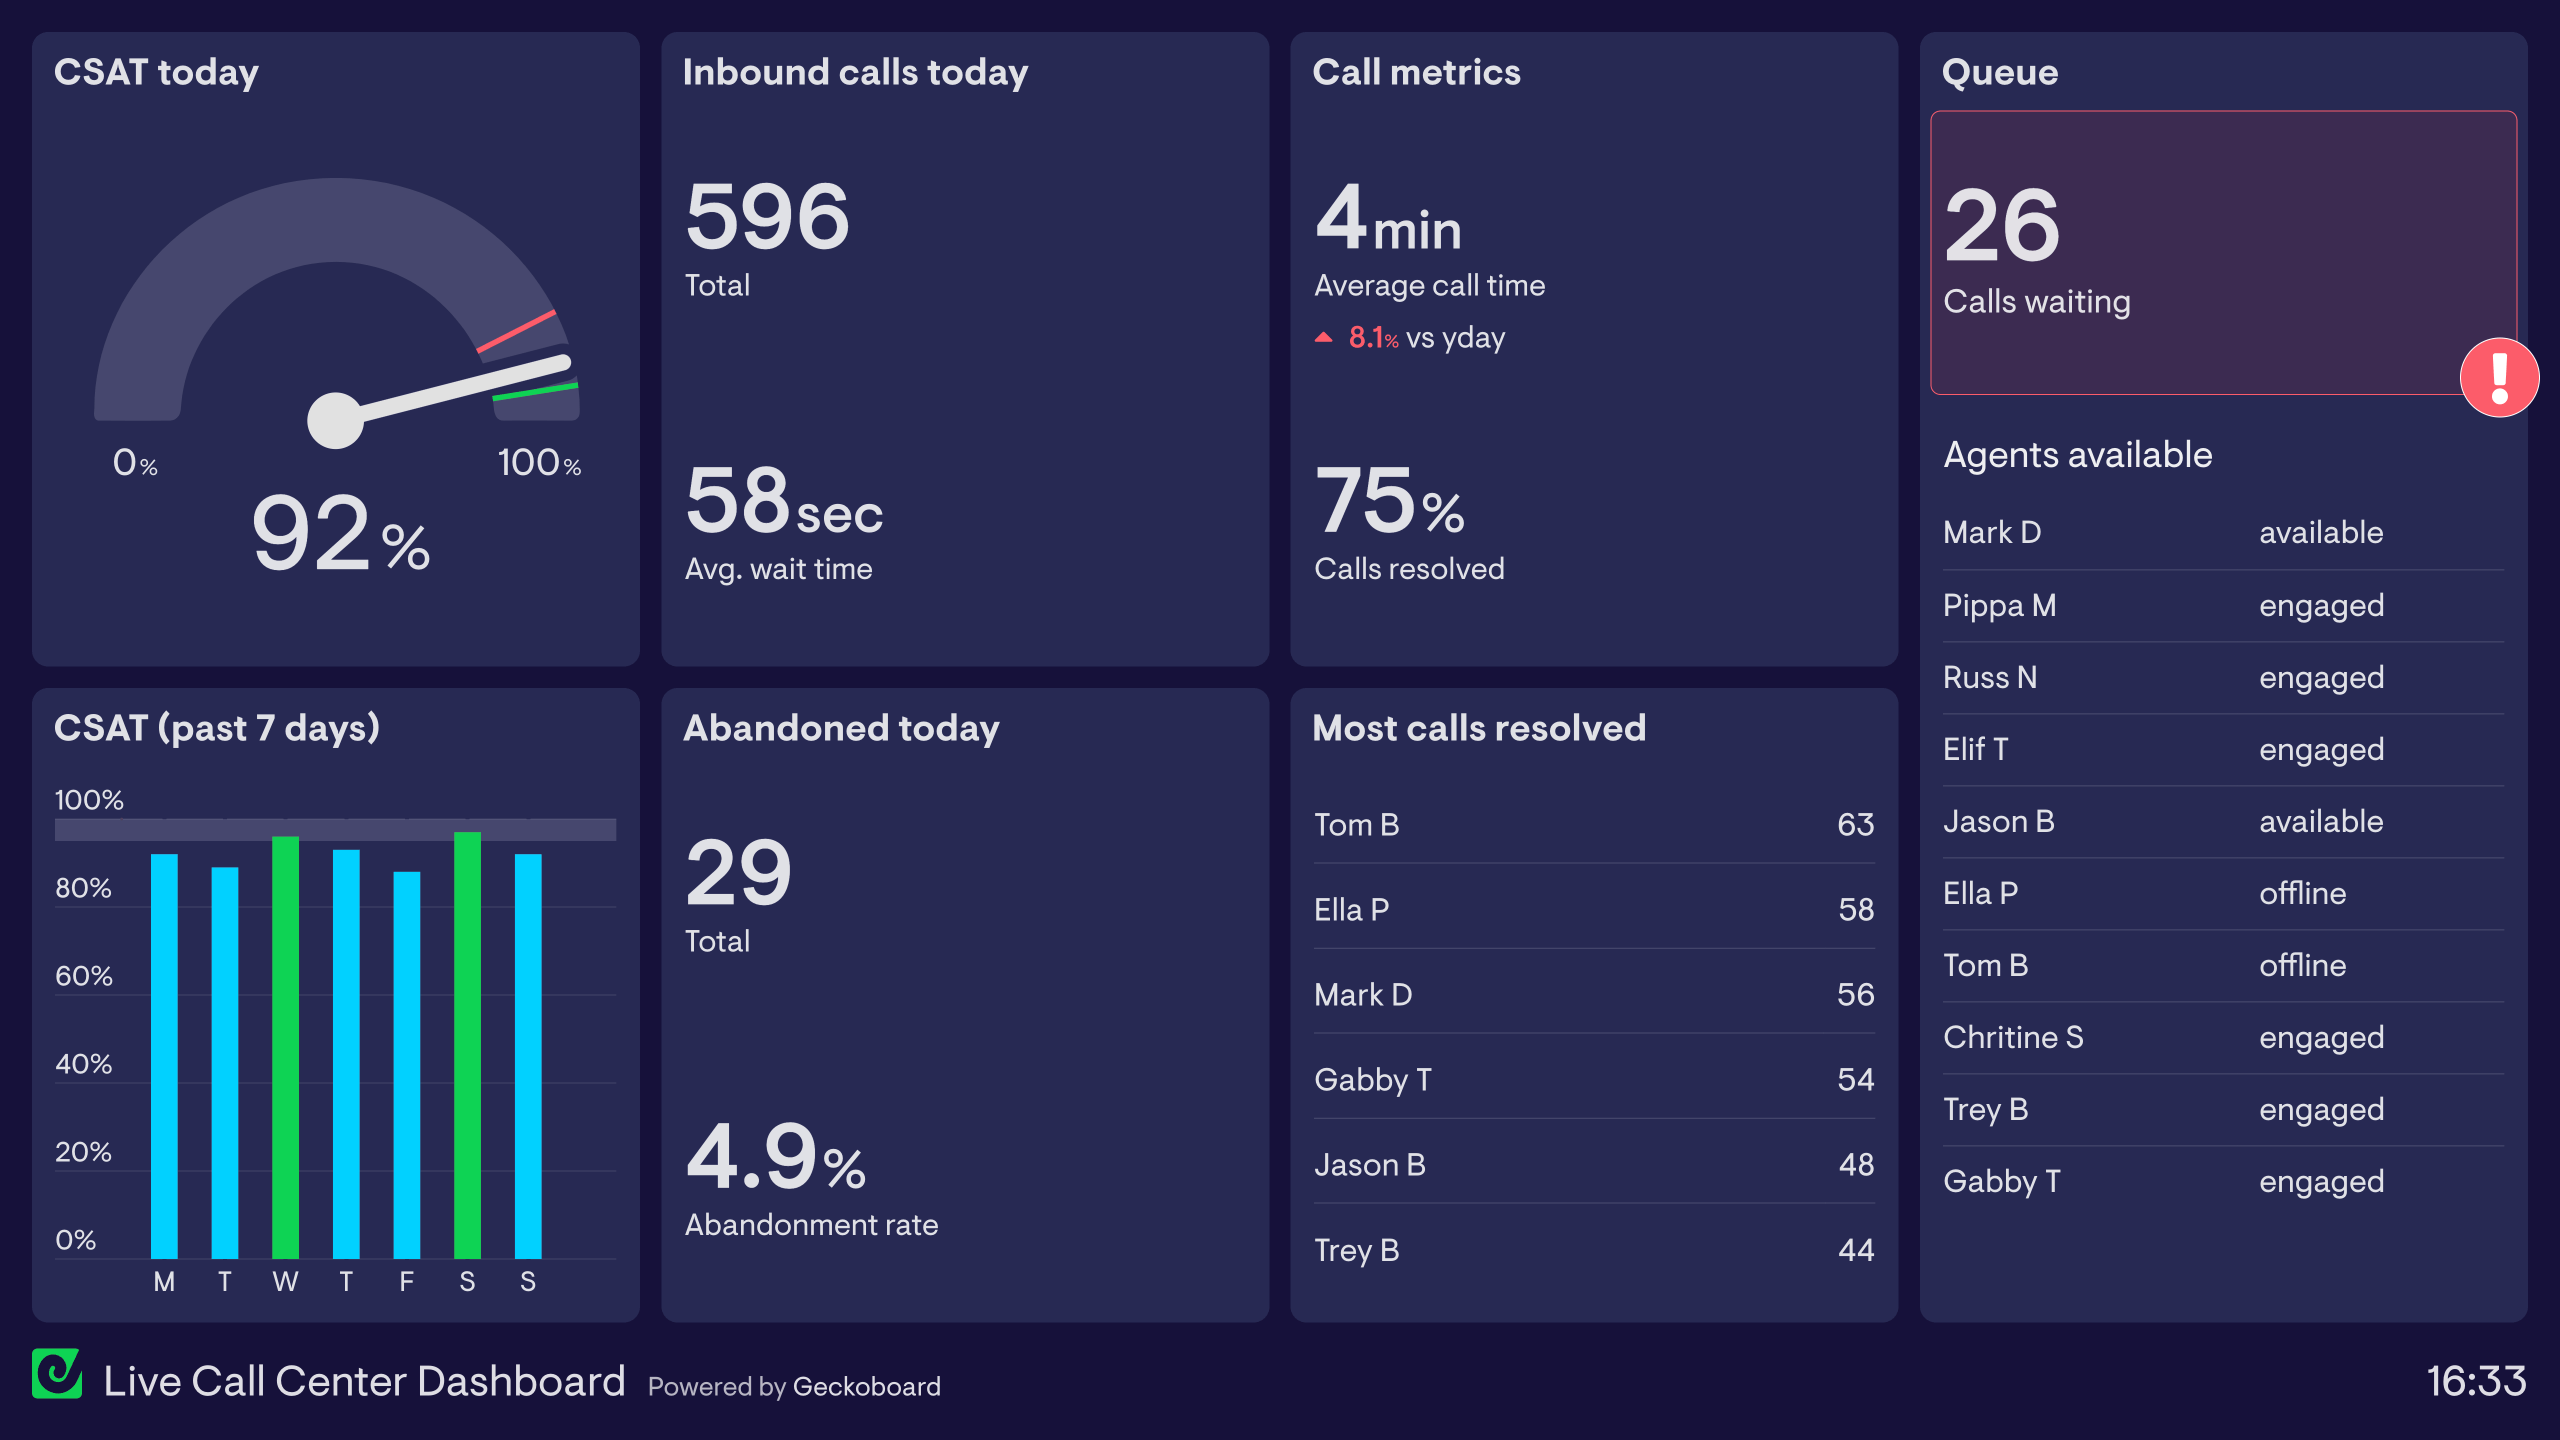
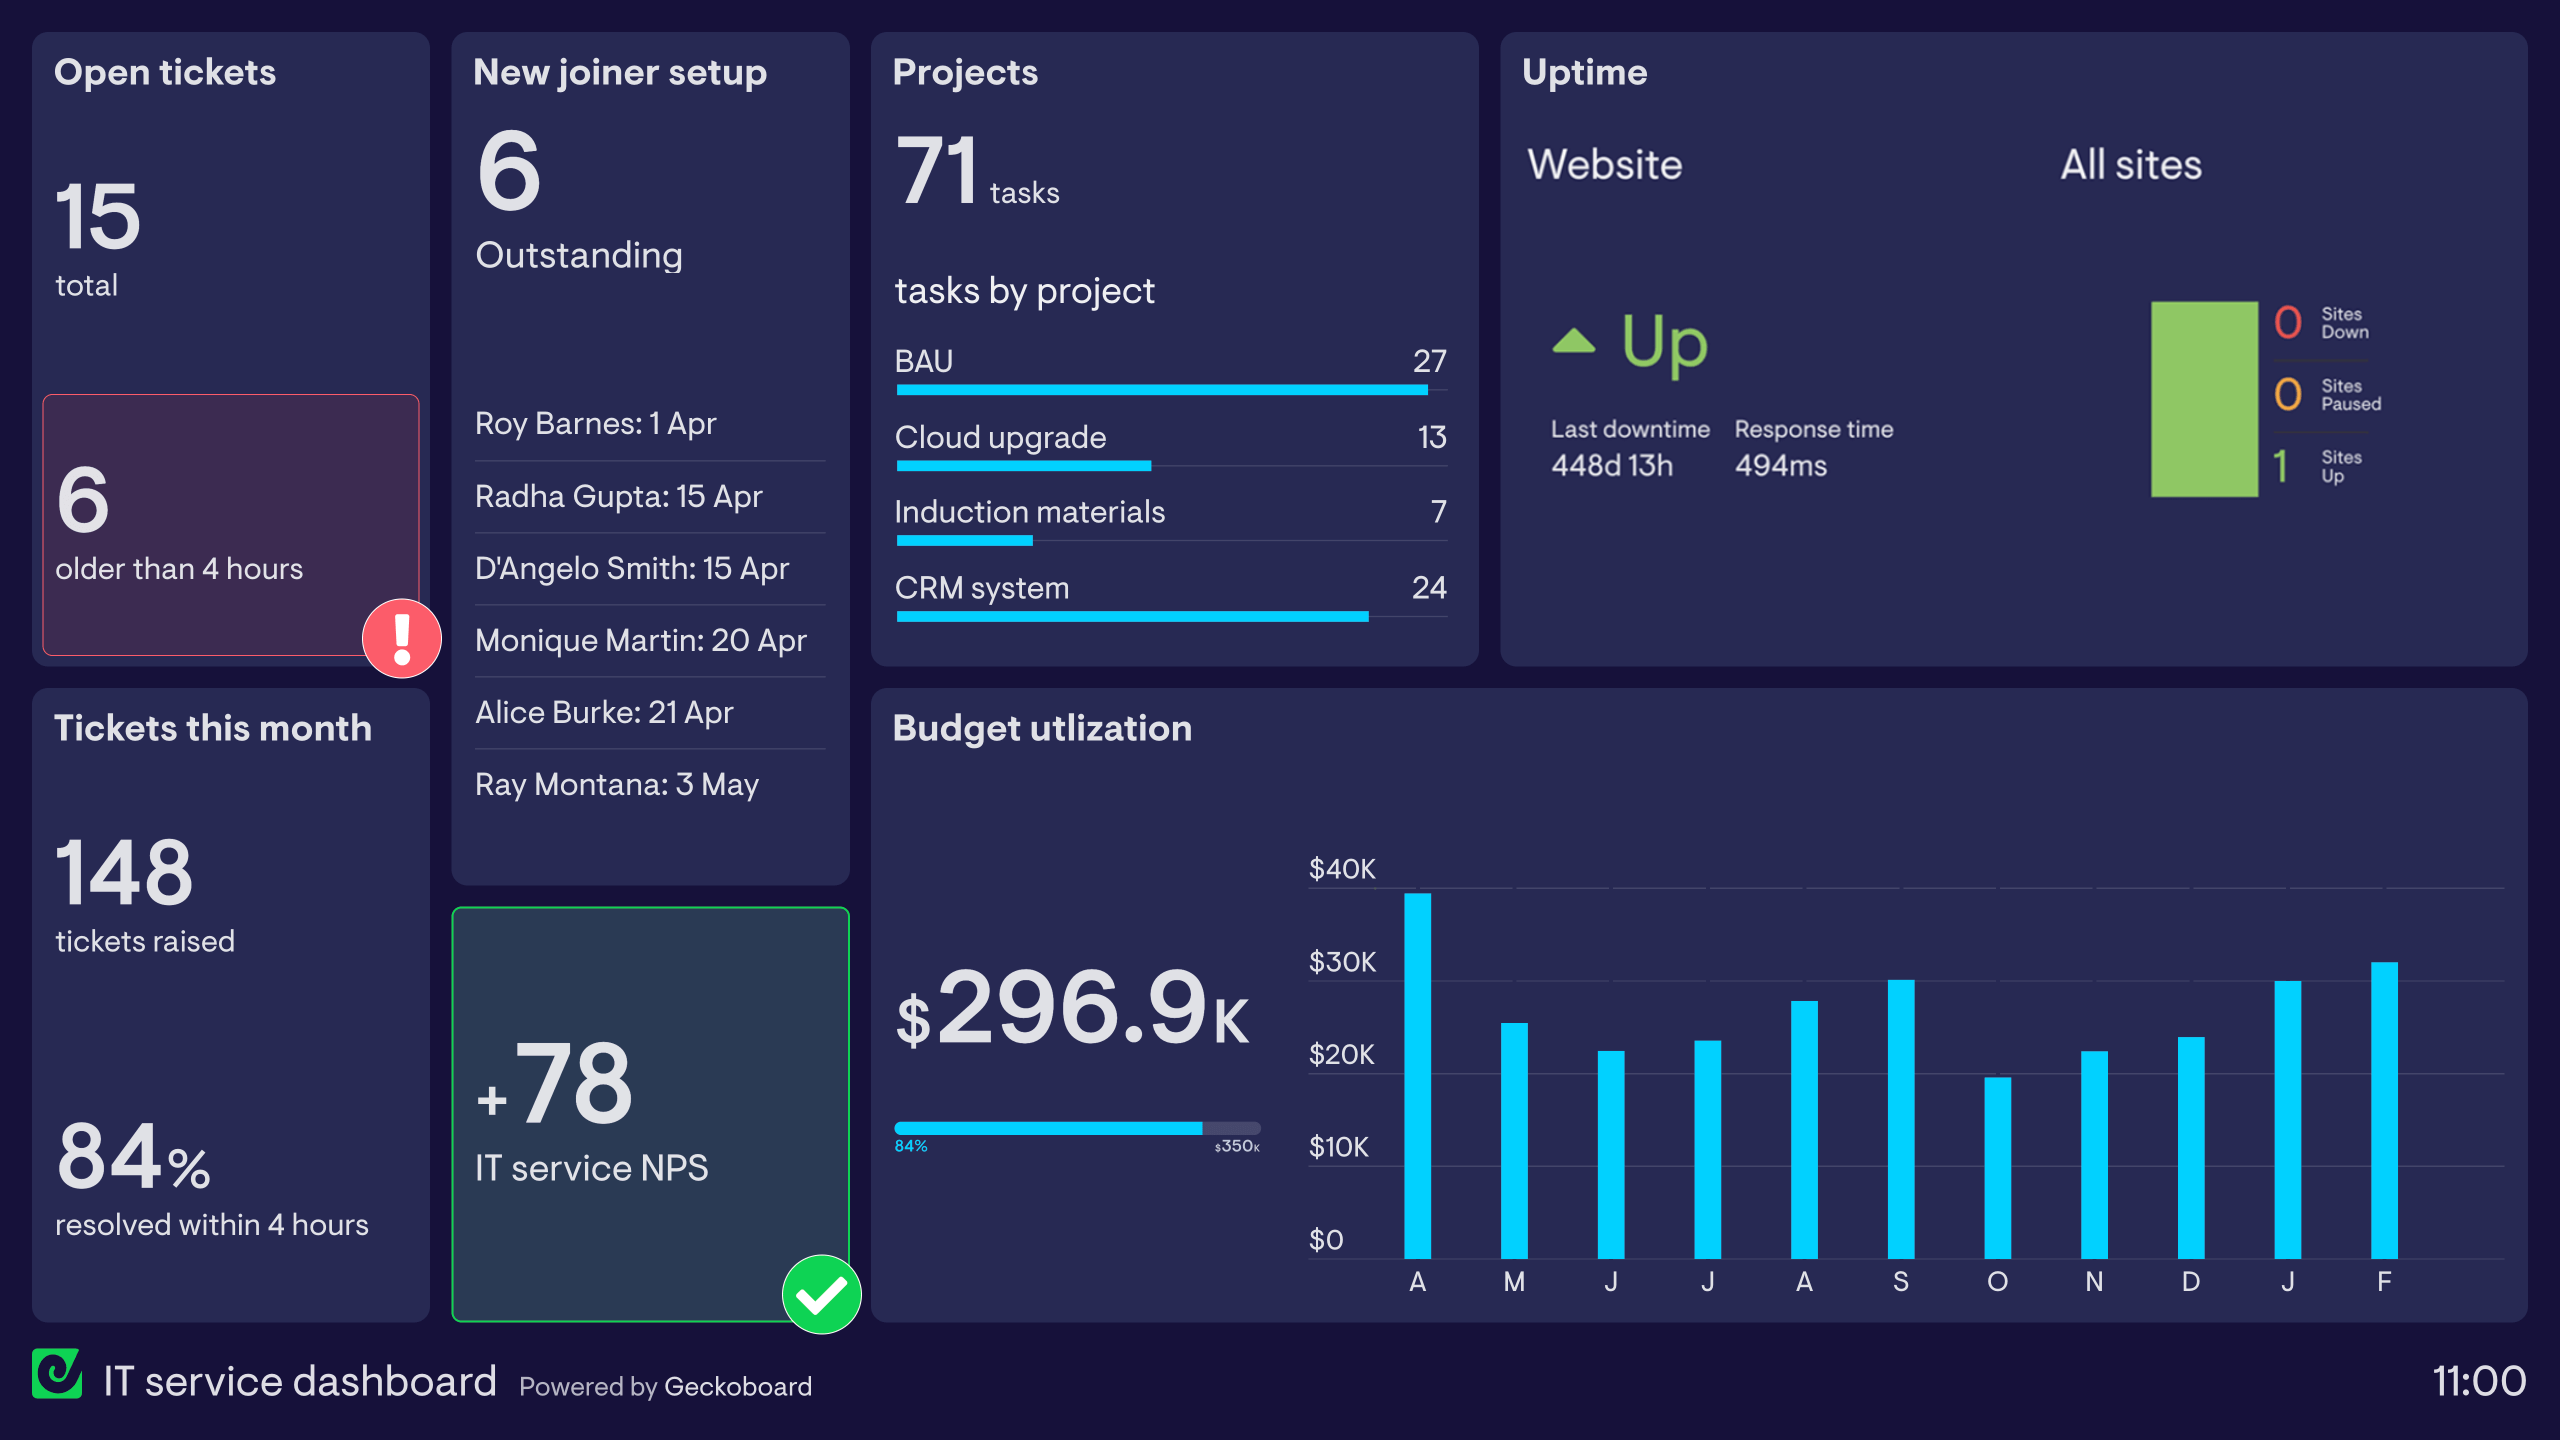
A Zendesk service desk dashboard gives IT service desk teams a real-time view of incoming requests, incident volume, resolution performance, and SLA compliance. It's designed for teams using Zendesk to manage IT support — replacing manual queue checks with a live shared view of what's open and what needs attention.
Geckoboard is a live dashboard tool that connects to Zendesk Support alongside spreadsheets and your other ITSM tools to display service desk metrics in real time. It's designed to sit on a screen in the service desk team's workspace — keeping ticket flow, backlog status, and SLA risk visible throughout the day.
Common metrics include open incidents and service requests, tickets by priority, first response time, resolution time, SLA compliance, and agent workload. ITSM teams often track these by ticket category to see where IT demand is concentrated.
Building a custom Zendesk service desk dashboard is straightforward with Geckoboard's dashboard builder. Connect Zendesk Support to pull IT service desk ticket and performance data automatically, then pick your metrics and build the view you need. Share with your team as a TV dashboard, shared link, or scheduled snapshot. Start a free trial or learn more about how Geckoboard works.
Use it to see high-priority incidents surfacing as they happen so IT service desk managers can assign resource immediately. It also helps display a live view of resolution metrics that keeps the service desk team focused and gives leadership confidence in IT support quality.