Zendesk SLA and backlog dashboard examples
Service desks don't usually fail suddenly — they drift. A few tickets age out, response times slip, and then breaches start arriving in clusters. This dashboard makes that drift visible early, with SLA performance, breach risk, and backlog trends on one screen.
Zendesk SLA and backlog dashboard
What’s on the dashboard
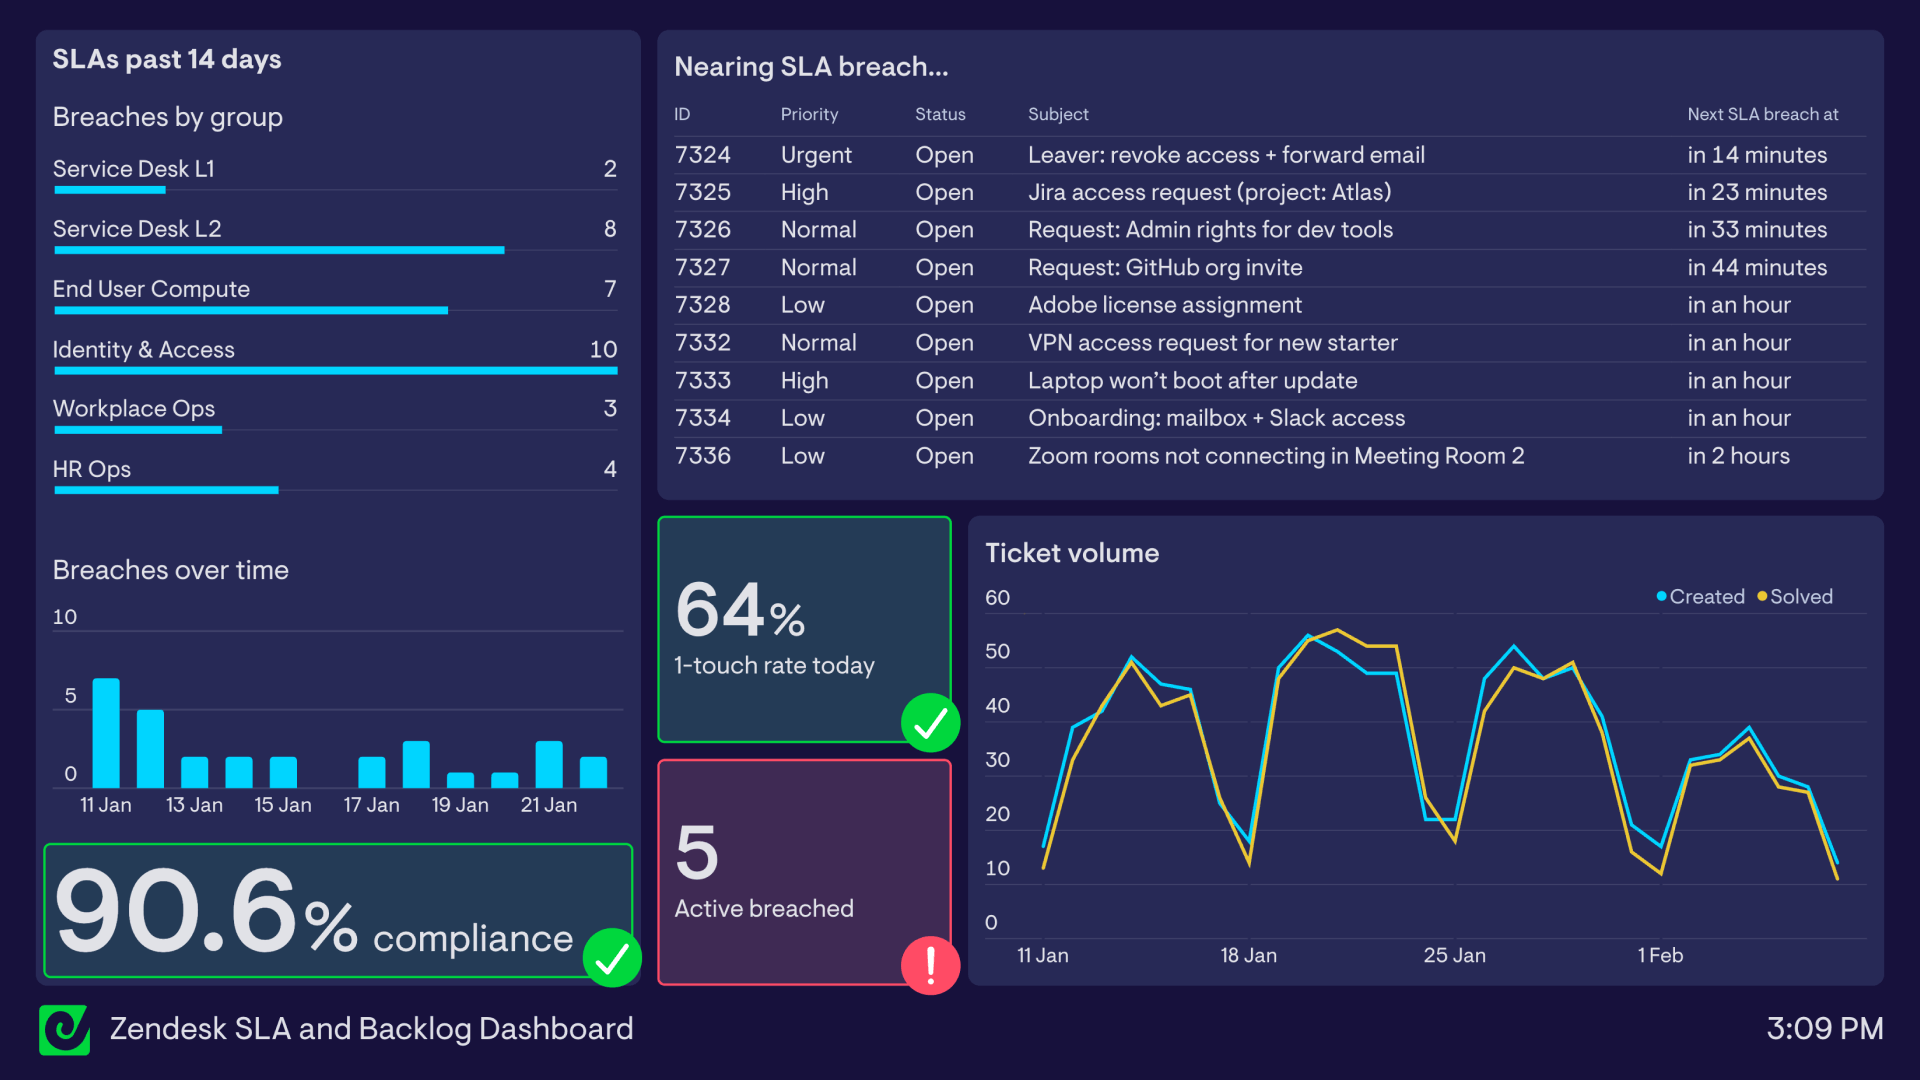
SLAs past 14 days (breaches by group) What it shows: breach count by group (Service Desk L1/L2, End User Compute, Identity & Access, Workplace Ops, HR Ops). Why it matters: turns “we’re missing SLAs” into “this is where it’s happening.”
Breaches over time (bar/column chart) What it shows: daily breach volume over the last 14 days. Why it matters: highlights clusters and whether you’re trending up or recovering.
Compliance (big number) What it shows: SLA compliance percentage (for example: 90.6%). Why it matters: executive-friendly signal that still maps to operational reality.
Nearing SLA breach (table) Columns: ID, Priority, Status, Subject, Next SLA breach at (expressed as “in 14 minutes”, “in an hour”, etc.). Why it matters: this is the “do this next” list. It turns SLA management into prioritised work, not a retrospective.
1-touch rate today (big number) What it shows: percentage of tickets resolved with one reply/touch. Why it matters: a useful proxy for quality and efficiency — and it often drops when work gets more complex.
Active breached (number tile) What it shows: tickets currently in breach (not just “breaches today”). Why it matters: prevents breaches becoming a background statistic.
Ticket volume (line chart: created vs solved) What it shows: created and solved volume over time (multi-week view). Why it matters: tells you if the desk is structurally under-capacity (created > solved) or recovering.
FAQ
What’s the difference between SLA breaches and tickets at risk of breach? Breaches are already missed. “Nearing breach” is the work you can still save - and usually the most valuable widget on the screen.
What’s a good SLA compliance rate? It depends on your SLA policy and business hours. Where teams get caught out is setting SLAs that don’t match capacity — then using “compliance” as a stick instead of a signal.