Stylo Scores dashboard examples
A Stylo Scores dashboard brings customer sentiment signals — frustration, urgency, and predicted CSAT — into the same real-time view as your Zendesk queue. It gives support leads visibility into how customers are feeling while tickets are still open, so you can act before the situation gets worse.
Stylo Scores dashboard
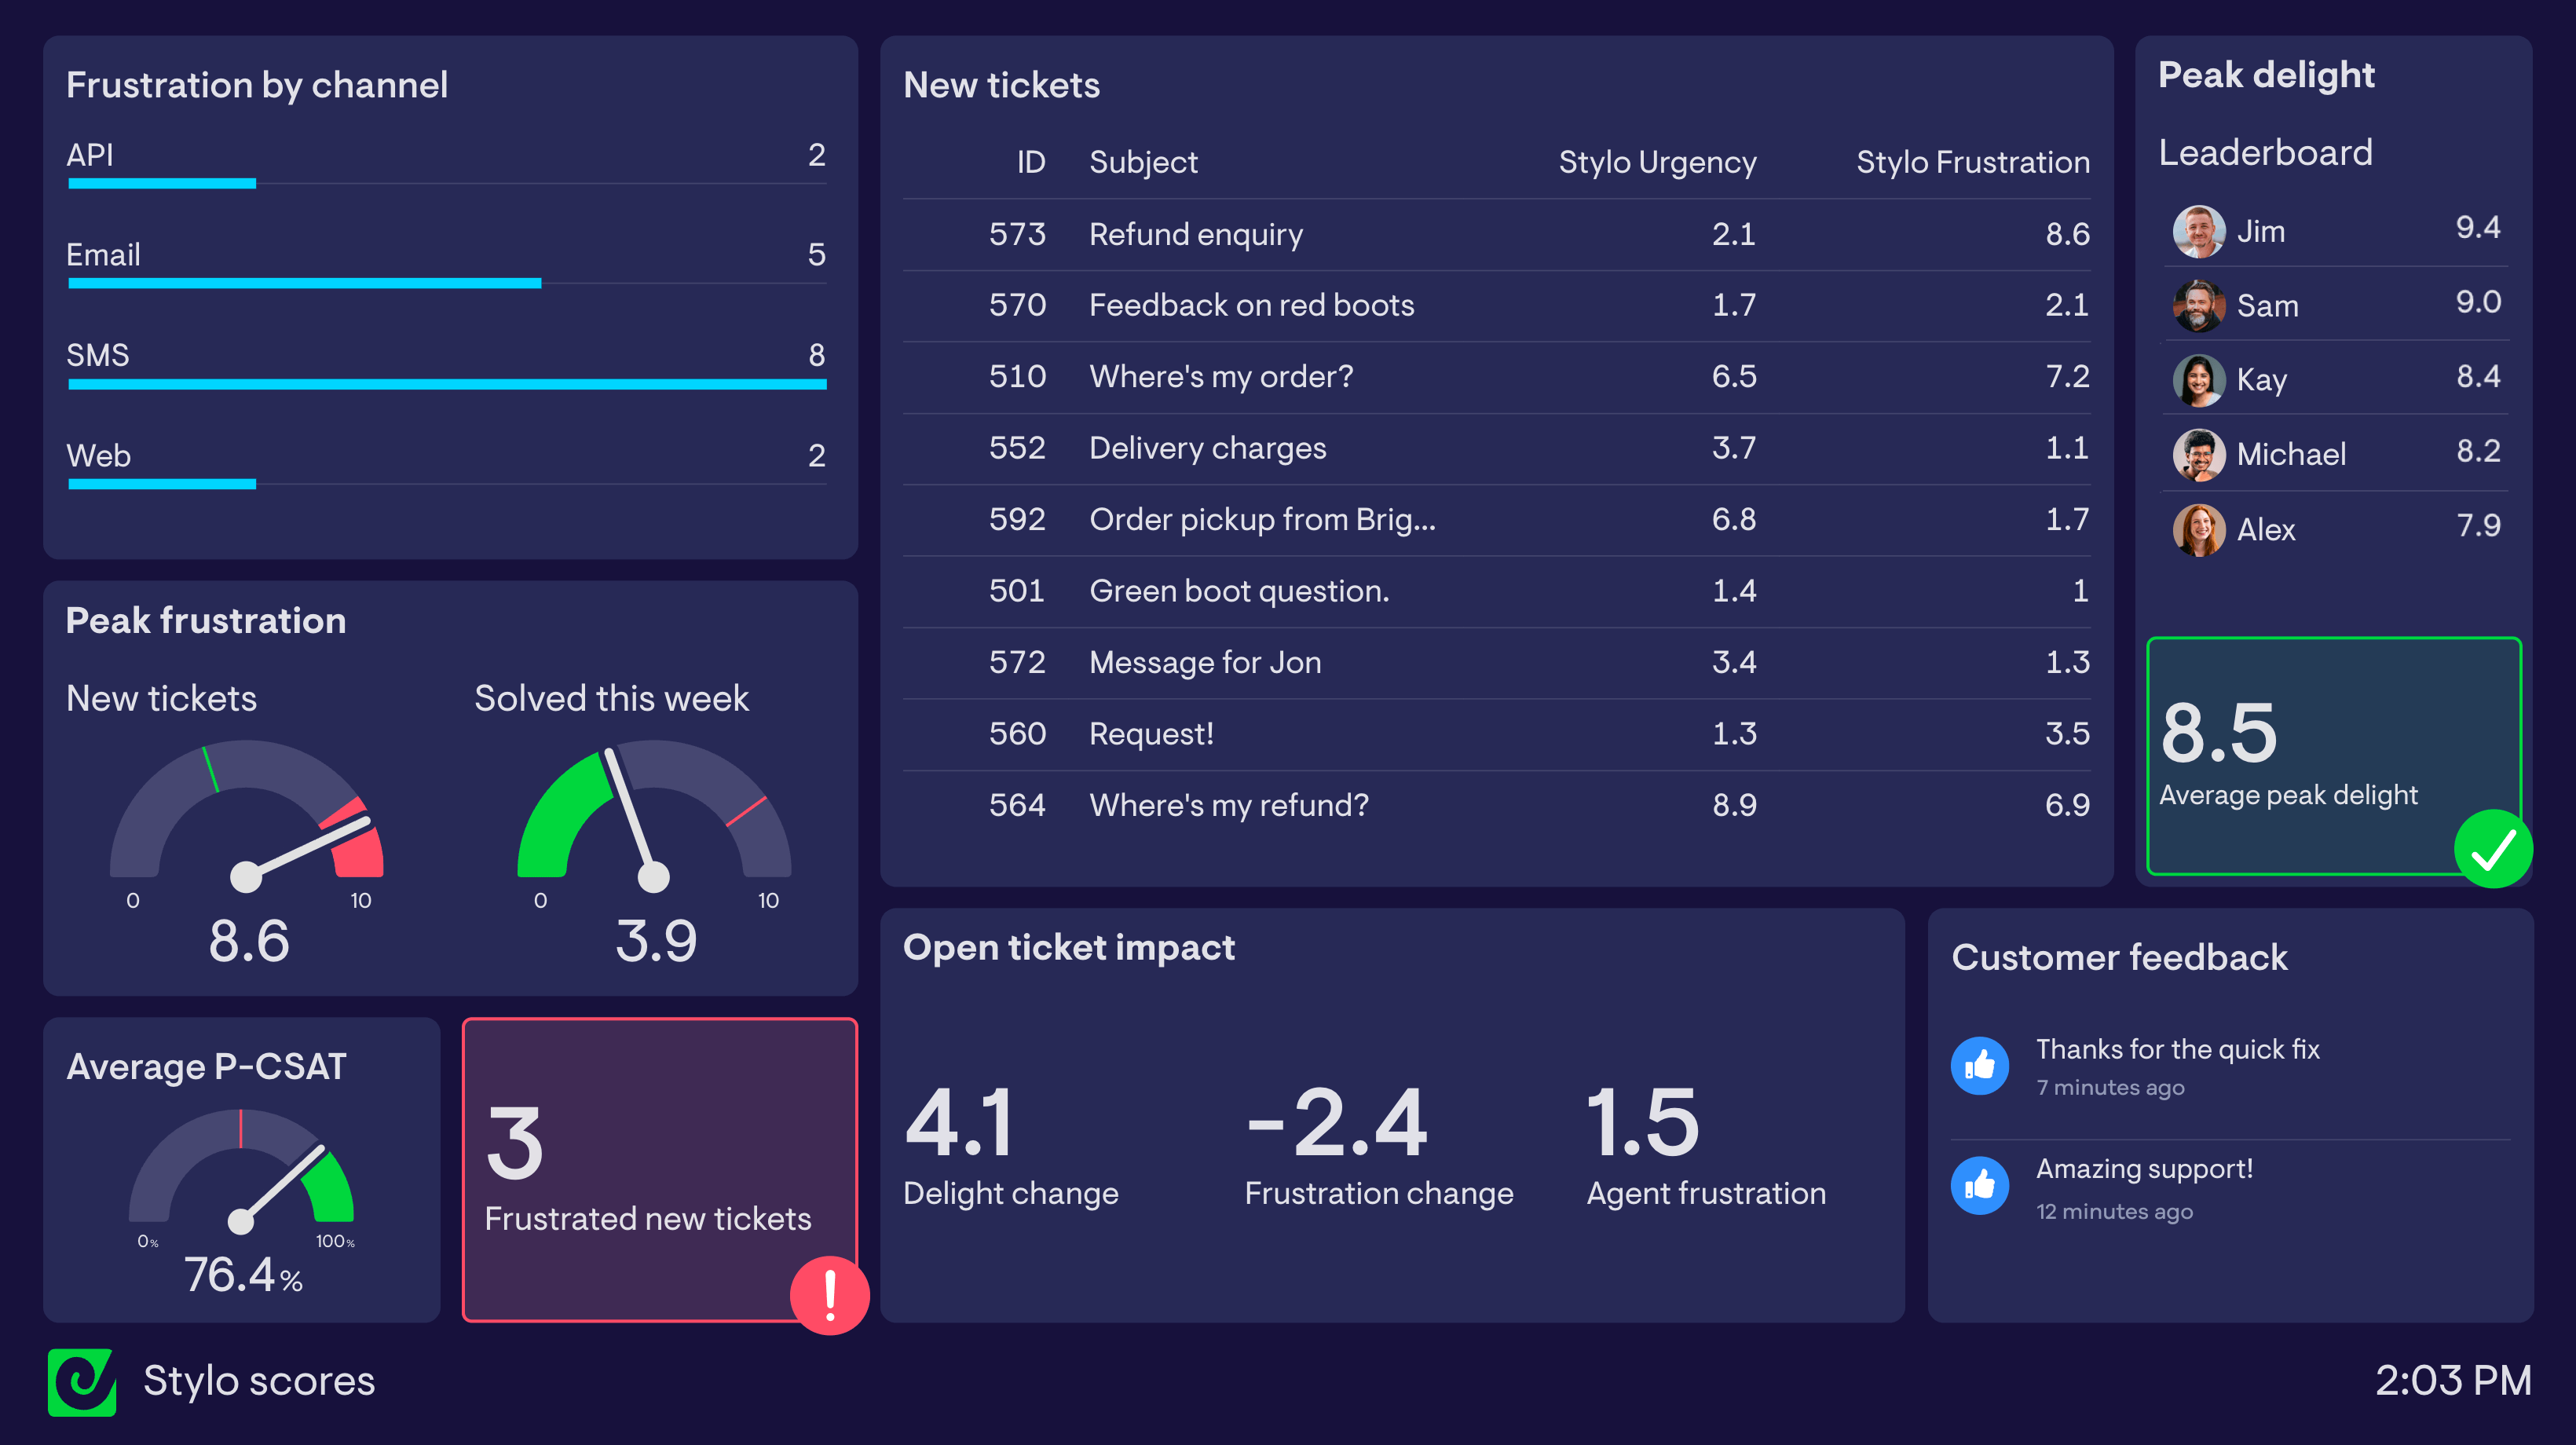
Track customer sentiment and urgency in real-time alongside your Zendesk queue metrics. This dashboard combines frustration by channel, live ticket lists with Stylo Scores, peak delight and frustration metrics, predicted CSAT, and recent customer feedback to give support teams an early warning system for customer risk.
Browse other popular examples
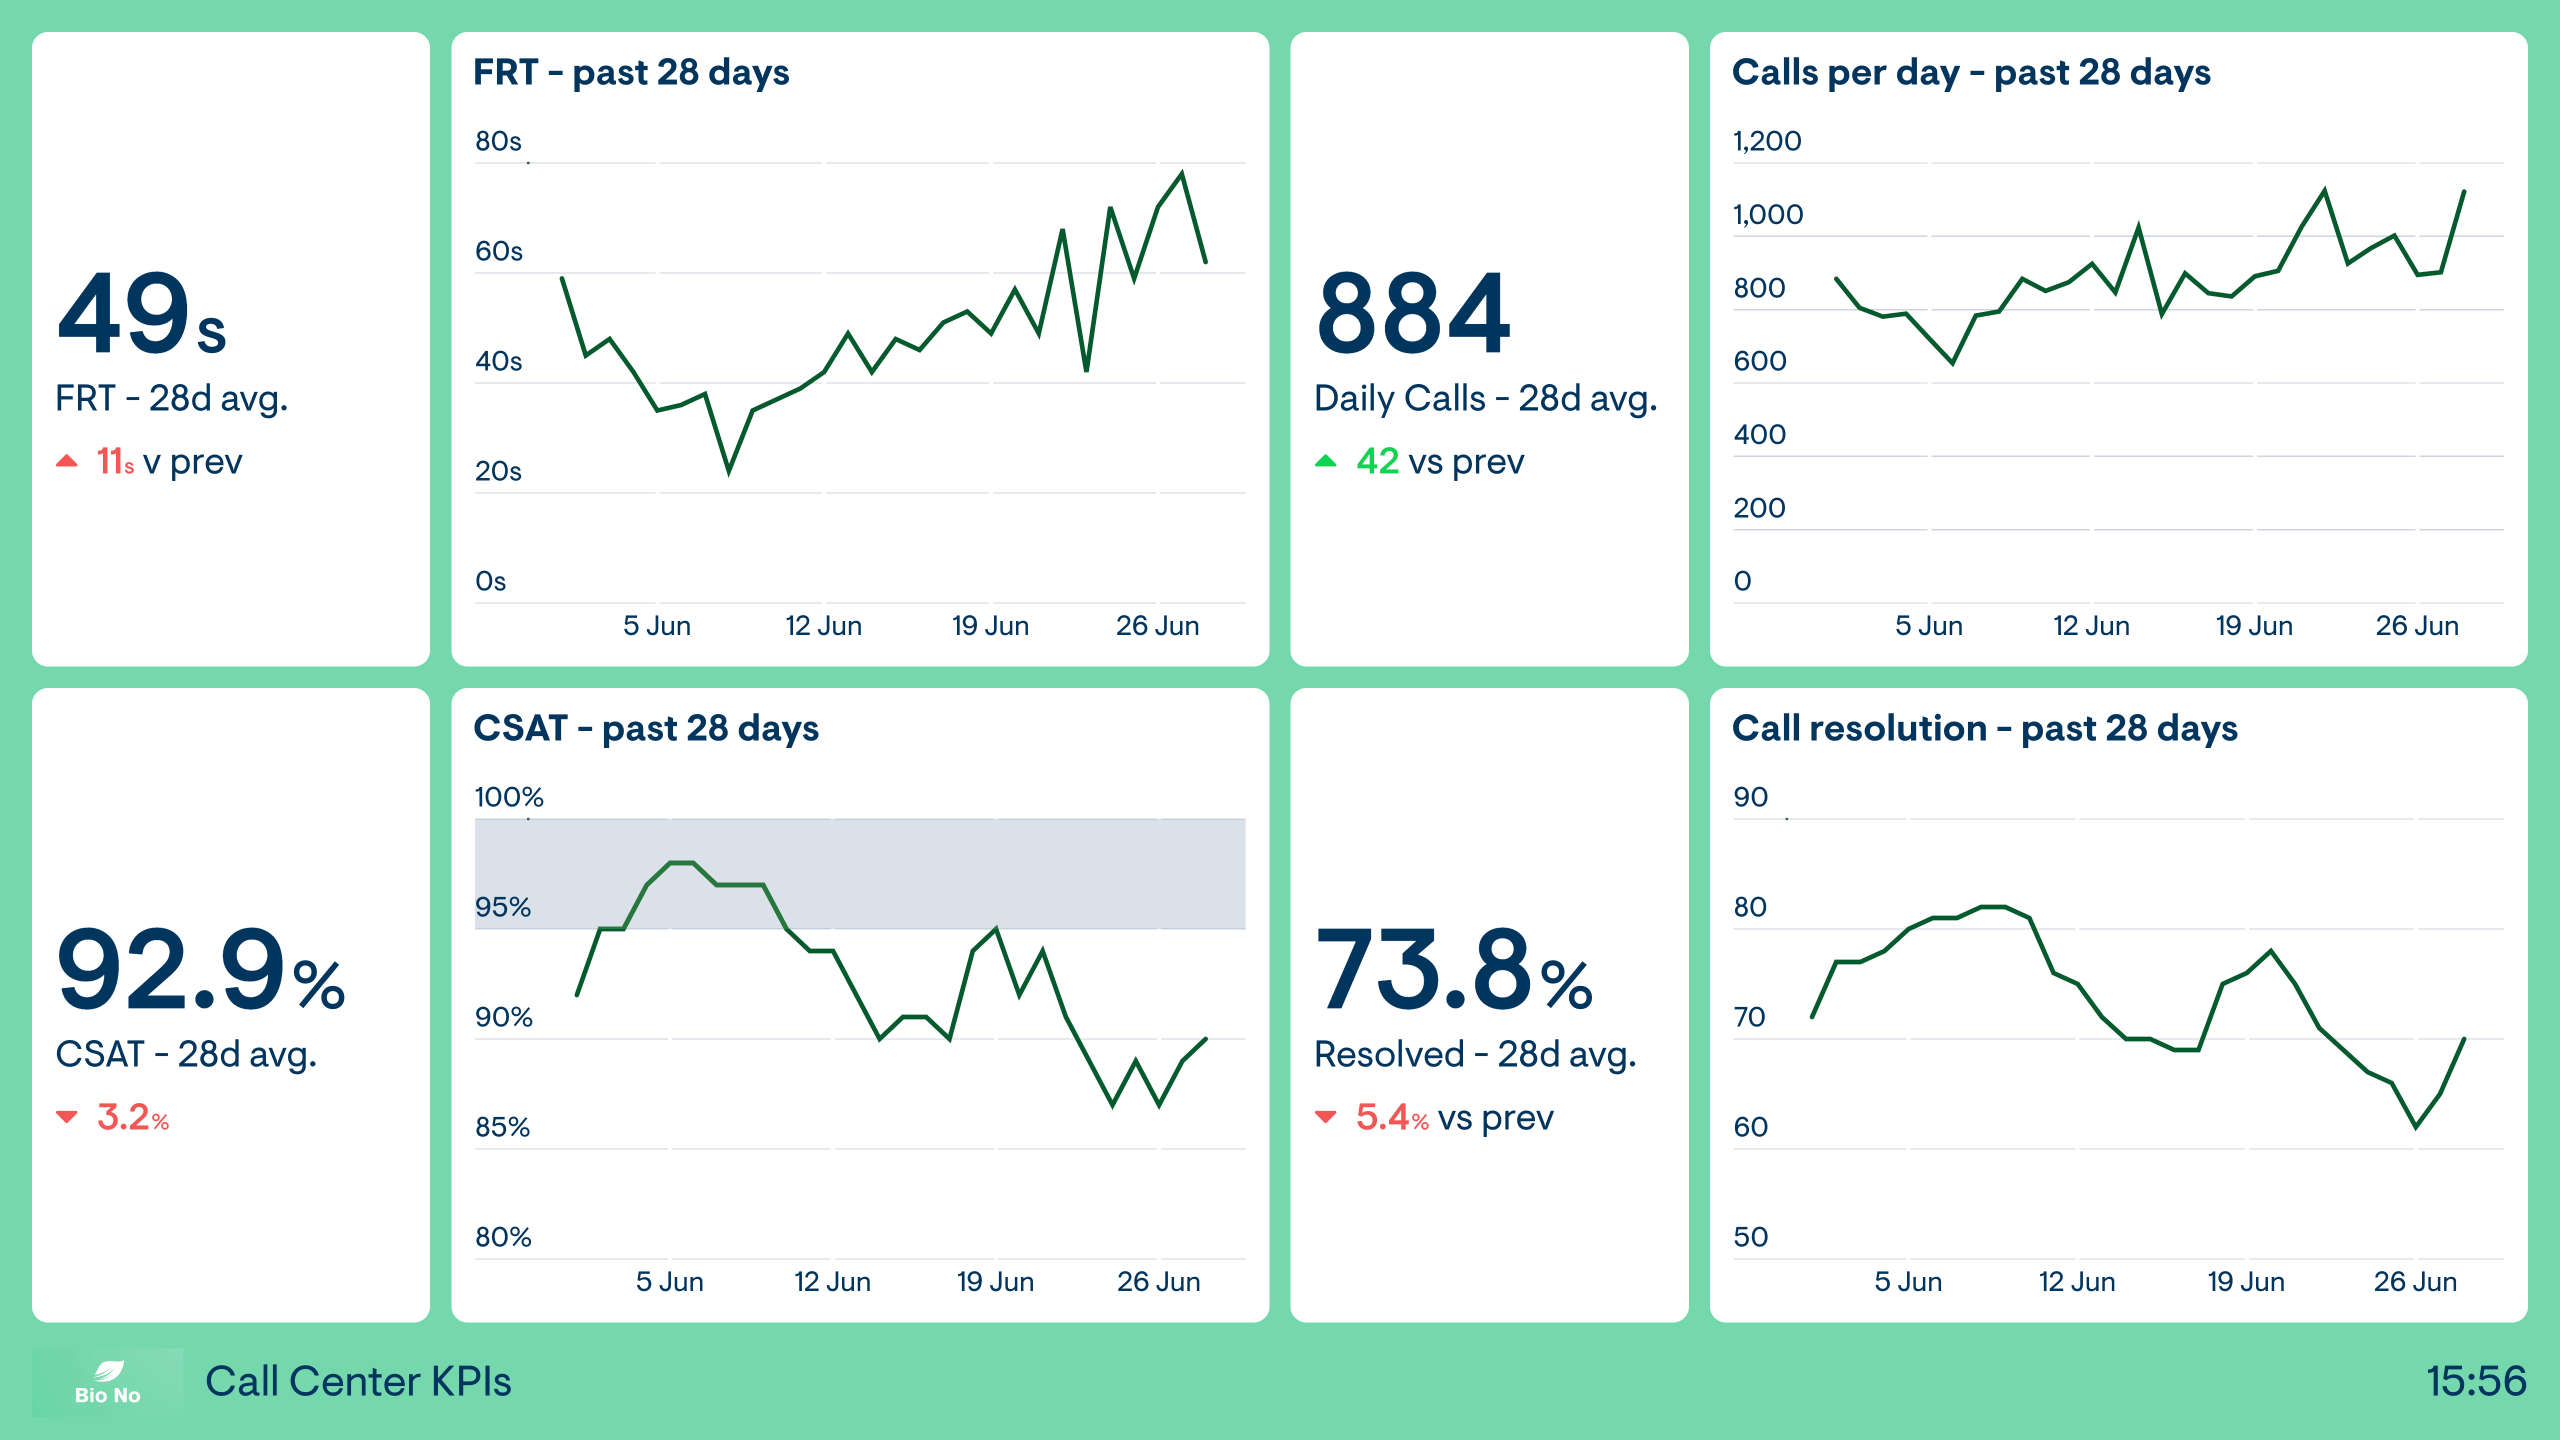
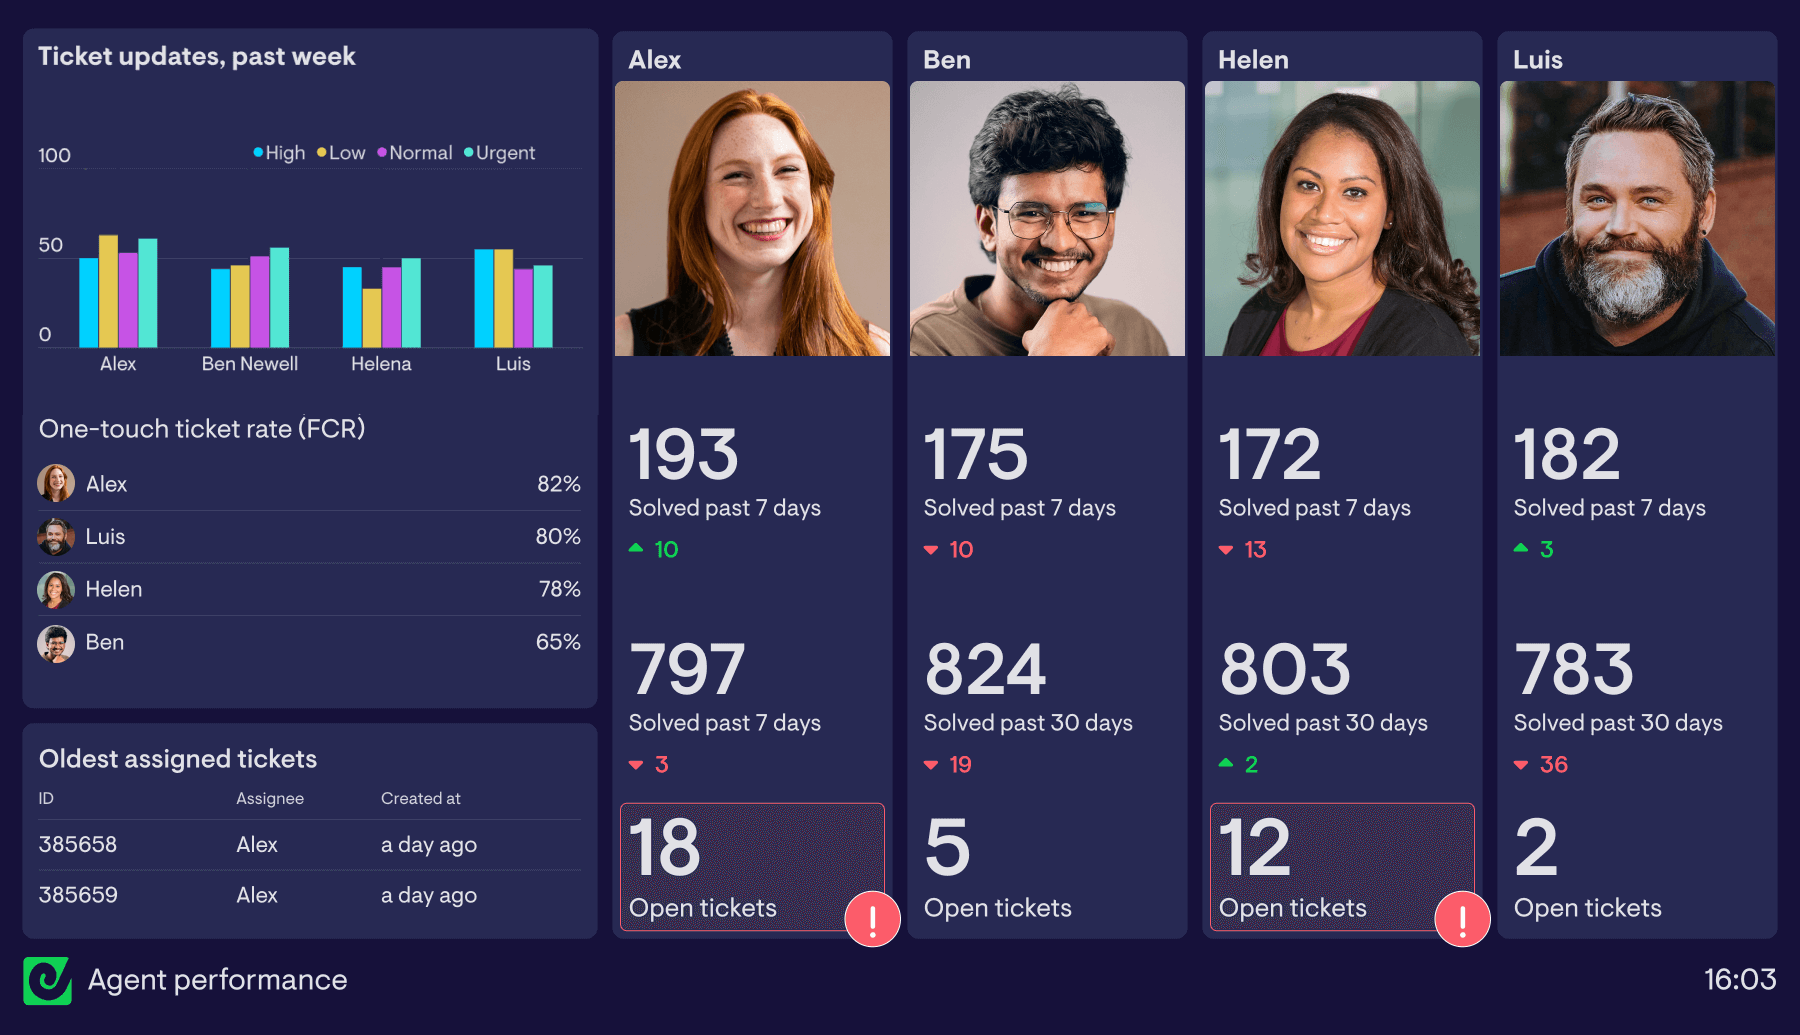
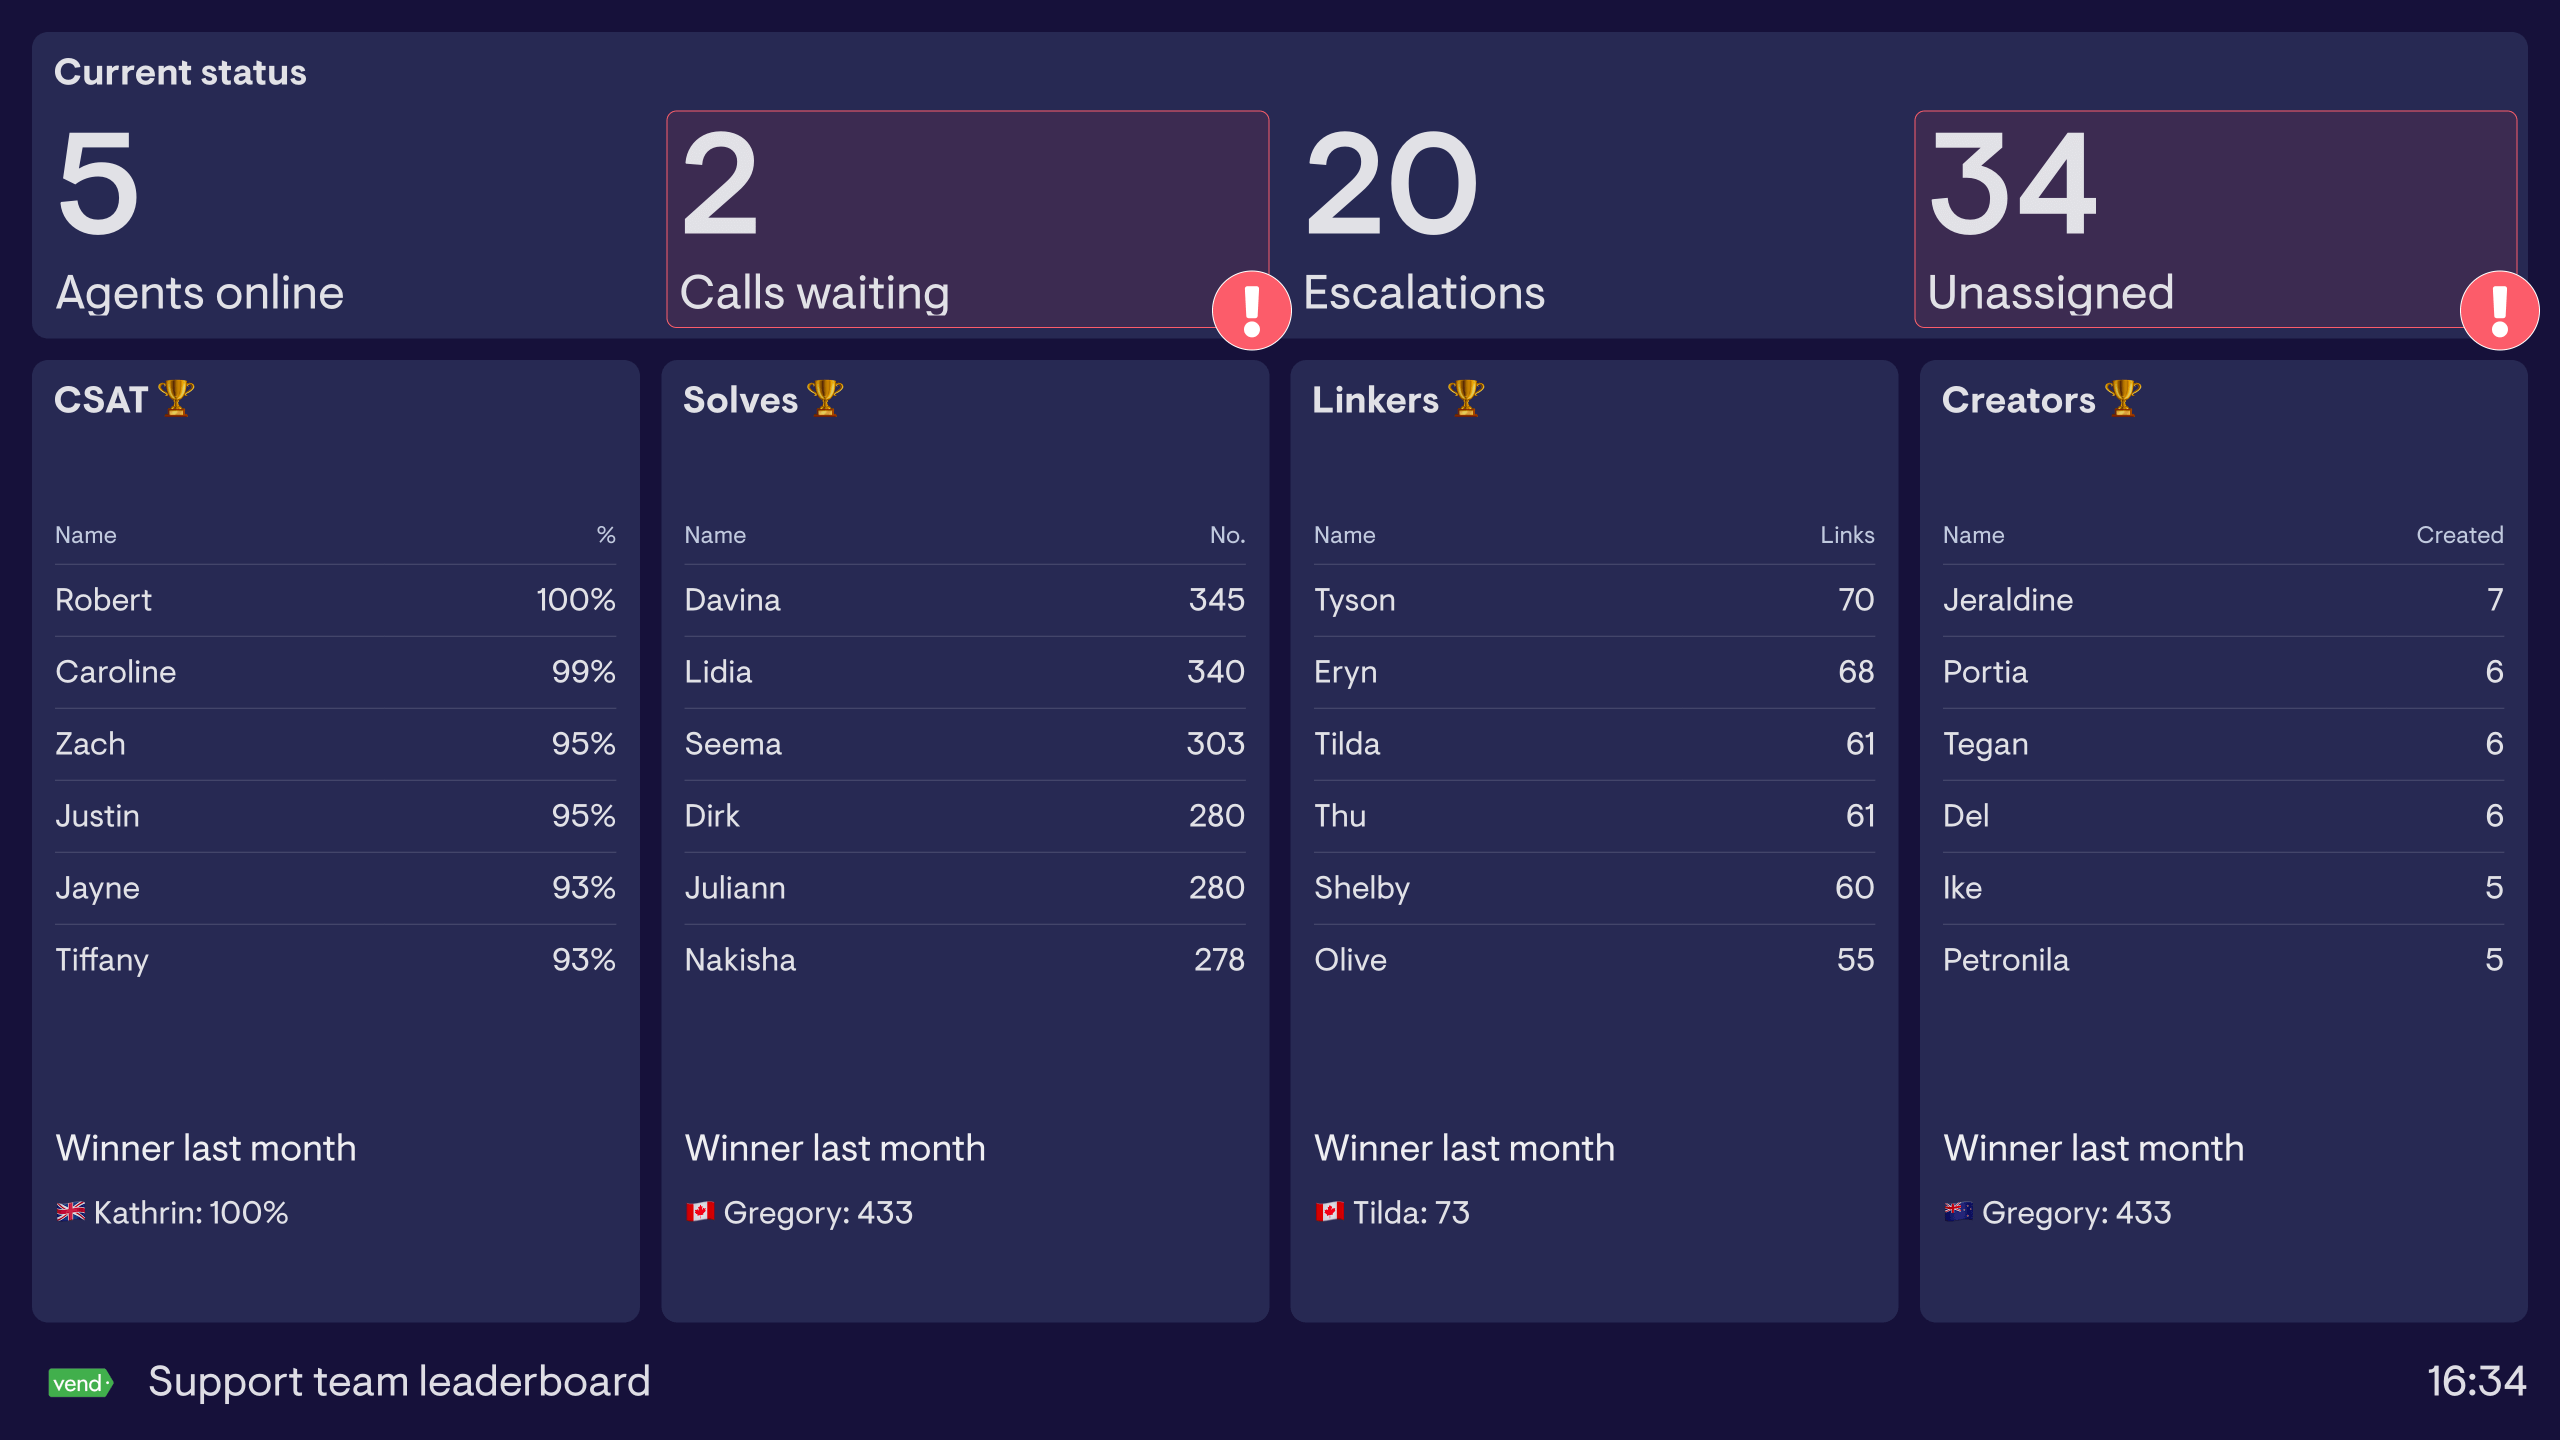
A Stylo Scores dashboard displays AI-generated ticket quality scores from the Stylo integration with Zendesk — giving support managers a real-time view of how well agents are resolving tickets. Teams use it to identify coaching opportunities and maintain quality standards as ticket volume scales.
Geckoboard is a live dashboard tool used to surface the sentiment and urgency signals that Stylo writes back to Zendesk as custom ticket fields. It presents those signals on a shared screen alongside queue metrics — so support leads have an always-on view of customer risk without switching between tools.
Key metrics include Stylo quality scores per agent, average score for the team, low-scoring tickets flagged for review, and score trends over time. Managers use these to prioritise which agents need coaching and which tickets need a second look.
Building a custom Stylo Scores dashboard is straightforward with Geckoboard's dashboard builder. Connect Zendesk Support with the Stylo integration to pull AI scoring data directly into your dashboard, then pick your metrics and build the view you need. Share with your team as a TV dashboard, shared link, or scheduled snapshot. Start a free trial or learn more about how Geckoboard works.
Use it to track customer service performance live so support managers can catch quality dips as they happen, not when they show up in a monthly CSAT report. It also helps display Stylo scores on a shared screen, giving agents and leads a consistent benchmark for what good looks like.