Predicted CSAT (P-CSAT)
What is Predicted CSAT?
Predicted CSAT (P-CSAT) is an estimate of how satisfied a customer is likely to be — based on signals in a support conversation (tone, sentiment, urgency, friction, and how the interaction is trending).
Unlike Customer Satisfaction (CSAT), which relies on a post-interaction survey response, P-CSAT is designed to be a leading indicator you can use while a ticket is still open — so you can spot risk earlier and steer conversations back on track.
P-CSAT is sometimes displayed as:
- a score (e.g. 0–100)
- a predicted rating (e.g. 1–5)
- a bucket (e.g. “warm / hot”, “at risk / neutral / likely positive”)
How do you calculate P-CSAT?
Strictly speaking, you don’t calculate P-CSAT with a single universal formula — it’s typically produced by an AI model that analyses the conversation and outputs a prediction. What you can calculate (and what most teams dashboard) is a consistent way of tracking that prediction over time.
Here are the most common approaches:
Average P-CSAT
Average P-CSAT = (Sum of P-CSAT scores / Number of conversations)
This is the cleanest way to spot whether predicted satisfaction is trending up or down.
Percentage of “at risk” conversations
If your tool provides a score or category, define an “at risk” rule and track:
% at risk = (**(Number of at-risk conversations / Total conversations) x 100)
This is often more actionable day-to-day than an average, because it’s easier to assign ownership and prioritise.
P-CSAT distribution
If you have buckets (e.g. warm/hot), track the mix over time. This is a simple way to see whether customer mood is shifting even when volume and SLA metrics look stable.
Tip: Exclude conversations where the signal is missing or unreliable (for example, extremely short interactions or cases where there isn’t enough text for analysis). How you handle “no signal” matters more than people expect — consistency beats perfection.
Why measure P-CSAT?
CSAT is one of the most important support KPIs, but it has two built-in challenges:
1) It’s delayed (you only see it after the interaction ends)
2) It’s incomplete (not everyone responds, and the people who do are often at the extremes)
We’ve written before about how CSAT can be surprisingly hard to interpret and compare when survey methods, tools, and response rates vary.
P-CSAT helps by giving you an early signal of customer risk and sentiment as work is happening.
Support leaders use P-CSAT to:
- Prioritise better during busy periods (two tickets can share the same priority and SLA, but one customer is patient while another is getting increasingly frustrated)
- Intervene earlier when predicted satisfaction dips after a release, incident, or policy change
- Add customer context to operational KPIs like First Response Time (FRT) and Average Reply Time (ART)
Limitations of P-CSAT
Predicted CSAT is useful, but it’s still a prediction.
Here are a few useful guardrails:
- Treat it like a smoke alarm. It’s there to direct attention early, not to “judge” a conversation with certainty.
- Expect drift. Changes in product, policy, customer mix, or channels can change language patterns and affect predictions over time.
- Don’t use it as a performance stick. P-CSAT is best for prioritisation, coaching, and spotting systemic issues — not punishing individuals.
- Pair it with real feedback. CSAT remains the customer’s explicit outcome signal (with all its quirks). Use both together.
What is considered a good P-CSAT score?
There’s no universal benchmark for P-CSAT, because different tools use different models and scoring systems.
A better approach is to set internal benchmarks:
- Start with a baseline (e.g. the last 4–8 weeks)
- Track trend direction and volatility
- Compare by queue, channel, issue type, and team
- Calibrate against real CSAT where you have responses
In practice, most teams get more value from reducing the percentage of at-risk conversations than chasing an abstract “perfect” average.
How to use P-CSAT on a dashboard
Real-time view (throughout the day)
P-CSAT is most powerful when it’s visible alongside your live operational metrics:
- % at-risk conversations
- Average P-CSAT today (with a 7-day sparkline)
- At-risk by queue / priority / channel
- Rising risk (conversations where P-CSAT is deteriorating)
This is the point: when risk is visible in the same place as volume, backlog and SLAs, prioritisation stops being guesswork.
Weekly review view
For trend and diagnosis, track:
- P-CSAT trend (weekly)
- Mix of “warm/hot” or equivalent categories (if available)
- P-CSAT by issue type / tag / product area
- P-CSAT alongside FRT/ART/backlog so you can see what’s driving changes
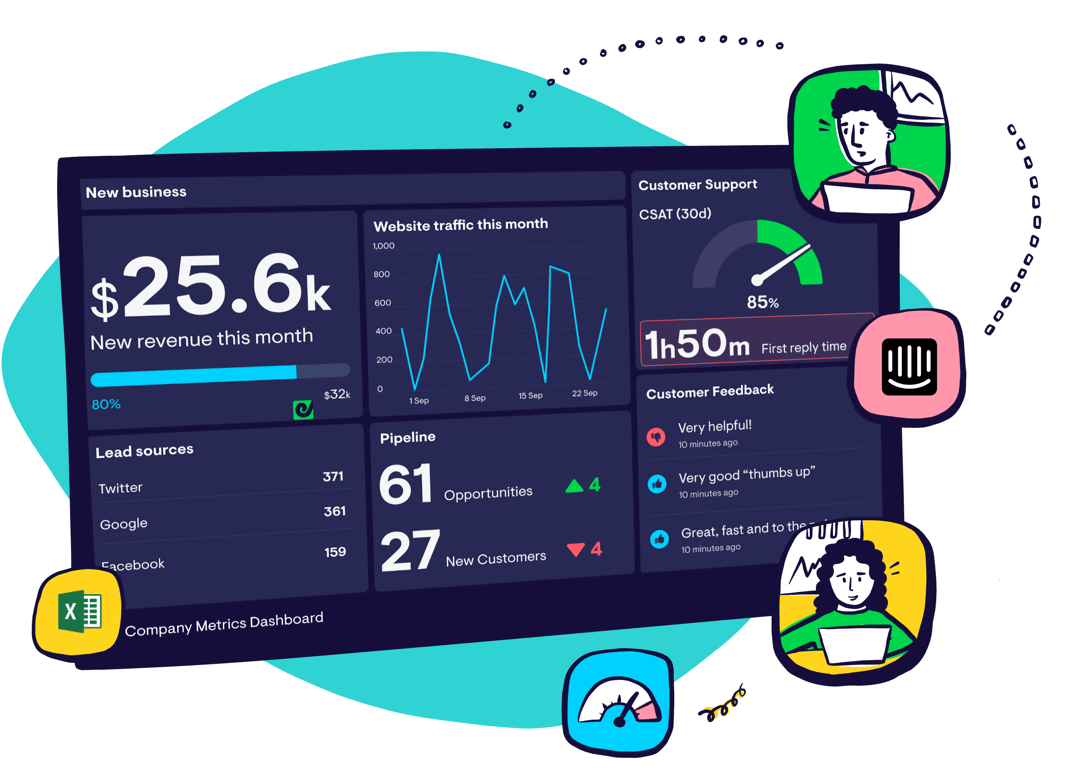
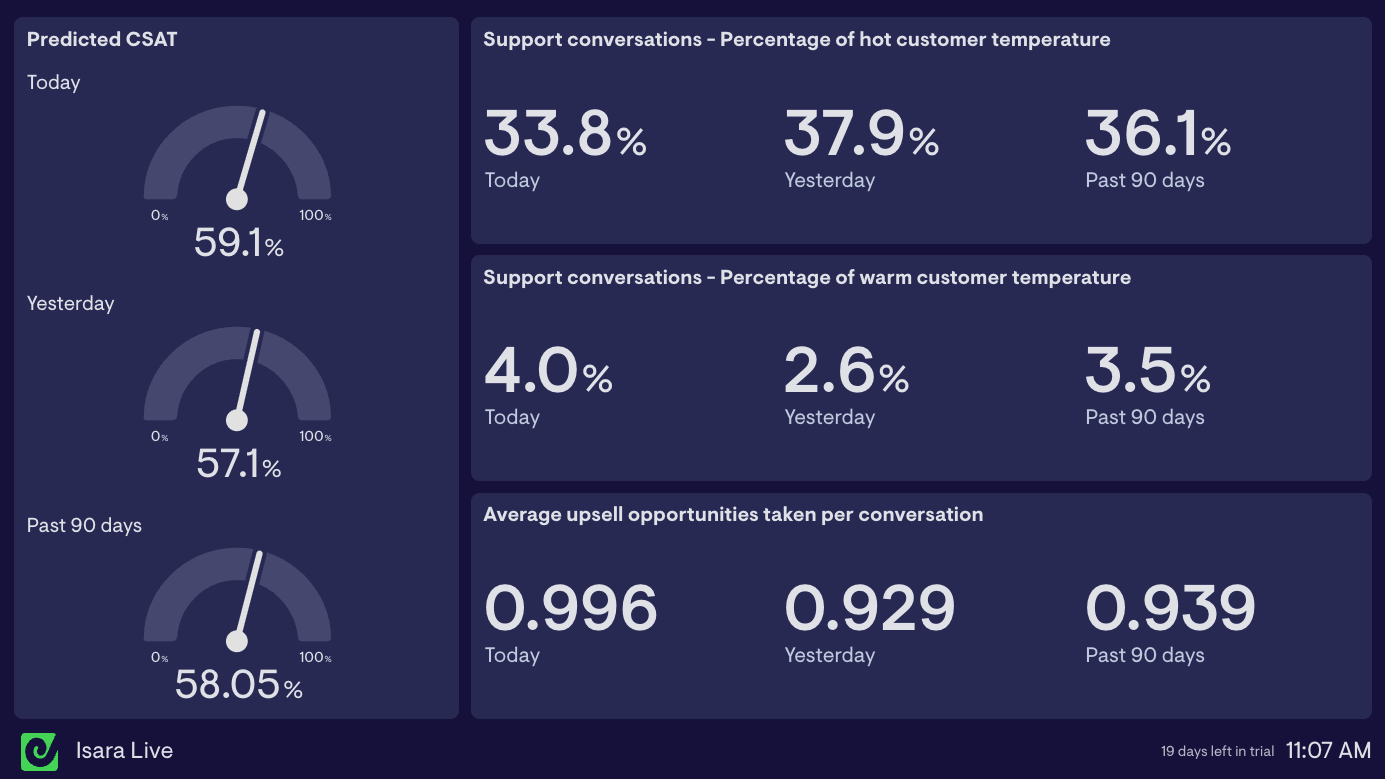
If you want an example of how teams lay this out, the Isara AI dashboard examples show predicted CSAT and customer temperature mix alongside team performance indicators.
How to improve P-CSAT
P-CSAT becomes valuable when it triggers consistent action. A simple operating loop looks like:
1) Detect at-risk conversations
2) Prioritise based on risk, not just age/priority
3) Intervene with a playbook
4) Learn from patterns over time
A few high-impact levers:
- Improve acknowledgment and early reassurance see First Response Time
- Maintain momentum on active conversations see Average Reply Time
- Use a lightweight “at-risk” response playbook: acknowledge → summarise → next step → confirm outcome
- Coach using repeatable patterns (issue types, queues, times of day), not one-off blips
Monitor supporting metrics
P-CSAT is best interpreted alongside the operational picture. These KPIs often explain why predicted satisfaction moves:
- Ticket Volume
- Ticket Backlog
- First Response Time (FRT)
- Average Reply Time (ART)
- First Contact Resolution Rate (FCR)
- Customer Effort Score (CES)
How to track P-CSAT in Zendesk
If you’re using Zendesk, the practical route is: get P-CSAT into ticket fields, then visualise it like any other KPI.
Stylo + Geckoboard
Stylo analyses Zendesk conversations as they happen and generates structured signals like urgency, frustration, and predicted CSAT — then writes them back into Zendesk as custom ticket properties. Geckoboard can then visualise those fields in real-time dashboards.
There’s also a current promotion: Monitor customer sentiment on your Zendesk dashboards — free for 3 months (offer ends March 6th 2026).
Isara + Geckoboard
Isara extracts AI-driven insights from customer conversations across platforms like Zendesk and predicts customer satisfaction, highlighting early signs of friction or churn, and features a direct integraiton with Geckoboard.
Related KPIs
- Customer Satisfaction (CSAT)
- First Response Time (FRT)
- Average Reply Time (ART)
- The hidden intricacies of CSAT
Sign up with Geckoboard for free to display your P-CSAT scores and all your most important Support metrics on a real-time dashboard.