Shopping Cart Abandonment Rate
What is Shopping Cart Abandonment Rate?
The Shopping Cart Abandonment Rate is the percentage of online shoppers who add items to a virtual shopping cart but then abandon it before completing the purchase. It shows the rate of interested potential customers who leave without buying anything compared to the total number of shopping carts created.
Advice from Ecommerce Experts: Why Shopping Cart Abandonment Rate is critical
“Poor usability is a known factor in cart abandonment. The top 23 sites all gross over $1 billion per year but have a 44% worse checkout user experience. At the average abandonment rate of 68% each of these sites could be losing $3 billion, if not more.” - Hazel Bolton, Optimization Consultant at User Conversion
“Studies show that the average person gets 1 interruption every 8 minutes, while the average employee gets interrupted 56 times a day. This is where cart abandonment emails come into play. By sending out one or more emails, companies can typically recover between 5% and 11% of otherwise lost sales.” - Carl Sednaoui, Director of Marketing at MailCharts
How to calculate Shopping Cart Abandonment Rate:
[1 - [ (#) completed purchases / (#) shopping carts created ]] * 100 = (%) Shopping Cart Abandonment Rate
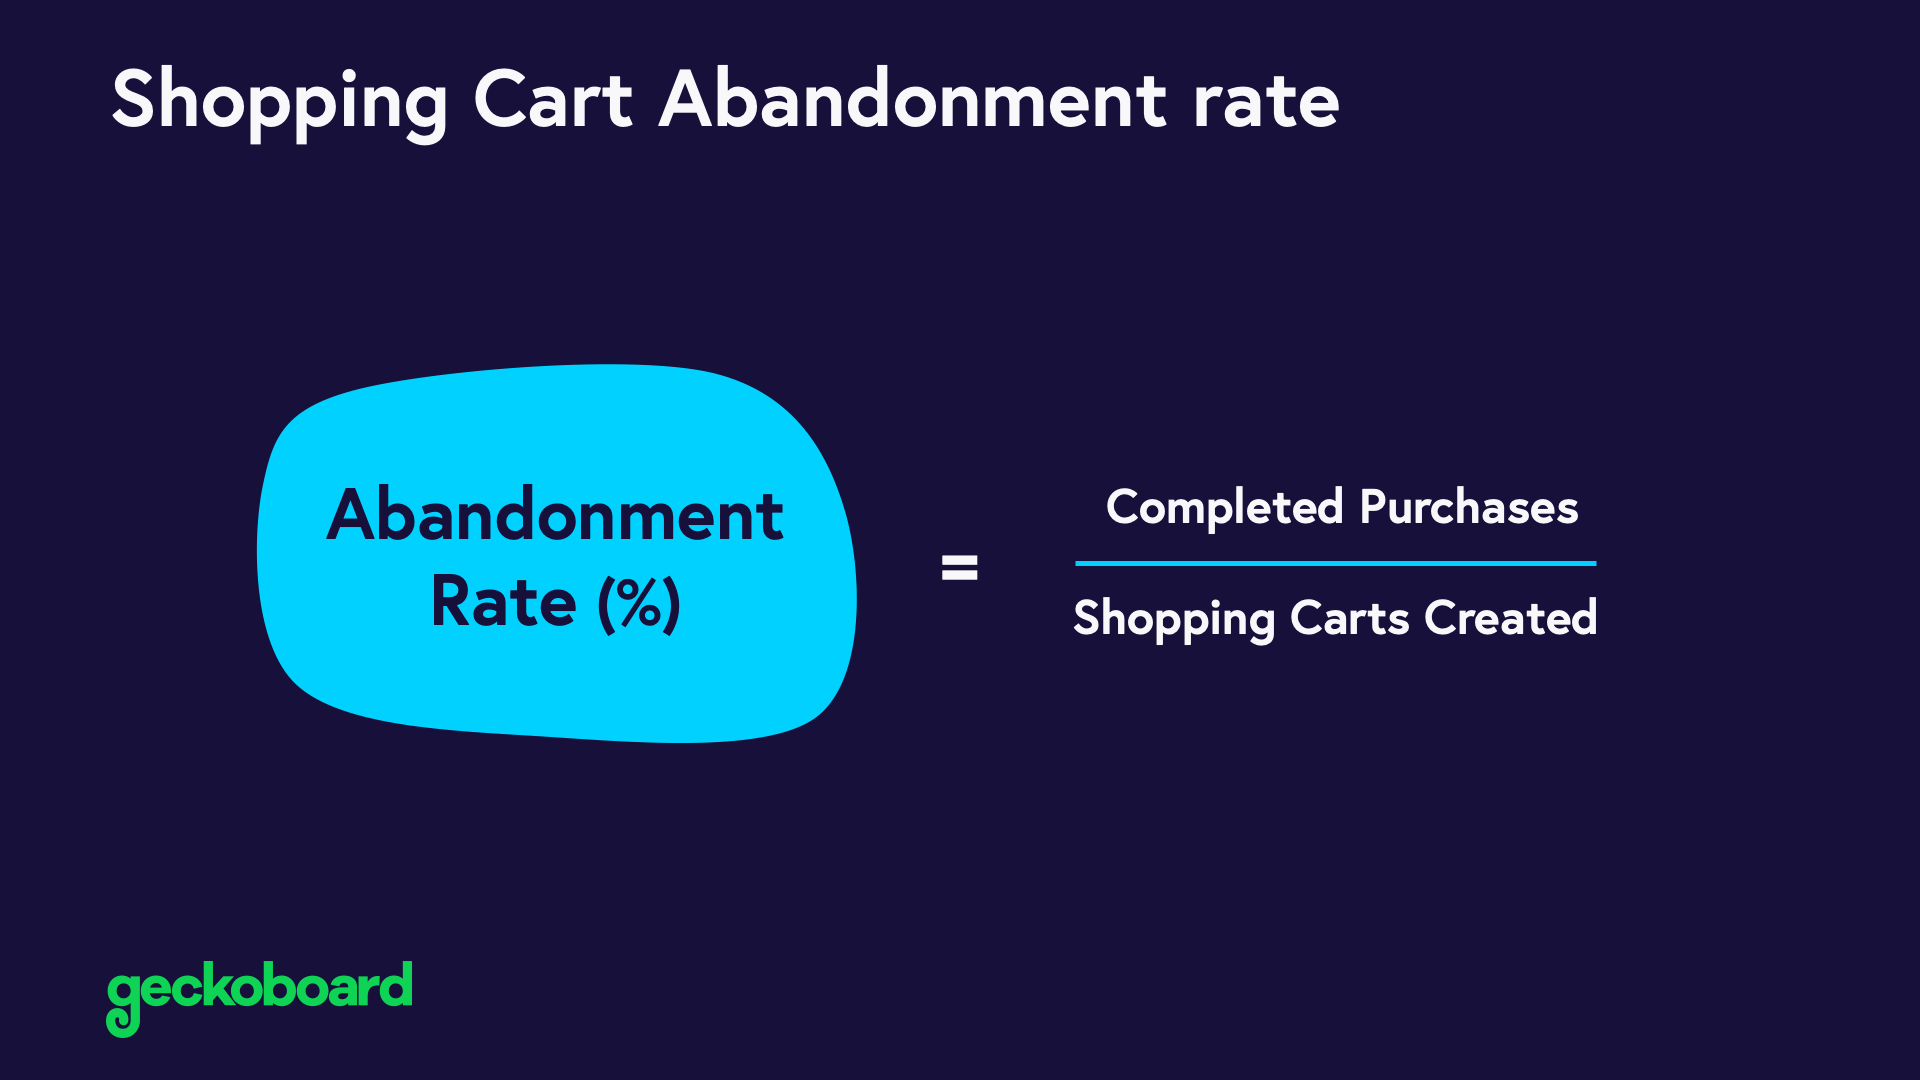
The Shopping Cart Abandonment Rate is calculated by dividing the total number of completed purchases by the number of shopping carts created. Subtract the result from one and then multiply by 100 for the abandonment rate.
For example, if you have 45 completed purchases and 200 shopping carts created, the shopping cart abandonment rate would be 77.5%.
1 - (45 / 200) x 100 = 77.5%
Pros:
The Shopping Cart Abandonment Rate helps online retailers understand the shopping behavior of their website visitors and customers. This KPI is often an indicator of how intuitive and trustworthy your checkout process is. Tracking the Shopping Cart Abandonment Rate provides a more specific indication of why revenue may go up or down. Most importantly, it can show where there might be a hiccup in converting online visitors to customers.
Decreasing the abandonment rate is an effective way to immediately increase revenue.
Cons:
While incredibly helpful within context, the Shopping Cart Abandonment Rate by itself can be misleading. For example, if you have very few website visitors or online sales, the Shopping Cart Abandonment Rate won’t be all that helpful as the data set is too small to be reliable.
Be sure to track this metric along with other KPIs such as Average Order Value, Gross Profit Margin, Website Speed (or Website Uptime), and Website Conversion Rate.
Another downside to the Shopping Cart Abandonment Rate is that it’s just the initial flag that something is wrong. There are a host of reasons why this metric might increase. Getting at the underlying issue requires further investigation of more detailed metrics. So while the Shopping Cart Abandonment Rate is good for flagging a potential issue, it’s not very helpful in actually solving the issue.
Relevant Ecommerce Metrics and KPIs:
If you’re adding Shopping Cart Abandonment Rate to your ecommerce dashboard, you might want to also track these related ecommerce metrics for context.
Industry Benchmarks
Based on a number of different ecommerce studies, the average shopping cart abandonment rate is 68.81% with the most recent study showing 74.52%.
A higher than normal abandonment rate could be caused by a variety of reasons including a complex checkout process, shipping costs, required sign up, or limited payment options.
Additional Notes
You can learn more about potential causes of a high abandonment rate here and explore tactics to reduce this metric.