A/B test dashboard examples
An A/B test dashboard tracks how different versions of a page, email, or ad are performing — side by side, in real time. It keeps the team up to date on experiment results without having to dig into the underlying tool each time.
A/B test dashboard
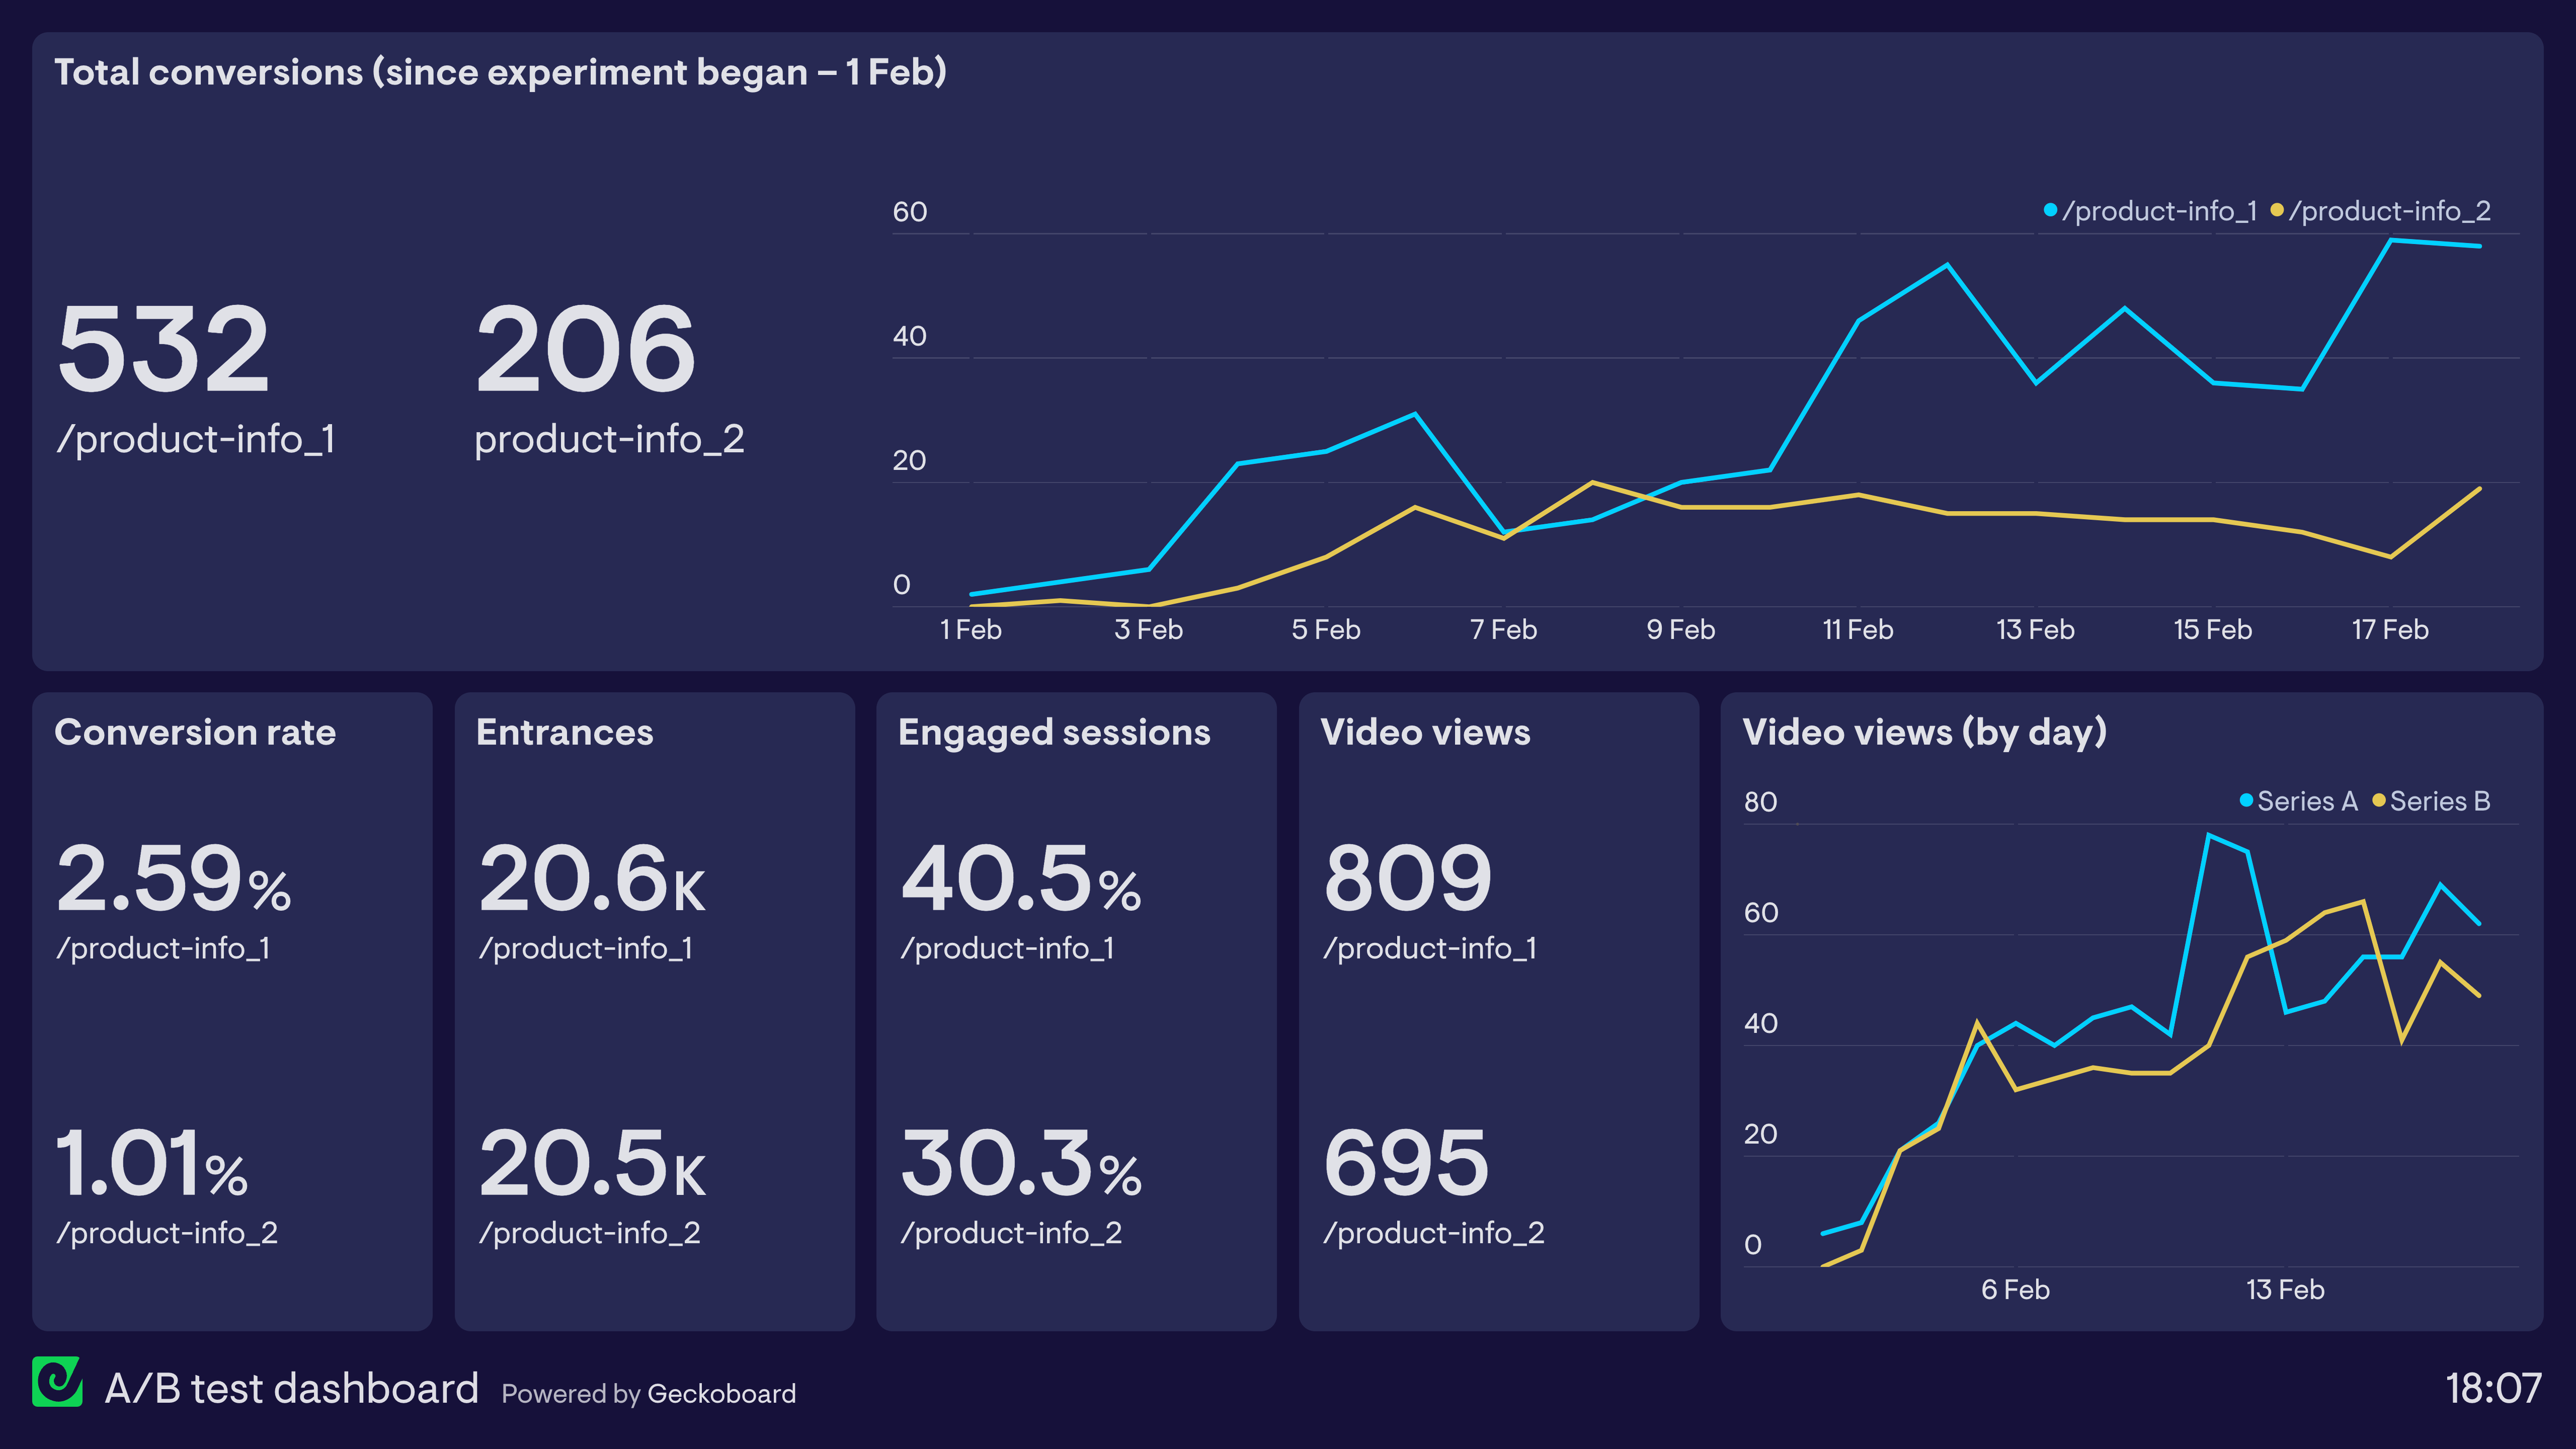
This dashboard shows the performance of two different product information pages, in order to understand which is more effective. The experiment has been set up in Google Optimize and the data is pulled directly from Google Analytics. We can clearly see that the first version has performed better in terms of both conversions and engagement.
Browse other popular examples
An A/B test dashboard gives marketing and product teams a live view of experiment results as data comes in. It replaces manual report pulling with a shared, always-current view of which variant is winning — helping teams make faster decisions without waiting for someone to run the numbers.
Geckoboard is a dashboard tool that connects to your marketing and analytics data sources and displays live metrics on a shared screen, shared link, or automated snapshot. It's used by marketing and product teams to keep experiment and campaign performance visible without logging into multiple platforms.
Typical metrics include sessions by variant, conversion rate, goal completions, bounce rate, and statistical significance. Teams often track these by traffic source or device type to spot segmentation effects.
Building a custom A/B test dashboard is straightforward with Geckoboard's dashboard builder. Connect Google Analytics to pull experiment data and segment results by variant, then pick your metrics and build the view you need. Share with your team as a TV dashboard, shared link, or scheduled snapshot. Start a free trial or learn more about how Geckoboard works.
Use it to call a test early when one variant clearly wins, or pause it if something is underperforming. It also lets you share one up-to-date view of experiment progress with everyone from designers to stakeholders.