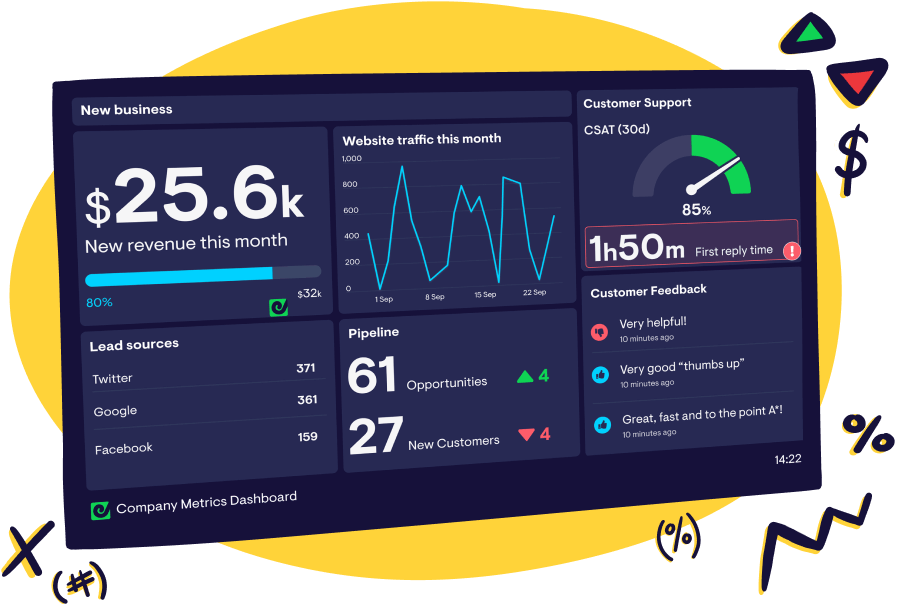
90+ KPI examples to keep your company on track
Making business decisions hinges on knowing how your teams and products are performing. And that knowledge comes from tracking the right key performance indicators (KPIs). But with hundreds of KPI examples to choose from, how do you know which ones are best for your company?
That’s why we made this list. We put together the top 90 KPI examples for multiple use cases, from ecommerce to customer support to finance. Select KPIs based on your industry, and you’ll be set to gauge your company’s performance.
-
Startup KPIs
Growth-related key performance indicators are important for any business, but they’re especially vital for startups. Use short and long-term metrics to monitor your business’ day-to-day health and overall viability.
-
1. Activation Rate
What is it: How many users reach an important milestoneWhy track it: Helps you gauge whether customers are successfully onboarding -
2. Burn Rate
What is it: How quickly your business is spending moneyWhy track it: Helps you see whether you need to cut back on spending or if you can afford to invest more -
3. Cash Runway
What is it: Uses burn rate and current balance to determine how long your funds will lastWhy track it: Shows how soon you need to raise new capital or increase revenue -
4. Customer Churn Rate
What is it: Percentage of customers lost in a given time frameWhy track it: Helps you gauge customer satisfaction -
5. DAU/MAU Ratio
What is it: Ratio of daily active users to monthly active usersWhy track it: Shows how often people are using your product -
6. Revenue Growth Rate
What is it: Month-over-month percent increase in revenueWhy track it: Helps you see how quickly your startup is growing
-
-
Ecommerce KPIs
Ecommerce is an incredibly competitive field. The best way to help your business thrive is by using data to understand your customers and serve them in the best possible way.
-
7. Average Order Value
What is it: Average amount a customer spends per order on your siteWhy track it: Serves as a larger indicator of whether overall profits are increasing or decreasing -
8. Customer Acquisition Cost
What is it: How much you spend to gain a new customerWhy track it: Helps you determine if marketing costs are too high -
9. Listing Conversion Rate
What is it: Percentage of a listing’s viewers who go on to make a purchaseWhy track it: Shows whether your product listings need to be adjusted to attract more customers -
10. New Buyer Growth Rate
What is it: Calculates how fast you are adding new buyers to your marketplaceWhy track it: Helps determine if you need to invest more in attracting new buyers -
11. New Seller Growth Rate
What is it: Tracks how fast sellers are being added to meet demand of buyersWhy track it: Helps determine if you need to investigate new ways to attract sellers -
12. Percentage of Active Listings
What is it: Percentage of total listings that get multiple views per weekWhy track it: Illustrates which listing styles you should imitate to drive more traffic and potentially increase conversions -
13. Percentage of Active Sellers
What is it: Calculates the proportion of sellers who regularly add new listingsWhy track it: Helps you look beyond seller volume to see how sellers are contributing to overall growth -
14. Percentage of Engaged Buyers
What is it: Percentage of total buyers who searched for or purchased a product recentlyWhy track it: Shows how many of your buyers are actively using your site -
15. Percentage of Satisfied Transactions
What is it: Percentage of total product reviews that are positiveWhy track it: Helps you track overall customer satisfaction and identify poorly performing products -
16. Purchase Frequency
What is it: The average number of times a customer purchases from you in a set time periodWhy track it: Helps indicate customer loyalty and purchasing behaviour -
17. Repeat Customer Rate
What is it: Percentage of customers who are making a repeat purchaseWhy track it: Helps gauge overall customer loyalty and determine if you need to revamp retention efforts -
18. Revenue by Traffic Source
What is it: Percentage of revenue coming from different sources (social media, organic search, paid search, etc.)Why track it: Helps you identify your most valuable marketing channels -
19. Shopping Cart Abandonment Rate
What is it: Percentage of customers who add items to their cart but never purchaseWhy track it: Shows whether your checkout process may be too complicated, causing shoppers to quit before finishing -
20. Time to Purchase
What is it: The average time or number of sessions for a customer to purchaseWhy track it: Helps you to understand purchasing behaviour
-
-
Finance KPIs
Monitor the financial health of your business and prove your viability to shareholders with these metrics.
-
21. Current Accounts Payable
What is it: Total outstanding bills for the current monthWhy track it: Helps with budget planning and monitoring recurring expenses -
22. Current Accounts Receivable
What is it: Total outstanding invoices owed to your companyWhy track it: Helps keep track of upcoming revenue, so you can accurately plan cashflow -
23. Gross Profit Margin
What is it: Total profit, expressed as a percentage of revenue, before adjusting for operating expensesWhy track it: Helps you determine the profitability of specific products and the company as a whole -
24. Quick Ratio
What is it: Ratio of revenue gains to revenue lossesWhy track it: Gives a quick picture of how efficiently the business is growing
-
-
Marketing KPIs
If you’re not tracking campaign performance, you won’t know if your marketing efforts are paying off. Use KPIs to justify your initiatives and make adjustments if needed.
-
25. Ad Click-Through Rate (CTR)
What is it: Percentage of people who click an ad after seeing itWhy track it: Shows how appealing your ad is and whether you might need to change ad images or copy -
26. Ad Revenue
What is it: Amount of revenue coming in from other companies advertising on your site. You can break this KPI down further to look at revenue per impression or revenue per pageview.Why track it: Measures how valuable your website traffic is and informs your larger ad strategy -
27. Bounce Rate
What is it: Percentage of people who navigate away from your site immediately after viewing the landing pageWhy track it: Signals whether you need to redesign your landing page -
28. Brand Recall
What is it: Percentage of people surveyed who remember or correctly identify your brandWhy track it: Indicates the success and reach of your marketing efforts -
29. Branded Search Traffic
What is it: Amount of traffic coming to your site from people searching for branded keywordsWhy track it: Shows how many people heard of your brand and wanted to find out more -
30. Cost Per Acquisition (CPA)
What is it: Amount spent to acquire a new customer through a specified channelWhy track it: Helps you evaluate the value of different marketing channels -
31. LTV:CAC Ratio
What is it: Compares the total average revenue per customer with the average cost of gaining a customerWhy track it: Shows whether your marketing spend is paying off -
32. Marketing ROI
What is it: Percentage of company profit that comes from paid marketing effortsWhy track it: Measures return on investment of paid marketing campaigns -
33. Net Promoter Score (NPS)
What is it: Measures the number of satisfied customers and the average degree of satisfactionWhy track it: Shows how happy your customers are overall -
34. Pages Viewed per Session
What is it: How many pages a single user views during one website sessionWhy track it: Gives you a sense of how engaging your website is -
35. Percentage of New Users
What is it: Percentage of total users who are visiting for the first timeWhy track it: Helps you see whether your site is attractive and user-friendly enough to bring in new users -
36. Press Clippings
What is it: How often your brand is mentioned in the pressWhy track it: Indicates the level of brand awareness, and more press clippings can lead to greater brand recall -
37. Social Media Mentions
What is it: How often your brand is mentioned across social media platformsWhy track it: Indicates the level of online brand awareness -
38. Viral Coefficient
What is it: Number of new users that each existing user generatesWhy track it: Helps track the success of referral programs and social marketing efforts -
39. Website Conversion Rate
What is it: Percentage of website visitors who take a set action, such as downloading an ebook or making a purchaseWhy track it: Helps you see if your marketing is effective in driving people to take the desired action -
40. Website Traffic Growth
What is it: Increase or decrease in website visits over a certain time frameWhy track it: Indicates whether you may need to adjust your traffic-focused marketing campaigns
-
-
SaaS KPIs
SaaS companies need metrics that will help them track current leads and find ways to continually increase lead volume over time. As a result, SaaS KPIs are more focused than other industries on recurring revenue and the lifetime value of a customer.
-
41. Annual Recurring Revenue (ARR)
What is it: The total amount of recurring revenue a business is due to receive over the subsequent 12 month period.Why track it: Understand the total value of your subscriptions at any one time. -
42. Average Revenue Per Account (ARPA)
What is it: Average amount a business makes on one account, usually calculated monthly or yearlyWhy track it: Helps show trends in account upgrades or downgrades and if you need to reevaluate your pricing plan -
43. CAC Payback Period
What is it: How long it takes to earn back what you spent acquiring a customerWhy track it: Shows you whether your pricing may be too low -
44. Completion Rate
What is it: Percentage of customers who complete a set goal within your user onboarding processWhy track it: Indicates whether your onboarding process may be confusing or difficult -
45. Customer Lifetime Value (LTV)
What is it: Average revenue per customer from acquisition to churnWhy track it: Helps you see if your marketing costs are too high, especially when compared with CAC -
46. Expansion MRR Rate
What is it: New monthly recurring revenue coming from existing customersWhy track it: Shows whether you’re successfully generating upsells -
47. Gross MRR Churn Rate
What is it: Total percentage of monthly revenue lost through downgrades or cancellationsWhy track it: Indicates if you need to focus more on customer retention strategies -
48. Monthly Recurring Revenue (MRR)
What is it: The average amount of recurring revenue a business is set to receive each monthWhy track it: Understand the total value of your subscriptions at any one time. -
49. Monthly Recurring Revenue (MRR) Closed vs Quota
What is it: Amount of new recurring revenue acquired in a month compared to the target MRR for that monthWhy track it: Helps you assess whether you need to rethink your sales strategy to increase revenue or whether your target MRR is unrealistic -
50. Net MRR Churn Rate
What is it: Measure of lost revenue from downgrades or cancellations after factoring in new revenue from expansionsWhy track it: Offers a more complete picture of your company’s health than the overall churn rate -
51. Net MRR Growth Rate
What is it: Percentage increase in net MRR month-over-monthWhy track it: Helps you measure the profitability of your company -
52. Signup to Subscriber Conversion Rate
What is it: Percentage of people who upgrade from free trials or freemium products to paid versionsWhy track it: Indicates how successfully marketing is driving non-paying customers to convert
-
-
Sales KPIs
Harness your team’s competitive energy and help them respond to leads faster by tracking real-time sales KPIs. At the same time, improve overall performance by monitoring big-picture metrics, like average follow-up attempts.
-
53. Activity Per Rep
What is it: Total tasks each rep completes in a given time period, such as phone calls, emails, or demosWhy track it: Helps you monitor sales team productivity -
54. Average Follow-up Attempts
What is it: Average number of contact attempts sales reps make before closing each leadWhy track it: Shows you how persistent sales reps are before giving up on a lead -
55. Average Purchase Value
What is it: Average amount a customer spends on a transaction when a sales rep closes a dealWhy track it: Can help you determine the volume of deals you need to meet your revenue goals -
56. Average Sales Cycle Length
What is it: Average length of time from initial contact to closing a dealWhy track it: Useful when setting long-term budgets and setting deadlines for sales goals -
57. Lead Response Time
What is it: Average time it takes sales reps to follow up after identifying a leadWhy track it: Shows you if sales reps need to speed up their outreach efforts -
58. Lead Velocity Rate
What is it: Month-over-month growth rate of qualified leadsWhy track it: Helps you predict future revenue, including possible fluctuations -
59. MQL to SQL Conversion Rate
What is it: Percentage of marketing qualified leads (MQL) who convert to sales qualified leads (SQL)Why track it: Helps you predict revenue growth and indicates the quality of marketing and lead-screening efforts -
60. Pipeline Volume vs Goal
What is it: Number of leads currently in the sales pipeline compared to your target lead amountWhy track it: Shows you whether your sales team is on track to meet their overall sales quota -
61. SQL to Win Conversion Rate
What is it: Number of SQLs who become customersWhy track it: Indicates whether you need to adjust your sales strategy to get more conversions
-
-
Mobile App KPIs
These KPIs help you understand how customers view your app, so you can make improvements and keep people coming back for more.
-
62. App Ranking
What is it: Position of your app within app marketplaces, like Google Play and the Apple app storeWhy track it: Shows how visible your app is, which is a predictor of higher download numbers -
63. Average Revenue Per User (ARPU)
What is it: Average revenue generated for each user of your appWhy track it: Helps you evaluate app pricing and in-app purchase options -
64. Cost Per Install
What is it: Amount it costs you in paid ad spend for each person who downloads the appWhy track it: Shows whether your marketing investments are paying off or if you need to adjust your campaigns -
65. Retention Rate
What is it: Percentage of people who continue using your app over a set period of timeWhy track it: Indicates how engaging your app is and whether your company is educating users on how to get long-term value out of the app -
66. Session Length
What is it: Amount of time a user spends on the app in one session, from launching the app to closing itWhy track it: Indicates whether users are staying in the app long enough to complete the actions you want them to
-
-
HR KPIs
Track these human resources KPIs to recruit more efficiently, improve onboarding, and create a positive work environment.
-
67. Absence Rate
What is it: How often employees are out for unplanned absences like an illnessWhy track it: Gives you a glimpse of the overall wellness of a team or department -
68. Application Completion Rate
What is it: Percentage of candidates who complete and submit an application after starting itWhy track it: Helps you see if there’s an issue with the application process, causing people to quit before finishing -
69. Candidates per Hire
What is it: Number of candidates you have compared to the number of hires you makeWhy track it: Can help you predict how many candidates you need to fill a future role and whether you need to improve your current candidate sourcing methods -
70. Candidates per Opening
What is it: Number of candidate applications over a set time frame compared to the number of job openings during the same timeWhy track it: Helps you gauge the success of your recruitment marketing -
71. Cost per Hire
What is it: Amount you spend in external and internal recruiting costs for each hire you makeWhy track it: Helps you create realistic recruitment budgets -
72. Employee Net Promoter Score
What is it: Measures how likely an employee is to recommend working at your company to their friends and familyWhy track it: Helps you determine the level of employee happiness and work to foster a positive environment -
73. Gender Pay Gap
What is it: Difference in average pay between men and women or non-binary people in the same roleWhy track it: Shows whether you need to take action to create a more equal workplace -
74. Gender Ratio
What is it: Shows the proportion of your employees who identify with each gender groupWhy track it: Indicates if you might have bias in your hiring processes -
75. Headcount
What is it: Total number of staff and consultants you have at a given timeWhy track it: Helps you measure how quickly your company is growing -
76. Hires by Department
What is it: Number of hires made by each department over a set time frameWhy track it: Helps you track growth for each department -
77. Hires by Month
What is it: Number of people you hired in a given monthWhy track it: Helps you track annual hiring trends -
78. Length of Service
What is it: Average length of time employees have spent at your companyWhy track it: Highlights whether your company struggles with retention -
79. New Hire Turnover Rate
What is it: Percentage of new hires who leave shortly after joining, such as during their probation periodWhy track it: Indicates if your job descriptions and internal company policies are unclear on what the role requires -
80. New Starters per Month
What is it: How many new hires you have each monthWhy track it: Helps you make sure you have enough resources and staff to onboard all new hires -
81. Passive Candidate Hire Rate
What is it: Percentage of Passive Candidate Hires from your total number of hiresWhy track it: Lets you know if your strategy for attracting Passive Candidates is working -
82. Permanent to Freelance Staff Ratio
What is it: The number of permanent staff you have in your company compared to the number of freelance staffWhy track it: Indicates if you might have staffing instability later on due to a high number of freelance workers -
83. Source of Hire
What is it: Shows you where people are finding your job postings and what percentage of total hires comes from a particular sourceWhy track it: Helps you redirect your recruitment marketing to the most valuable channels -
84. Time to Fill
What is it: Average time it takes to hire someone for a positionWhy track it: Measures the efficiency of your current recruitment process -
85. Training Expenses
What is it: Total amount of money you spend on employee trainingWhy track it: Helps you see if you need to invest in different training solutions, especially when compared with employee training satisfaction and performance reports -
86. Yield Ratio
What is it: Percentage of candidates who move from one stage of hiring to the nextWhy track it: Highlights slow hiring phases that need improvement to keep candidates moving forward
-
-
Customer Support KPIs
Help your support team measure and improve their customer service by tracking customer satisfaction, ongoing conversations, and more.
-
87. Agent Touches per Ticket
What is it: The number of touches required to solve a ticketWhy track it: Higher numbers of touches can negatively impact CSAT -
88. Average Handle Time (AHT)
What is it: The average time an agent spends on each call or ticketWhy track it: Ensures customer calls are conducted efficiently -
89. Average Reply Time (ART)
What is it: The average time a customer has to wait for a reply after contacting supportWhy track it: Helps highlight if all communications are being dealt with promptly rather than just First Touch -
90. Average Resolution Time
What is it: The average time taken for a ticket to be solvedWhy track it: Ensures customers' issues are resolved quickly -
91. Call Abandonment Rate
What is it: The proportion of calls where the customer hangs before their call is answeredWhy track it: High abandonment rates are a likely to result in poor customer satisfaction -
92. Conversations Per Teammate
What is it: Number of customer interactions for each member of the customer support team, typically per dayWhy track it: Helps you determine if support reps’ workloads are reasonable or overwhelming -
93. Customer Effort Score (CES)
What is it: Scores how easy customers find it to solve their problemWhy track it: Feeds into overall customer satisfaction -
94. Customer Satisfaction (CSAT)
What is it: Shows you how happy your customers are based on customer experience survey responsesWhy track it: Measures how well your support team is handling customer concerns -
95. Escalation Rate
What is it: Percentage of support tickets that are escalated to a new support tierWhy track it: Shows the effectiveness of your first line of support -
96. First Contact Resolution Rate (FCR)
What is it: Shows you what proportion of tickets are solved on first contactWhy track it: Measures how efficient your team are at solving customer issues -
97. First Response Time (FRT)
What is it: The time it takes the customer support team to respond after a customer submits a ticketWhy track it: Helps you reduce customer wait times and increase satisfaction -
98. Knowledge Base Views
What is it: Number of pageviews on your self-help support pagesWhy track it: Allows you to identify the most common customer issues and address the root causes of these problems -
99. Most Common Issues
What is it: Number of pageviews on your self-help support pagesWhy track it: Allows you to identify the most common customer issues and address the root causes of these problems -
100. Percentage of Positive Votes
What is it: The percentage of positive votes that your help center articles receive (for help centers where readers can vote on articles)Why track it: Helps you identify articles that need revisions and brainstorm new article ideas based on popular topics -
101. Predicted CSAT (P-CSAT)
What is it: Predicts how happy or frustrated your customers are based on real-time analysis of their responses.Why track it: Provides faster feedback and all-round coverage than CSAT alone. -
102. Ratio of Views vs Tickets submitted
What is it: Compares the number of pageviews on help center pages to the number of support tickets sent inWhy track it: Helps you see if customers are able to solve issues independently or if they need assistance from reps -
103. Ticket Backlog
What is it: Number of unresolved customer support tickets in a given time periodWhy track it: Indicates if your team needs help handling their current ticket volume -
104. Ticket Volume
What is it: Total tickets in your queue over a period of timeWhy track it: Shows you trends in numbers of tickets your team is dealing with at a given time
-