CEO dashboard examples
A CEO dashboard gives company leadership a live view of the metrics that matter most — revenue, pipeline, cash, and team performance. What goes on it matters as much as how it looks: the things a CEO tracks become the things the business pays attention to.
CEO Overview dashboard
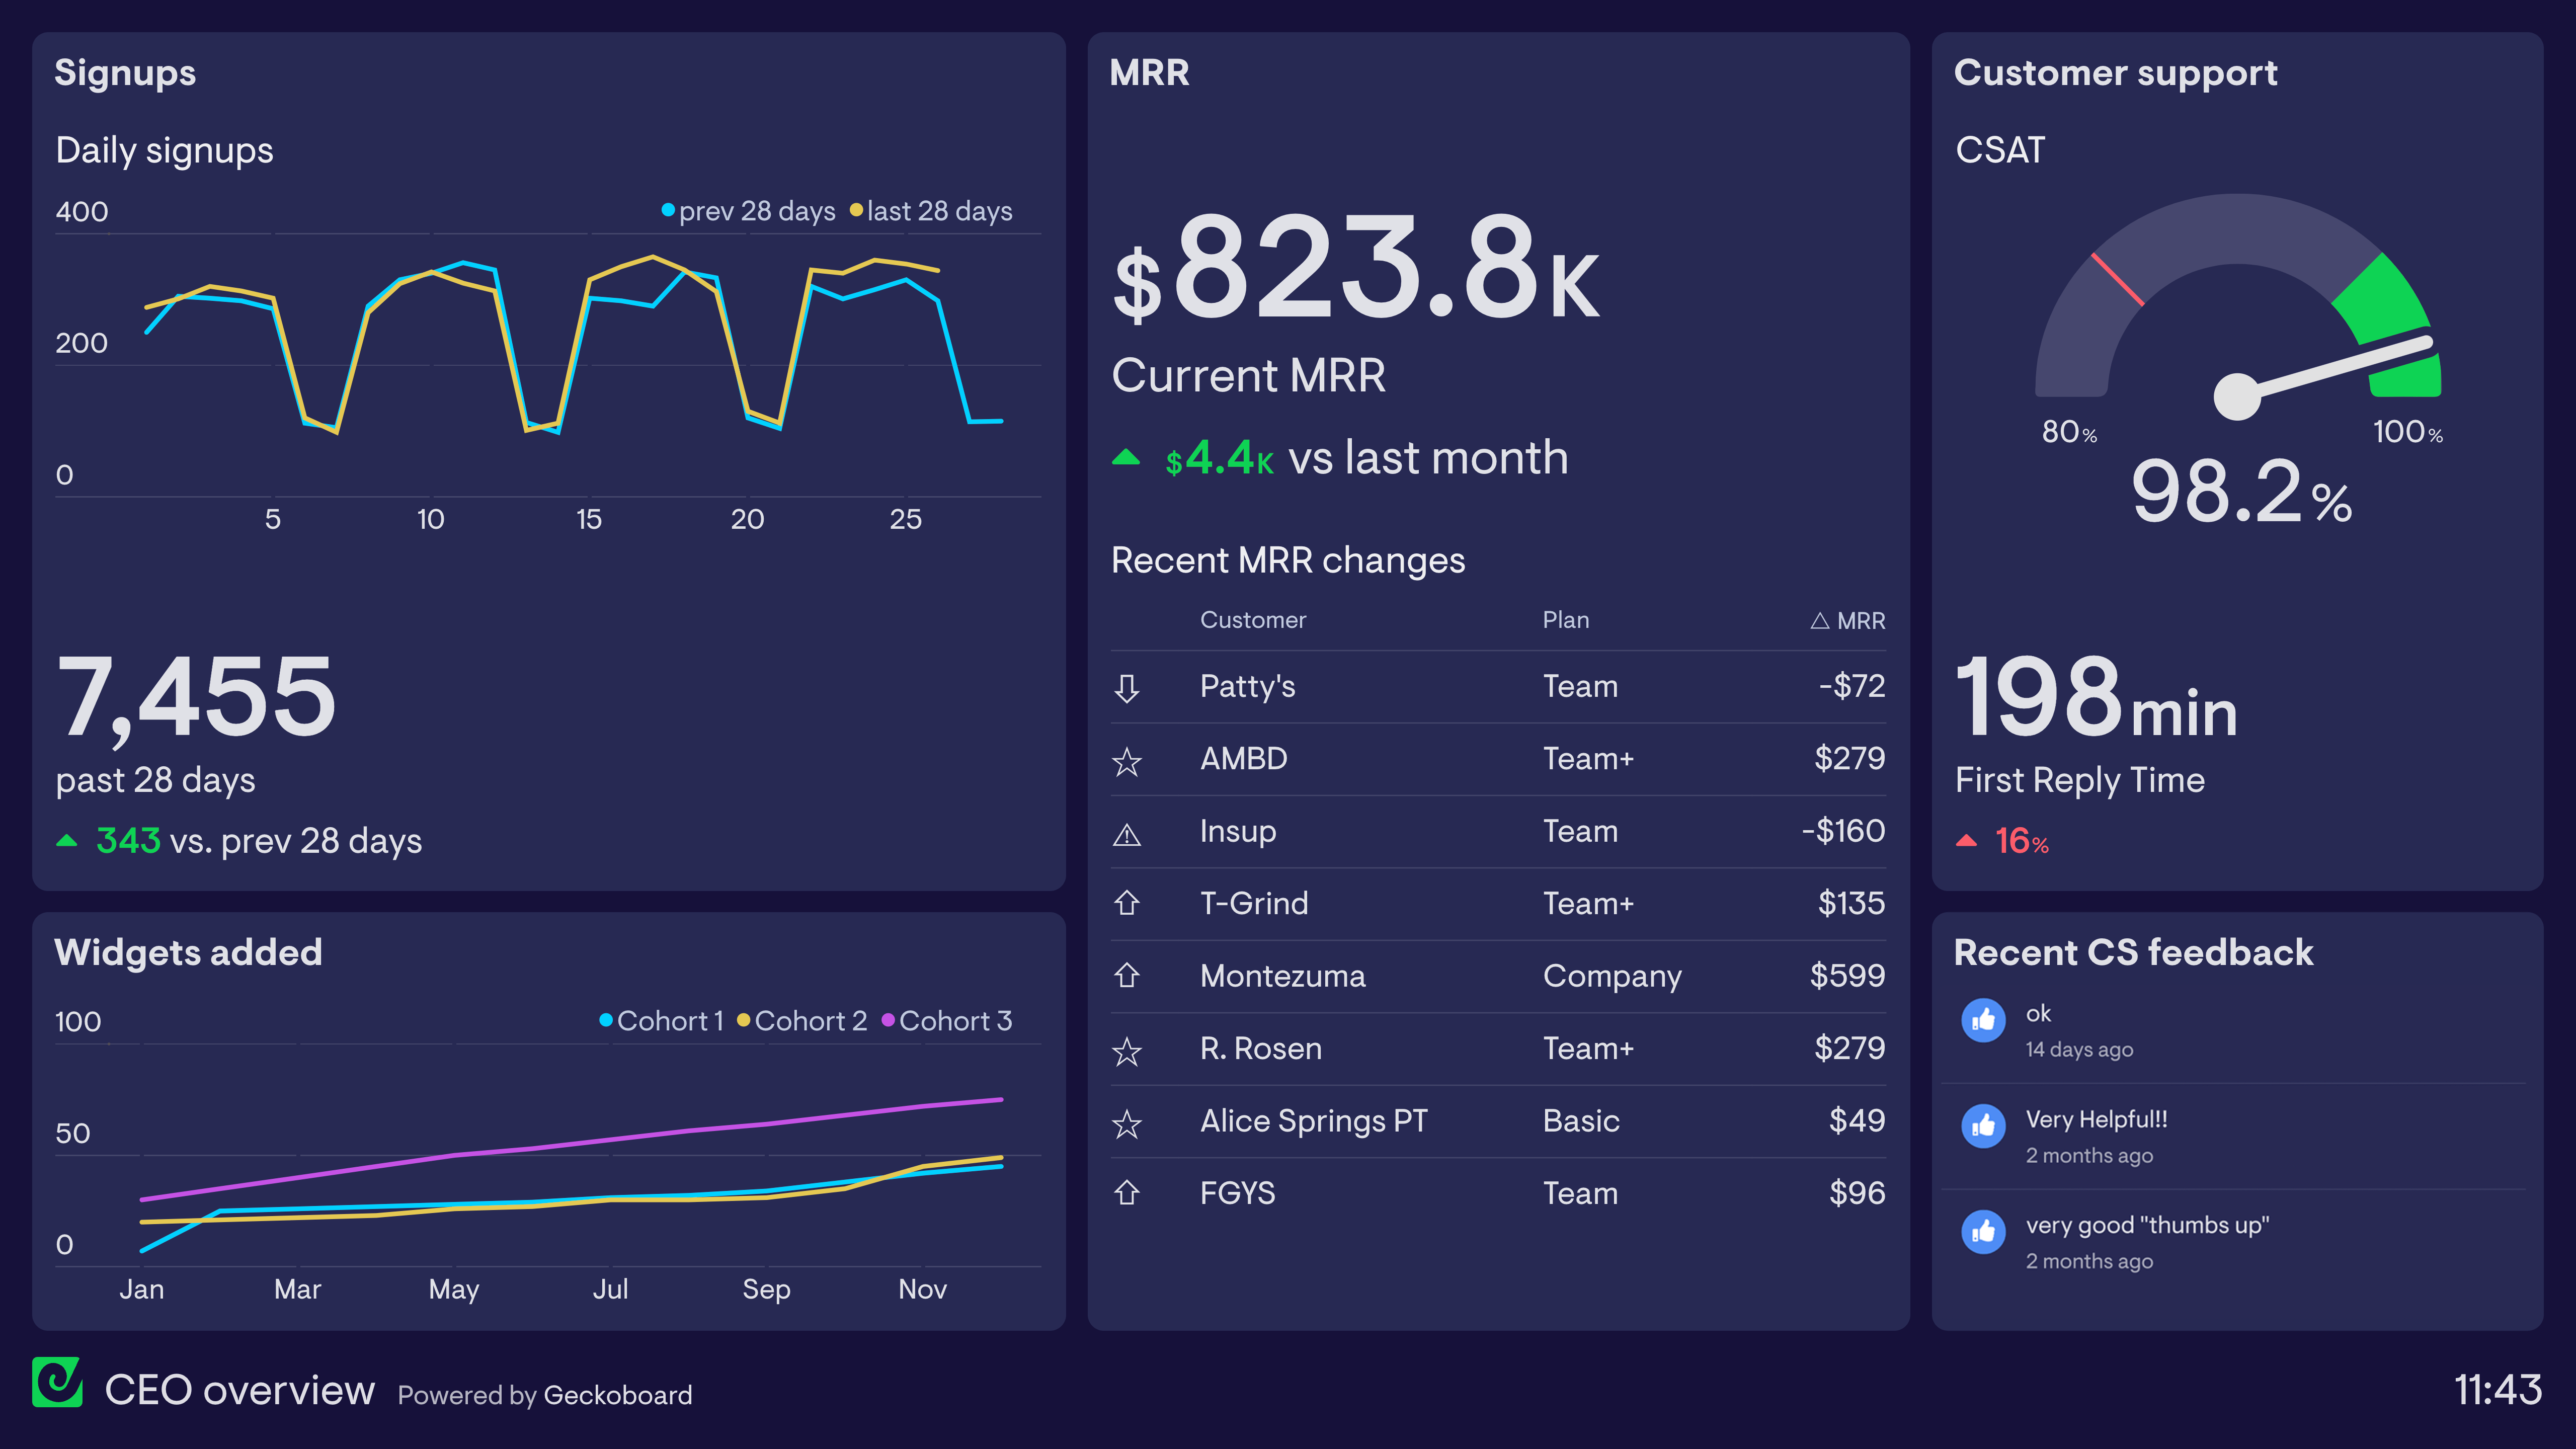
When your business starts to grow, and the founder takes on responsibility for building the organization, it can be hard to stay rooted in the customer experience. Although this CEO dashboard isn’t a substitute for true customer insight, it helps to build a customer-centric view of their SaaS business across many different functions and touchpoints
The CEO can easily see how many new customers are signing up to a trial, as well as important high-level metrics on product usage, account changes, and customer service. Furthermore, it provides valuable contextual information which the CEO might otherwise miss – such as the types of customers who are buying, changing or canceling their plans, as well as the general tone and content of customer feedback.
Executive Summary dashboard
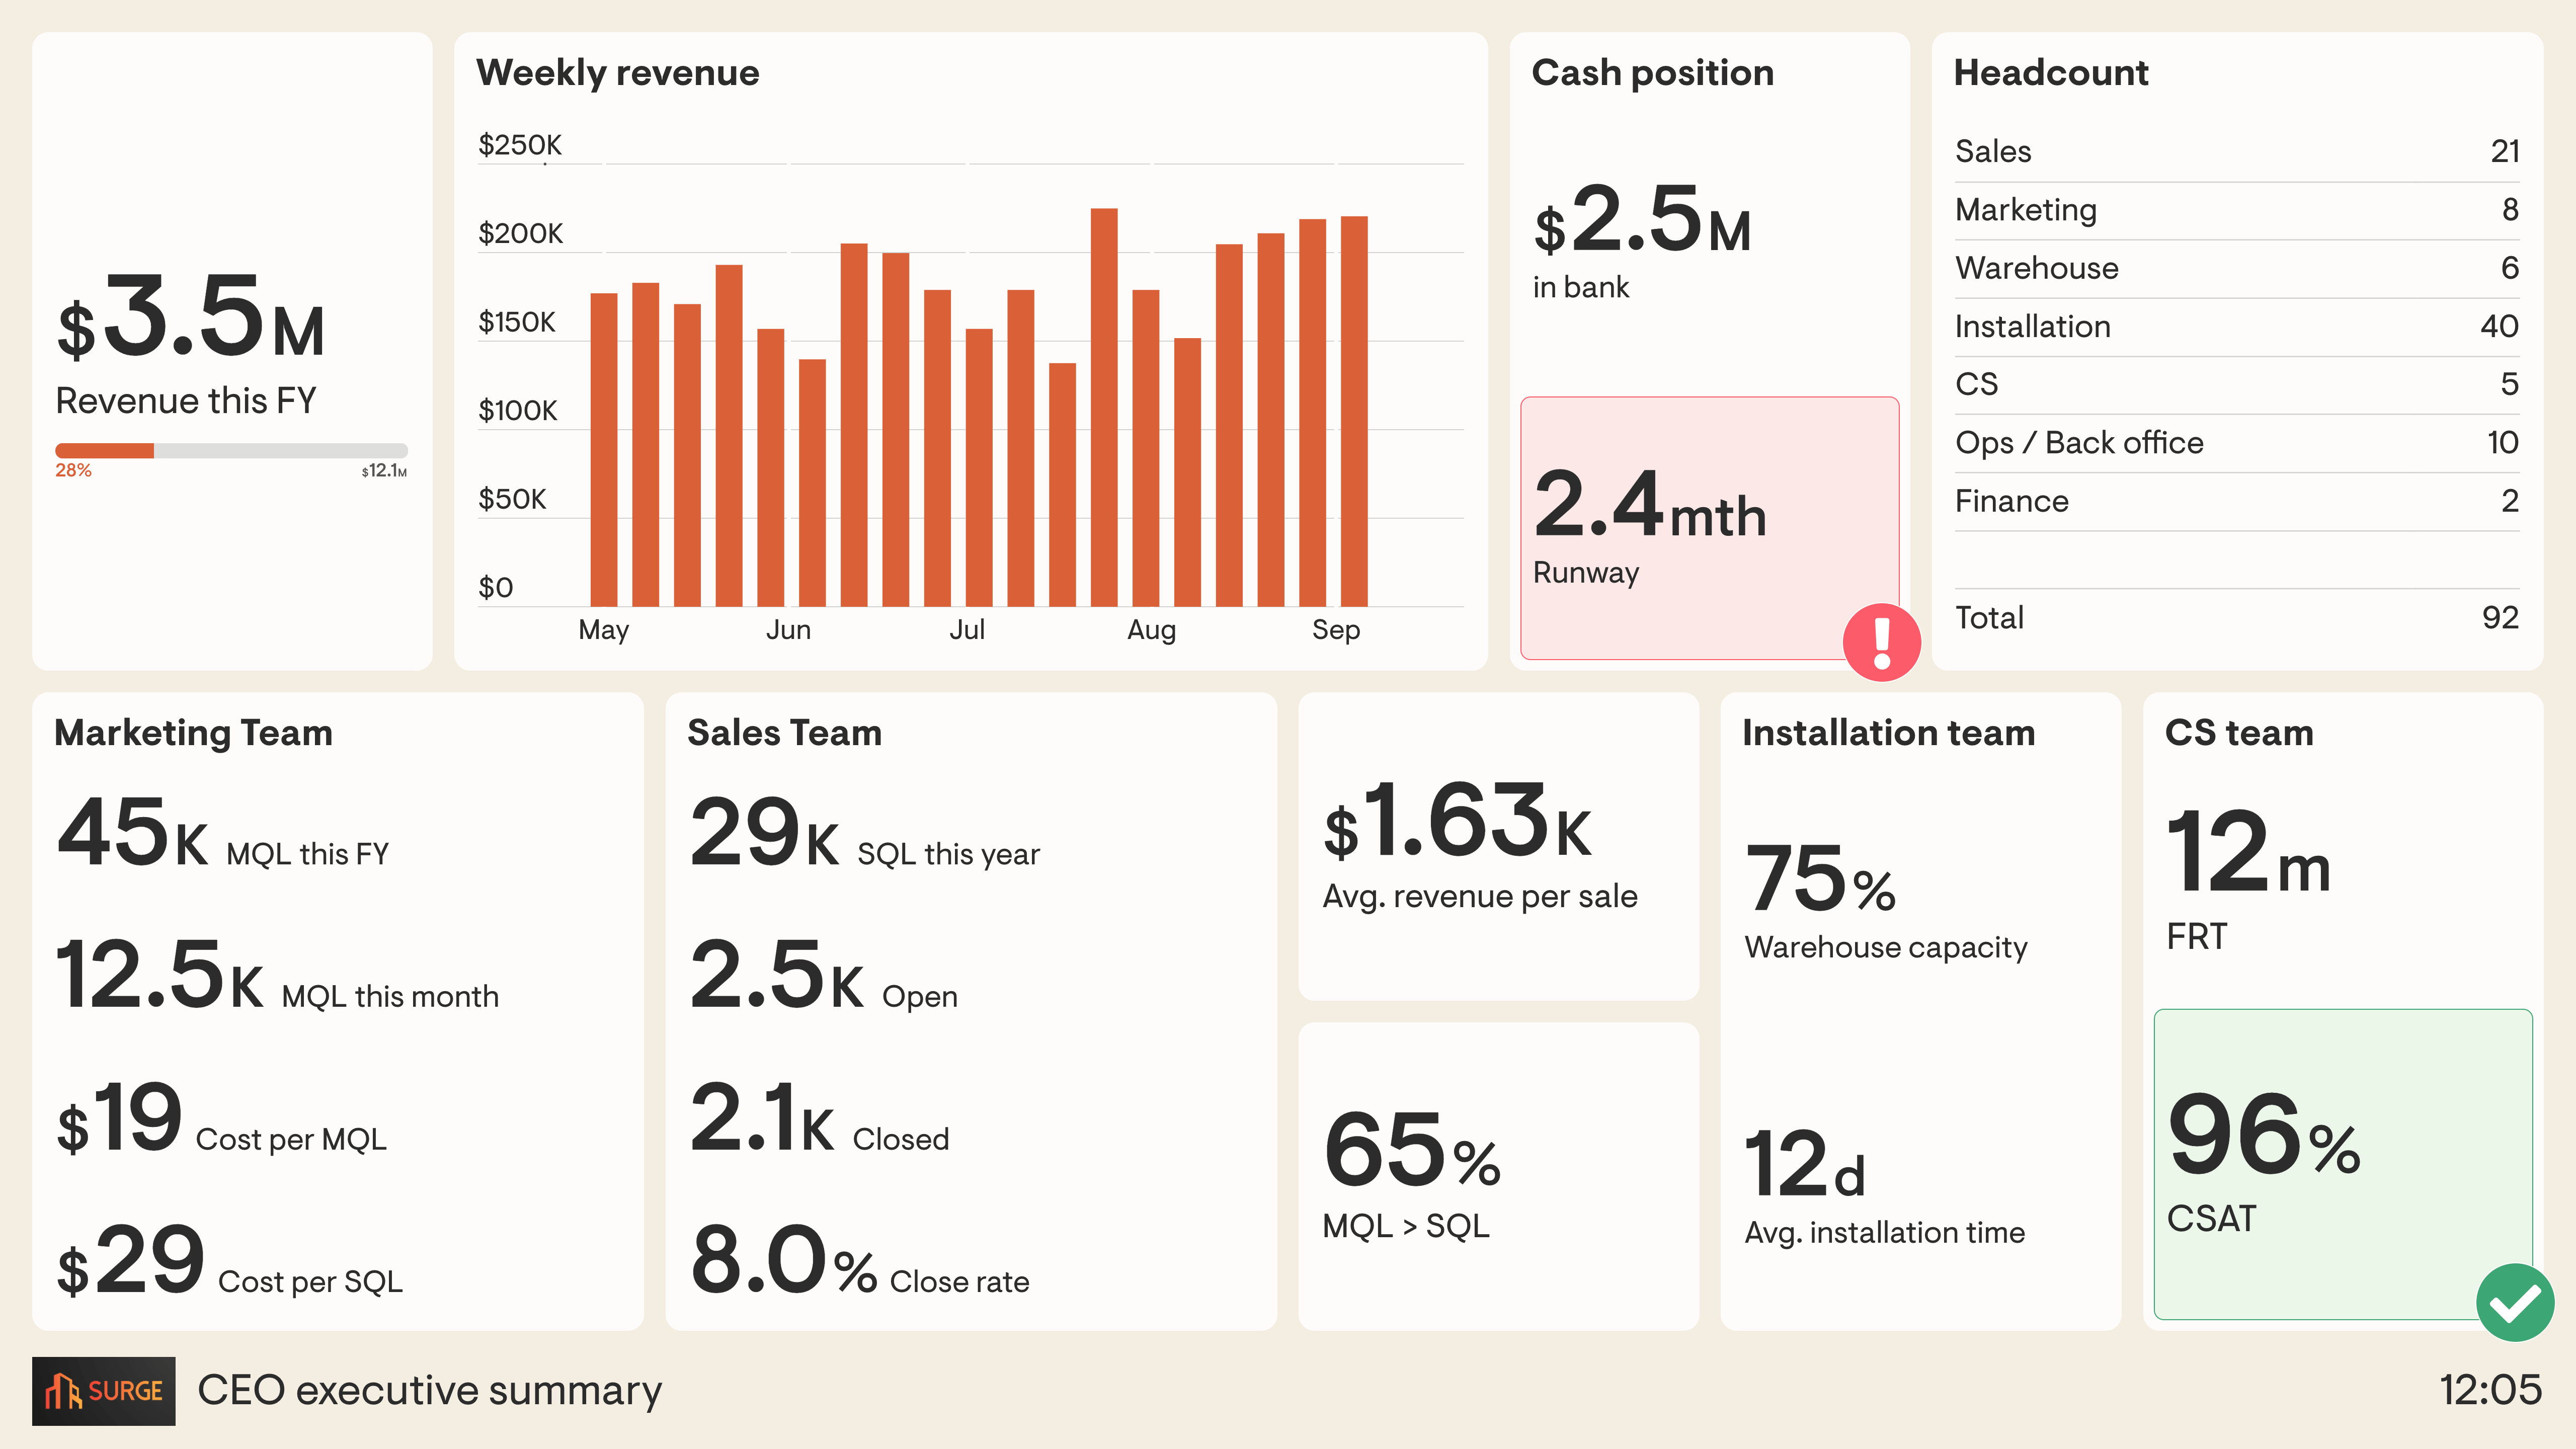
In a fast moving business, it can be difficult to keep track of how each team is handling their work. That’s why executive summary dashboards take high-level KPIs from each team, and put them together, in one place. This dashboard helps the CEO understand if any one team is struggling with their workload, or has spare capacity. It makes it easier to spot any potential bottlenecks in the customer journey.
For example, this company, which sells and installs electrical appliances, has created a dashboard that takes KPIs from the marketing, sales, installation and customer service team, alongside company finance metrics. Because all of the information is in one place, it’s easier to develop a full picture of what’s going on in the business.
The CEO can easily see if a sudden increase in sales is likely to affect the demands on the installation team. If they are overly stretched, the CEO can step in to avoid a bottleneck. They can also easily see the interdependent relationship between Marketing, who generate Marketing Qualified Leads (MQL) and the Sales team who further qualify those leads (Sales Qualified Leads - SQL) before working to convert them into sales.
Browse other popular examples
A CEO dashboard gives the chief executive a single-screen view of company-wide performance across sales, product, support, and finance. It replaces the need to pull weekly reports from multiple team leads, giving the CEO a live summary of the metrics that matter most for steering the business.
Geckoboard is a live dashboard tool that connects across CRM, finance, product, and support data to give company leaders a single view of business performance. Dashboards stay current automatically — so executives can check performance at any time without asking someone to compile a report.
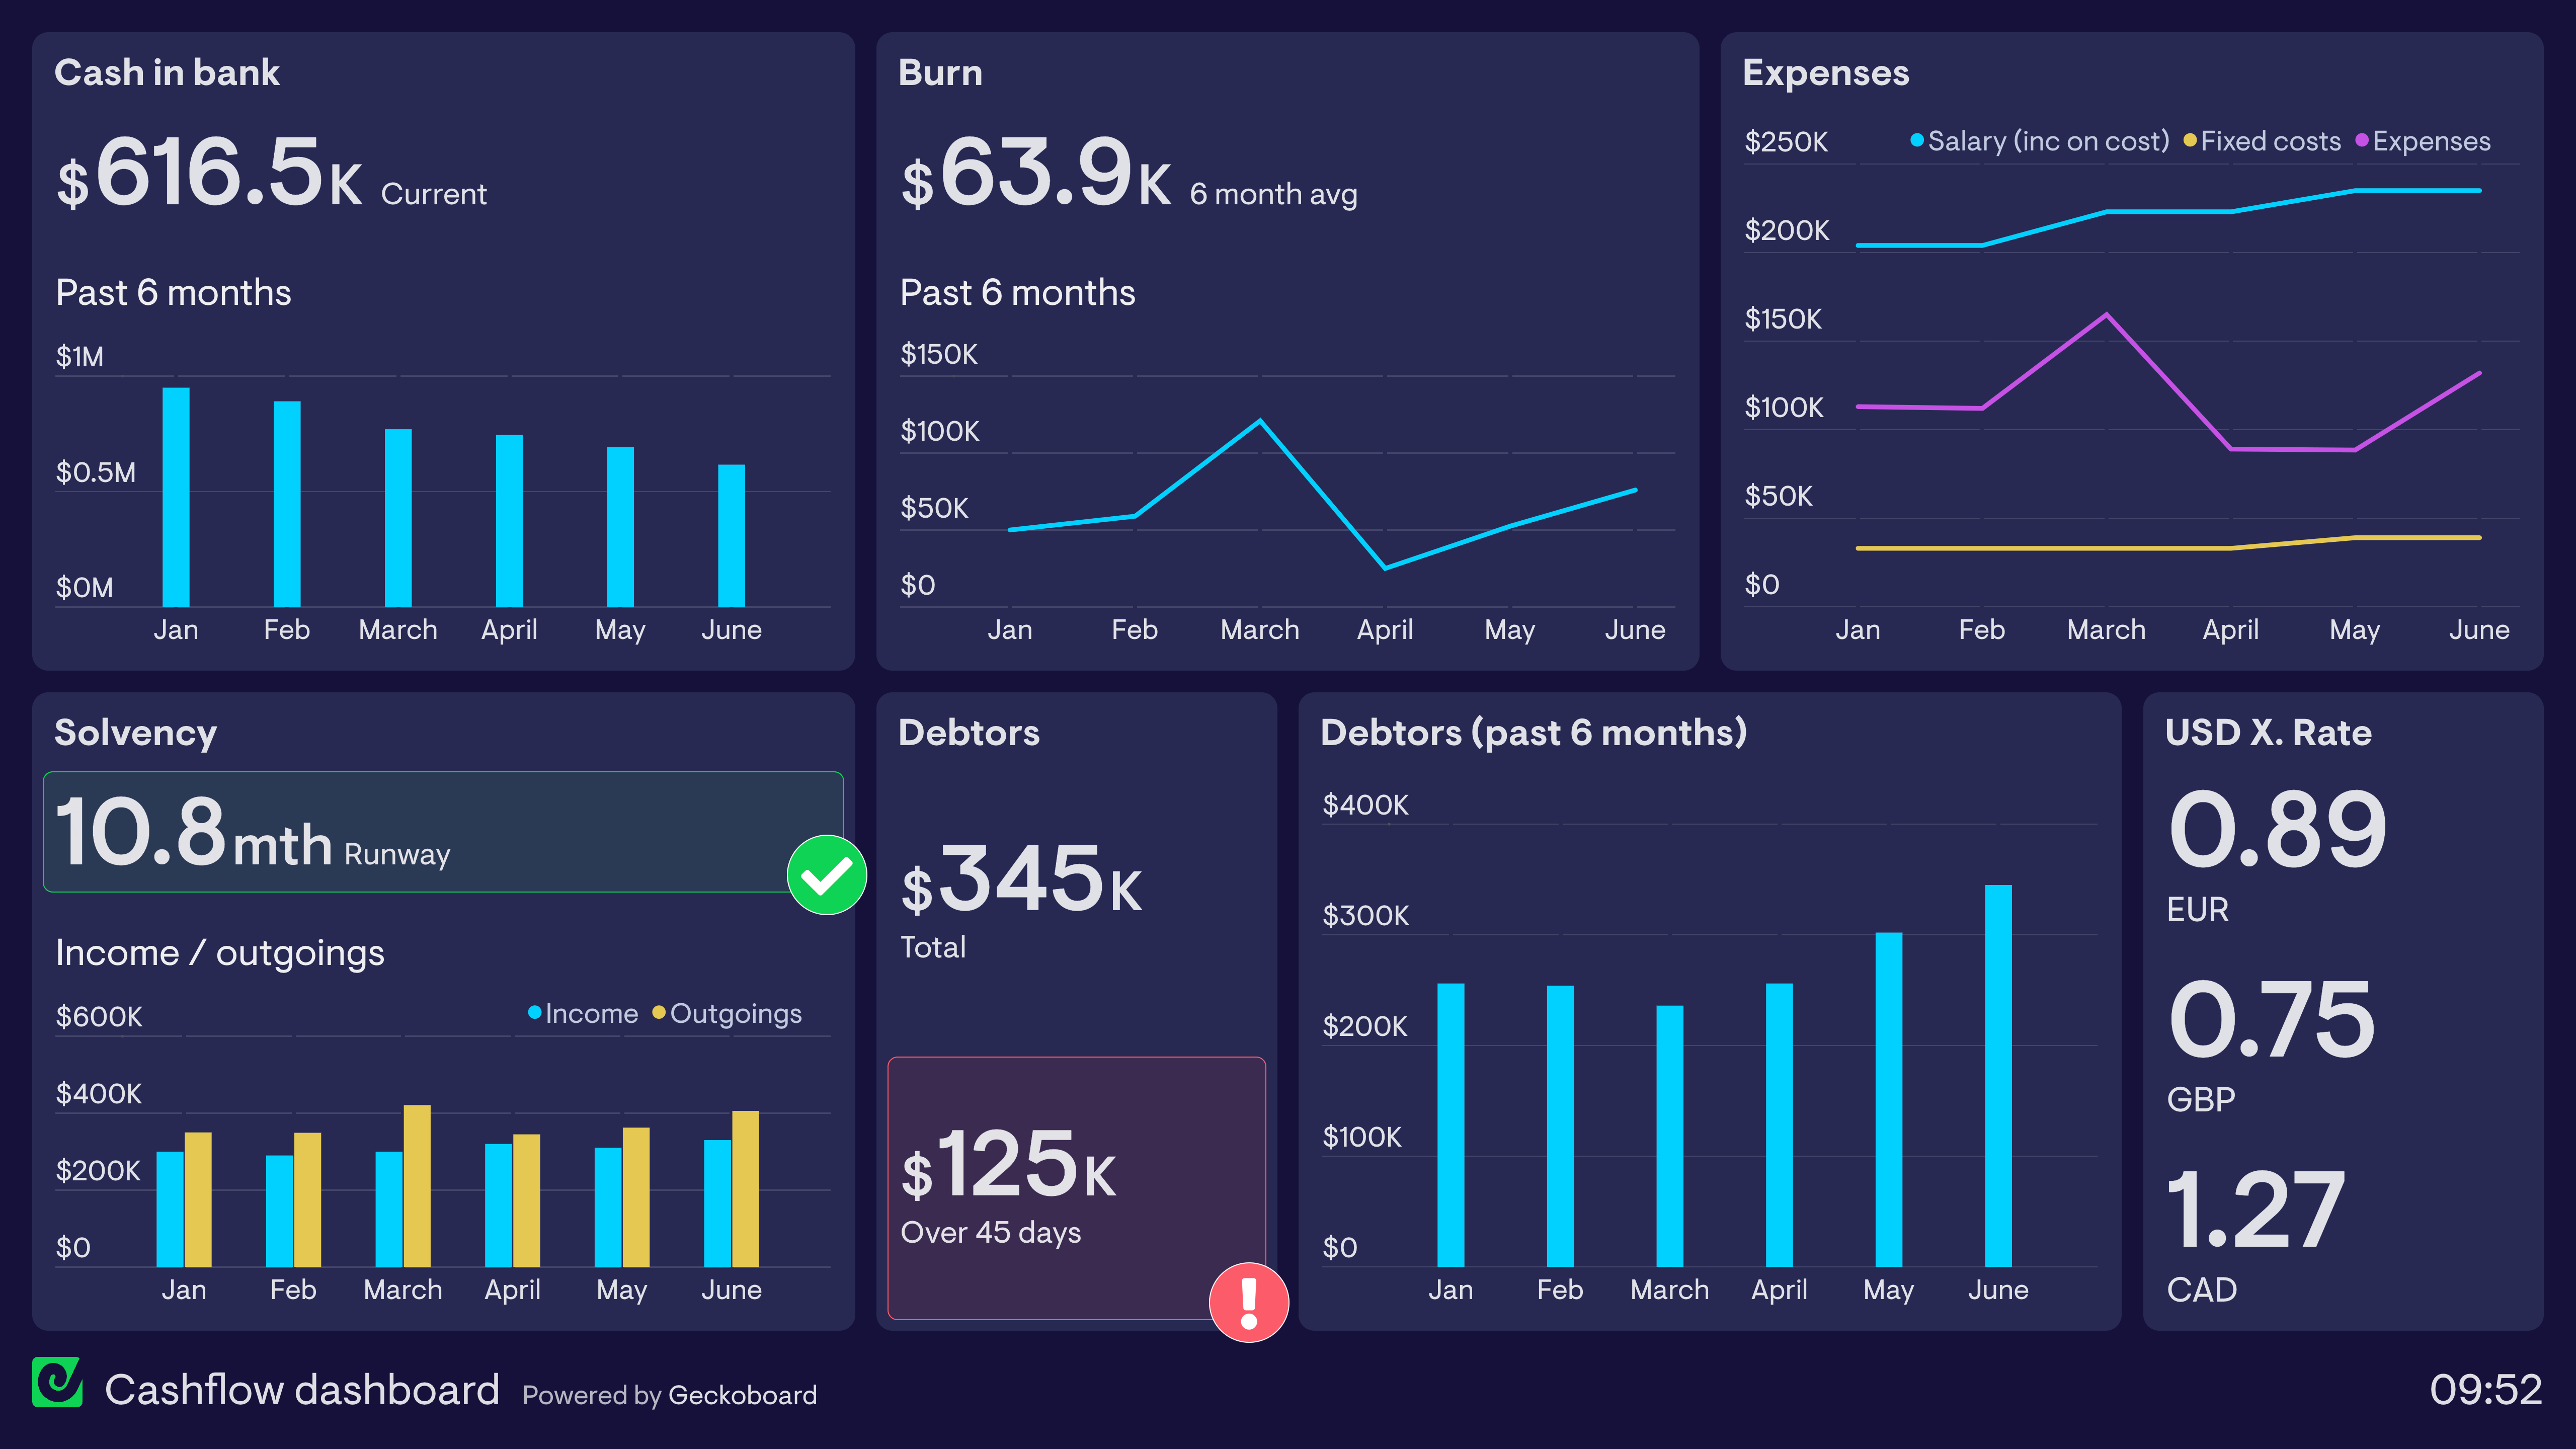
Typical metrics include MRR, new customers, churn rate, pipeline value, support ticket volume, NPS, and product usage. CEOs often layer in financial health indicators like burn rate or cash runway alongside operational KPIs.
Building a custom CEO dashboard is straightforward with Geckoboard's dashboard builder. Connect Salesforce, Zendesk Support, Mixpanel, and SQL databases and custom data sources to bring each function's core data together, then pick your metrics and build the view you need. Share with your team as a TV dashboard, shared link, or scheduled snapshot. Start a free trial or learn more about how Geckoboard works.
Use it to deliver executive visibility without requiring a weekly report-gathering cycle across every department. It also helps bring data together — giving a CEO one place to see how sales, support, and product are all performing without jumping between tools.