Operations dashboard examples
Real-world dashboards used by operations teams to track IT, OKRs, health and safety, sustainability, inventory and warehouse performance.
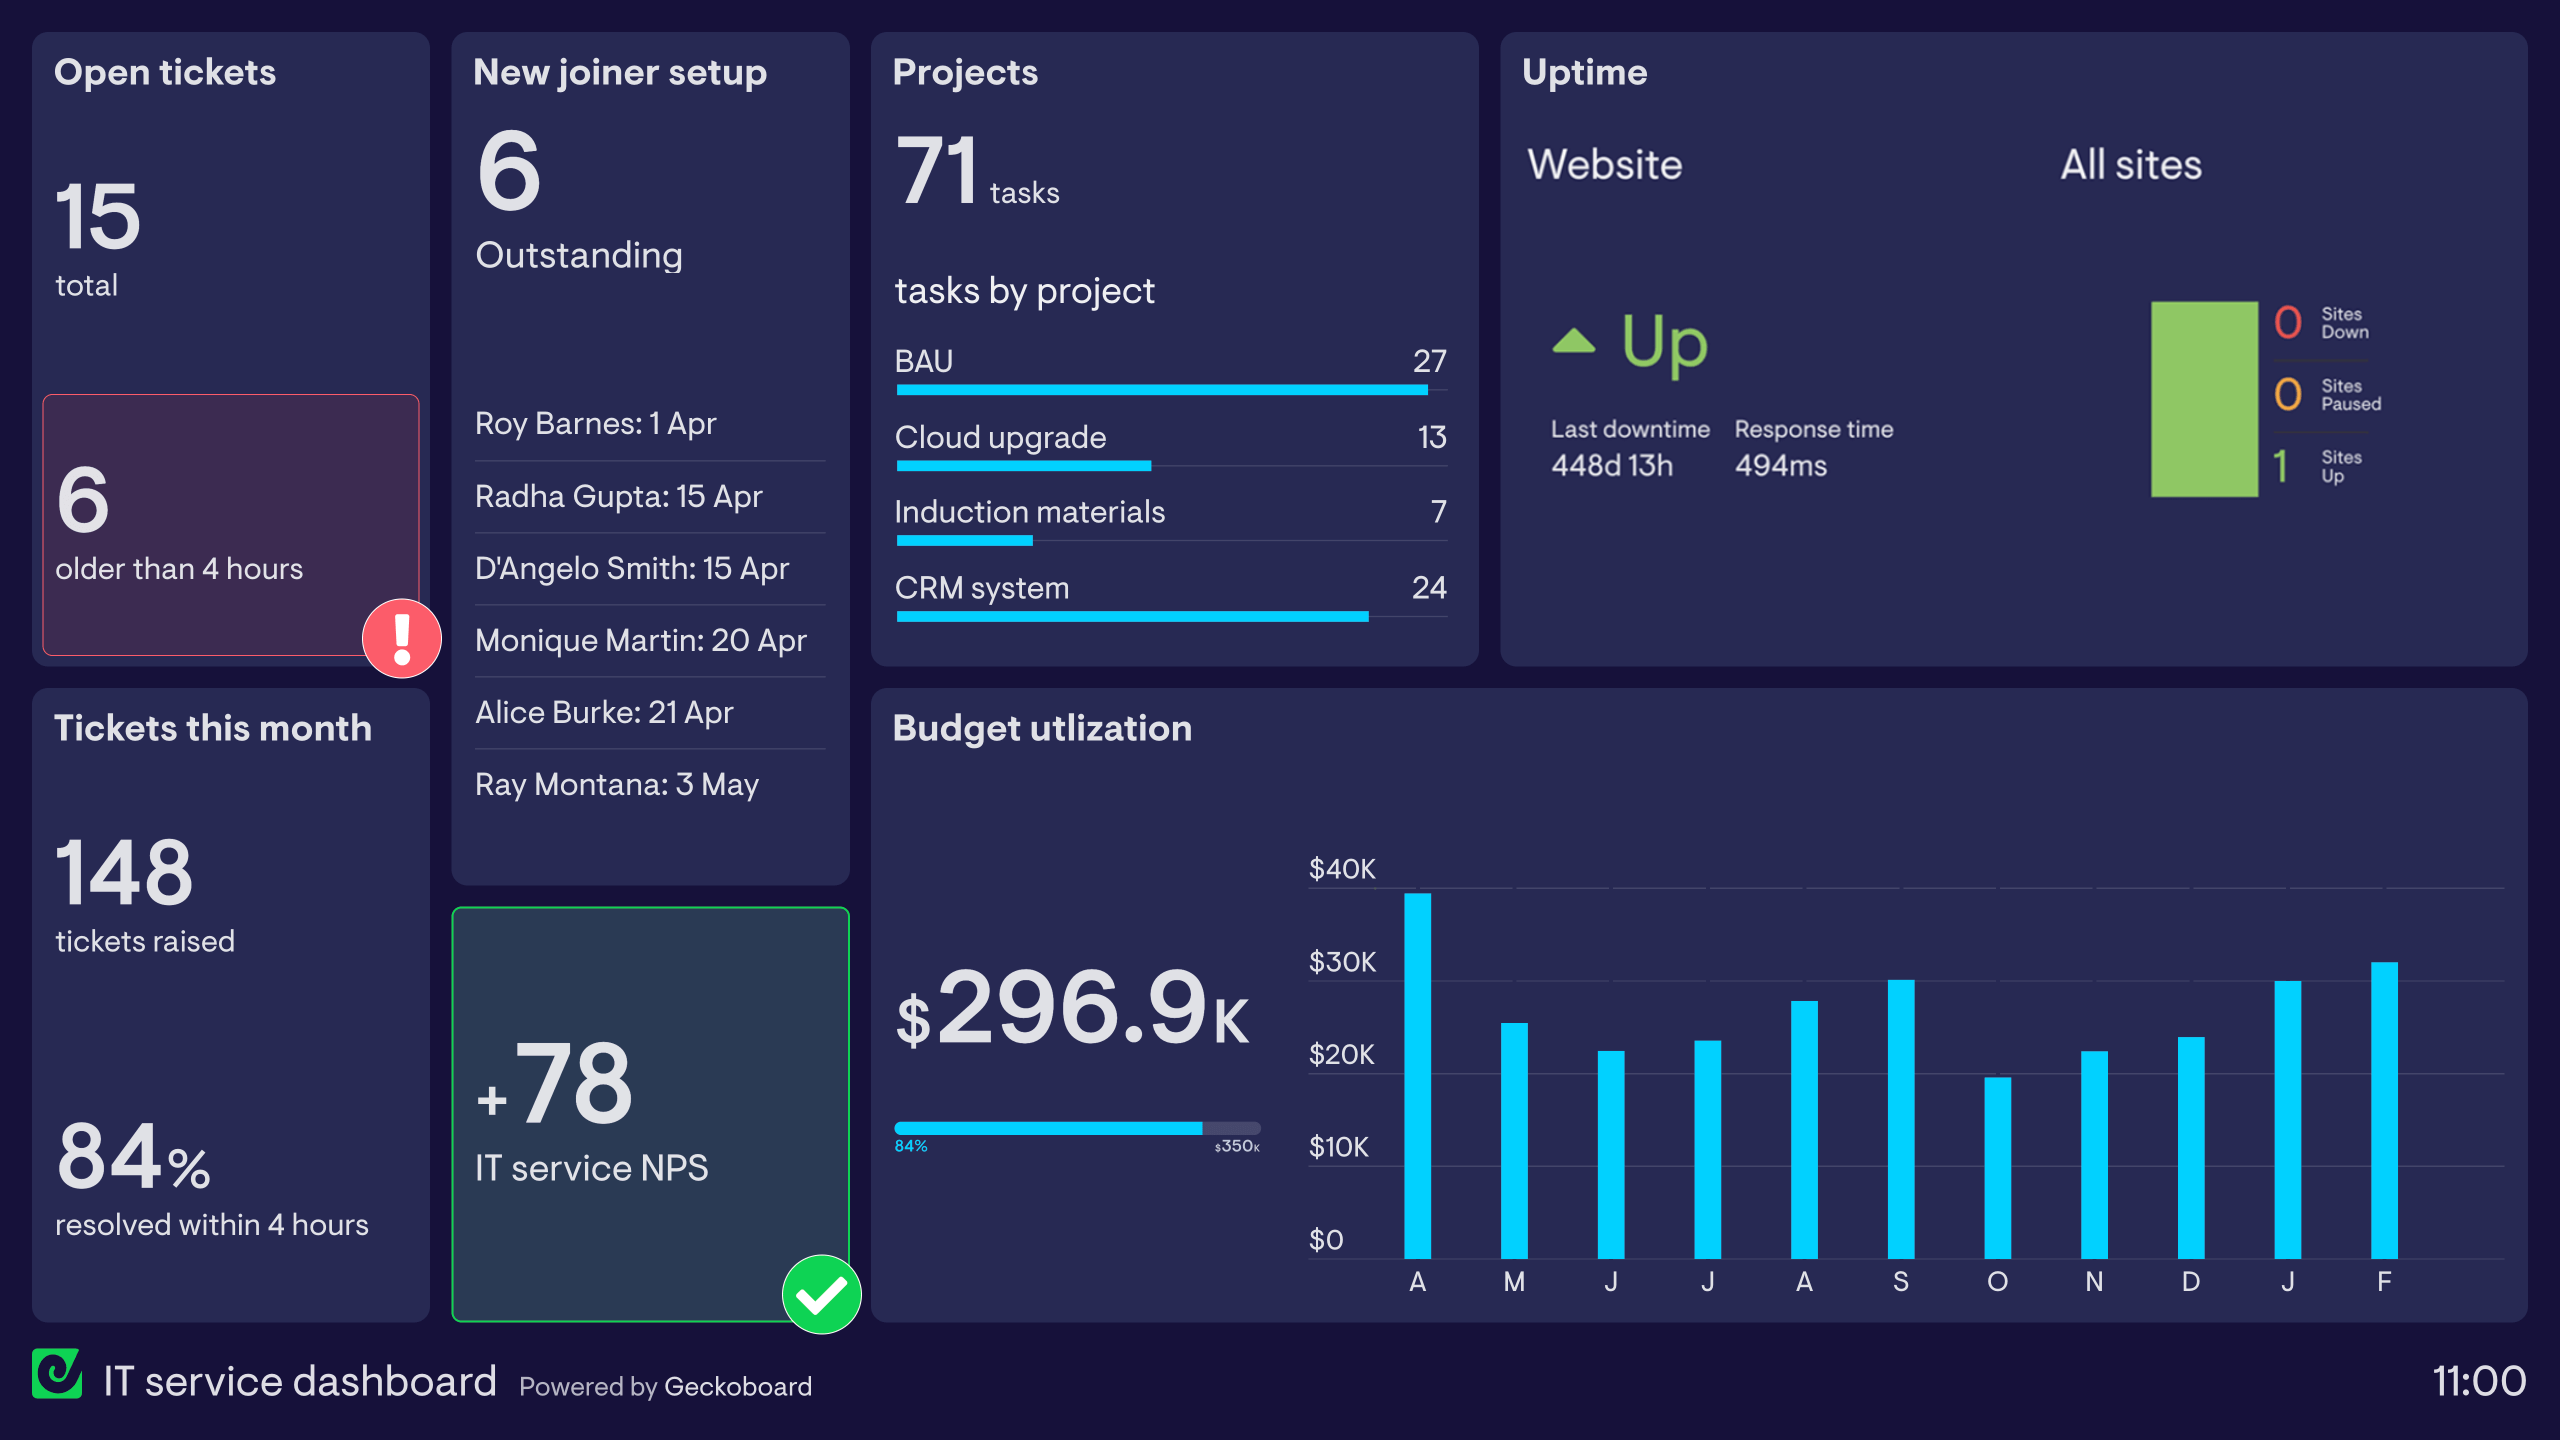
IT dashboards
IT dashboards can be used by IT teams to monitor technical systems and processes, as well as support the day-to-day running of the team.
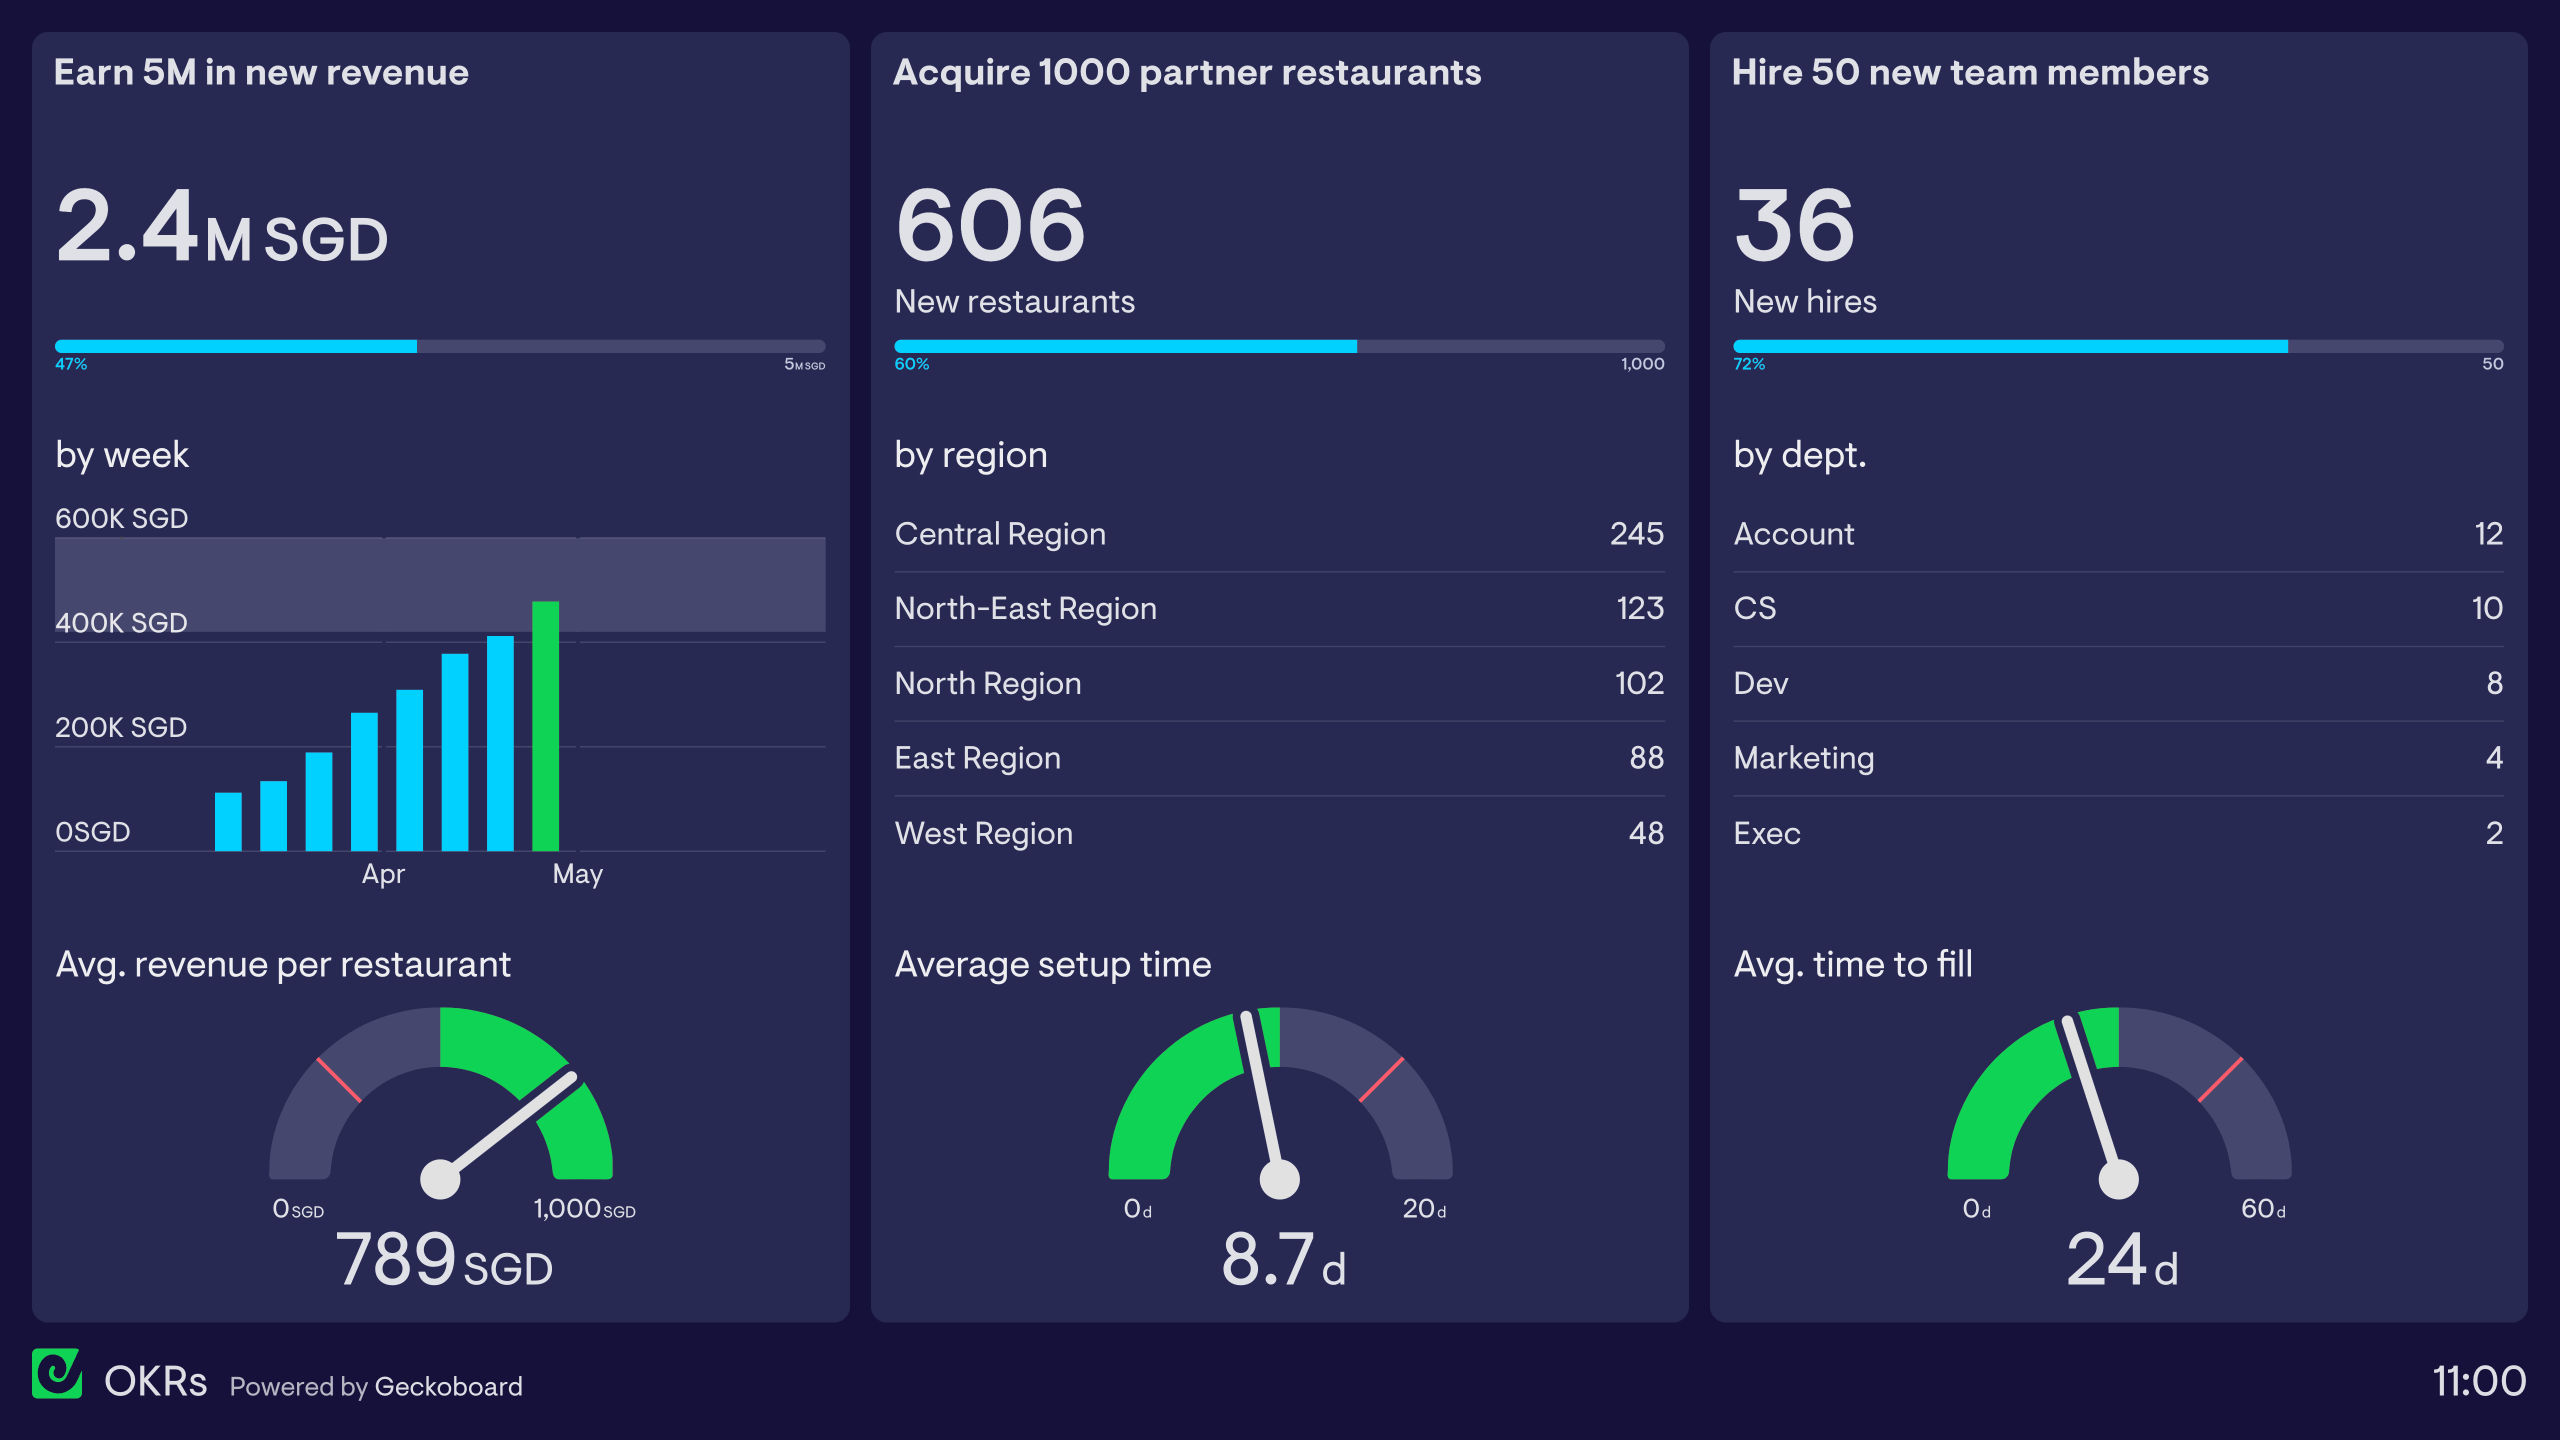
View dashboardsOKR dashboards
OKR dashboards track progress against OKRs (Objectives and Key Results) – a type of goal-setting methodology.
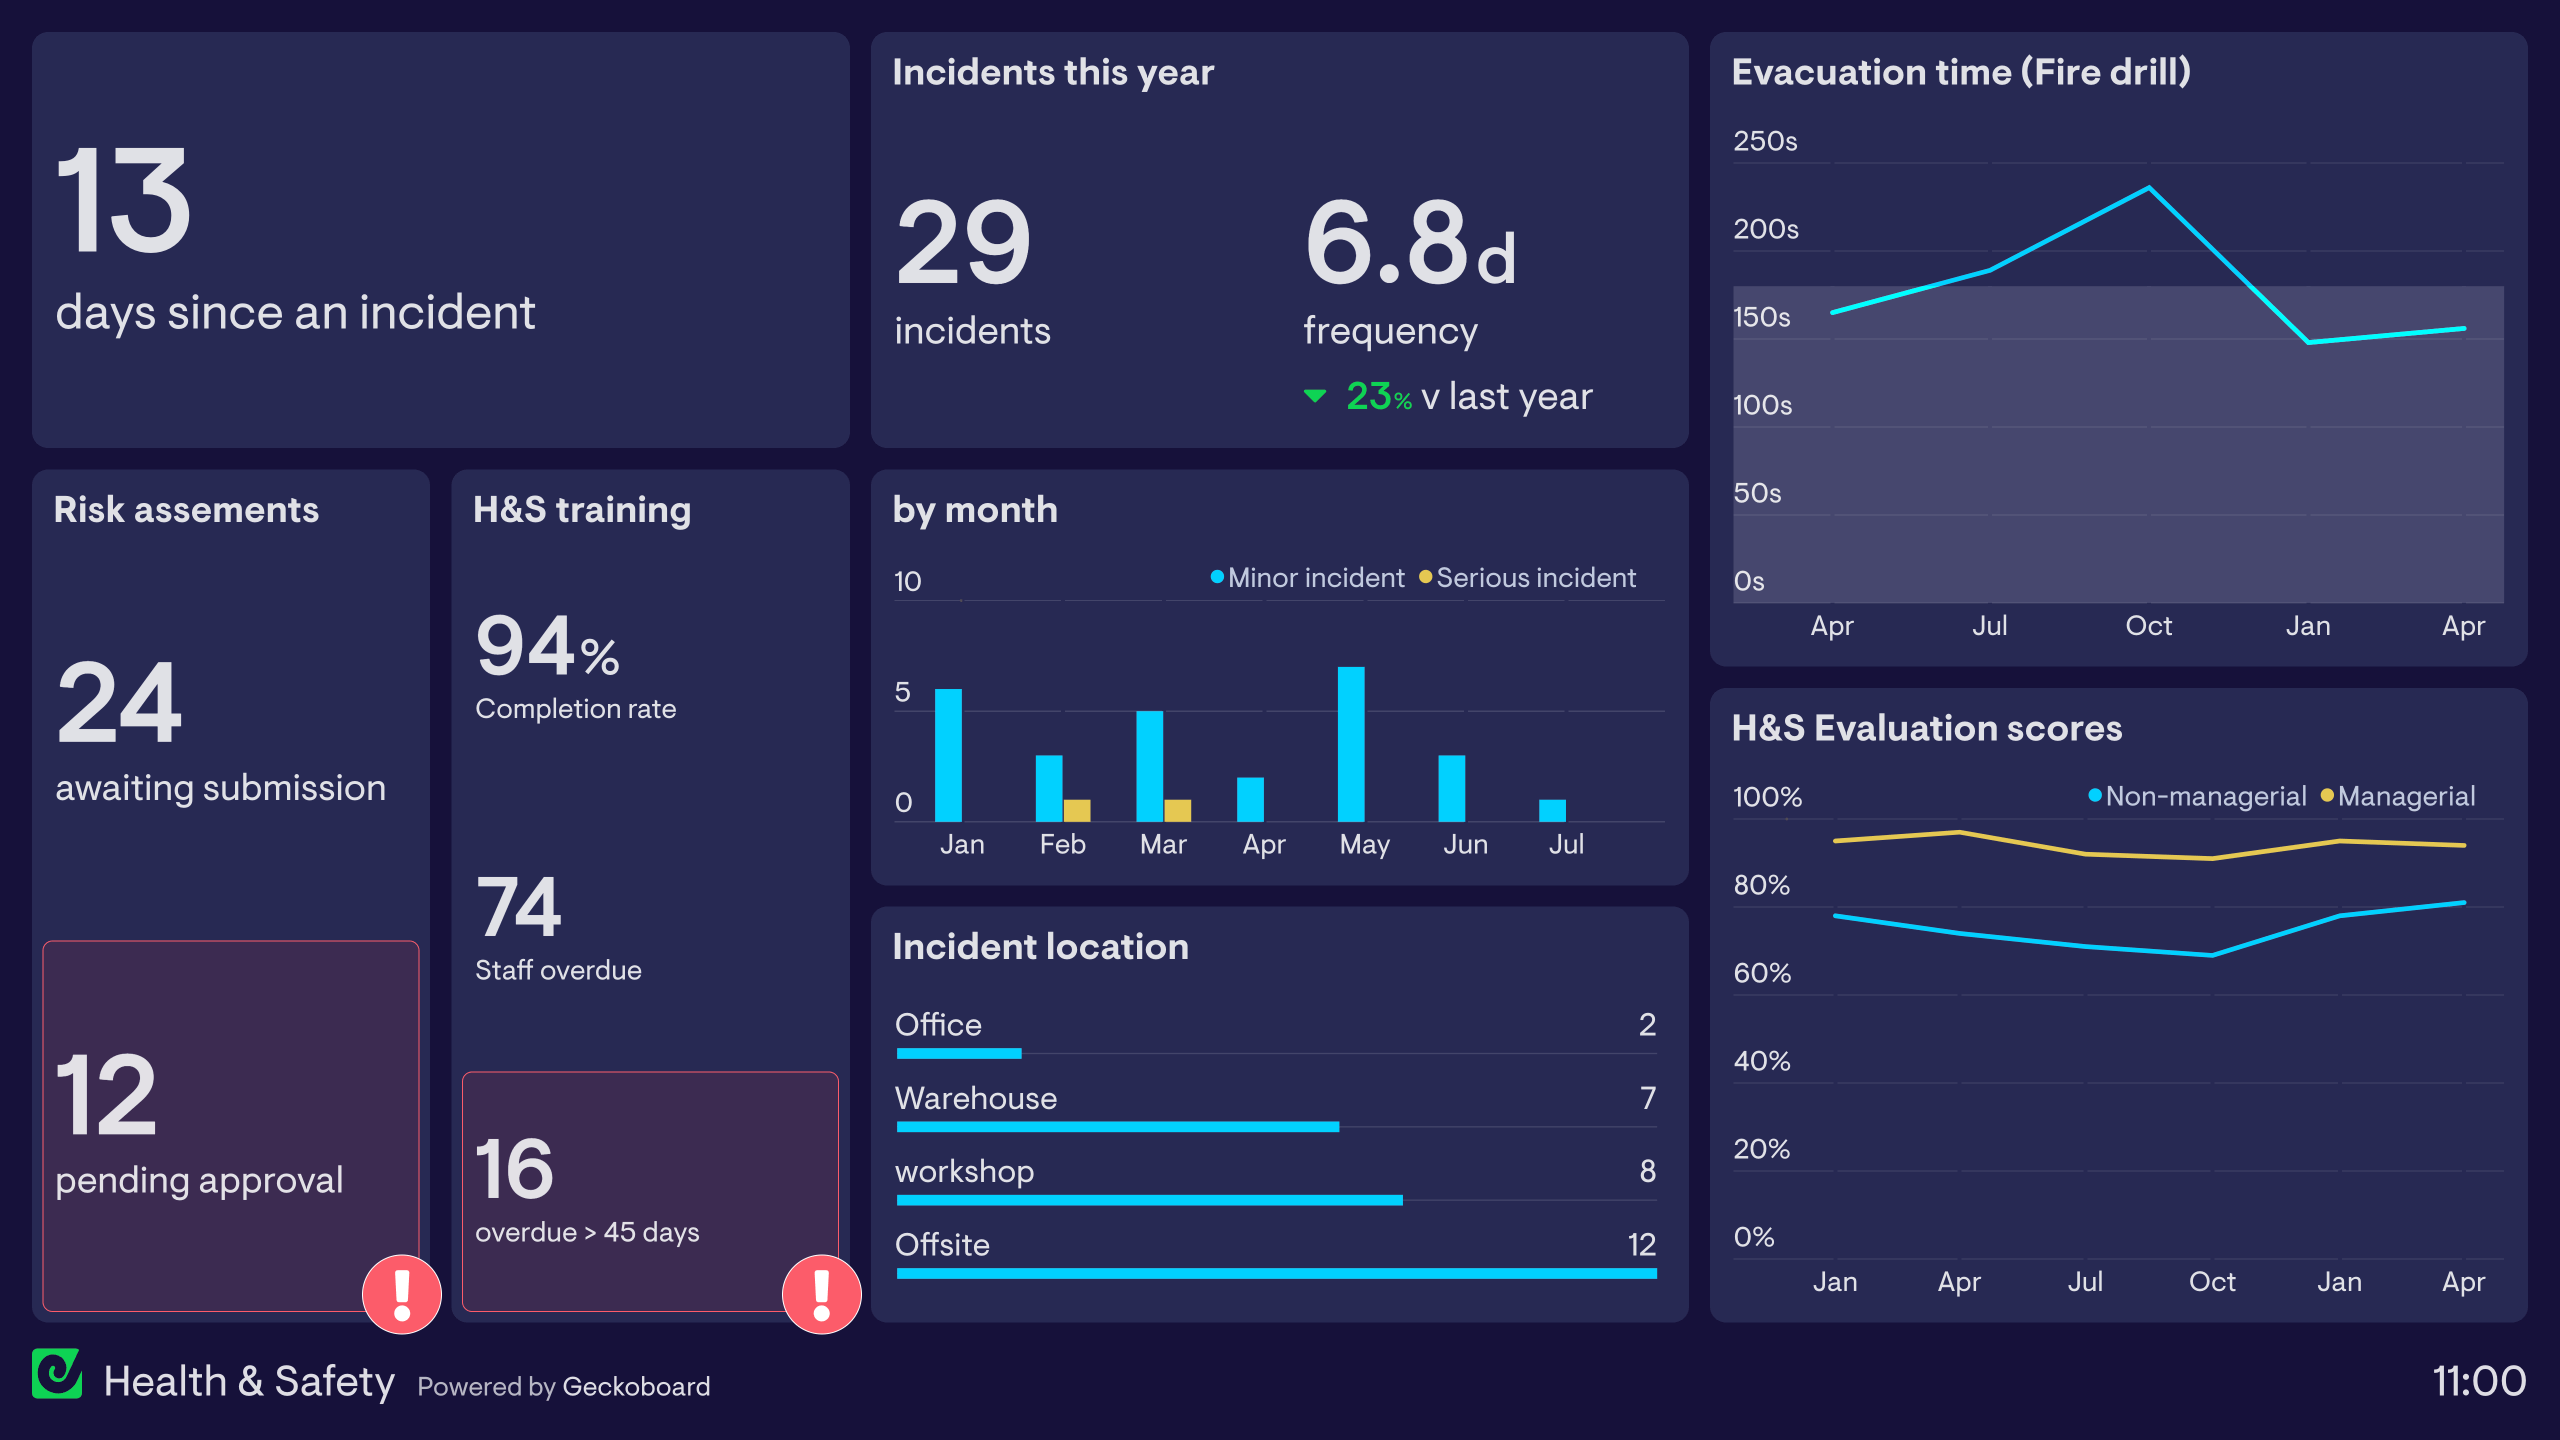
View dashboardsHealth and Safety dashboards
Health and Safety dashboards visualize various metrics related to a company’s Health and Safety practices, together, in one place.
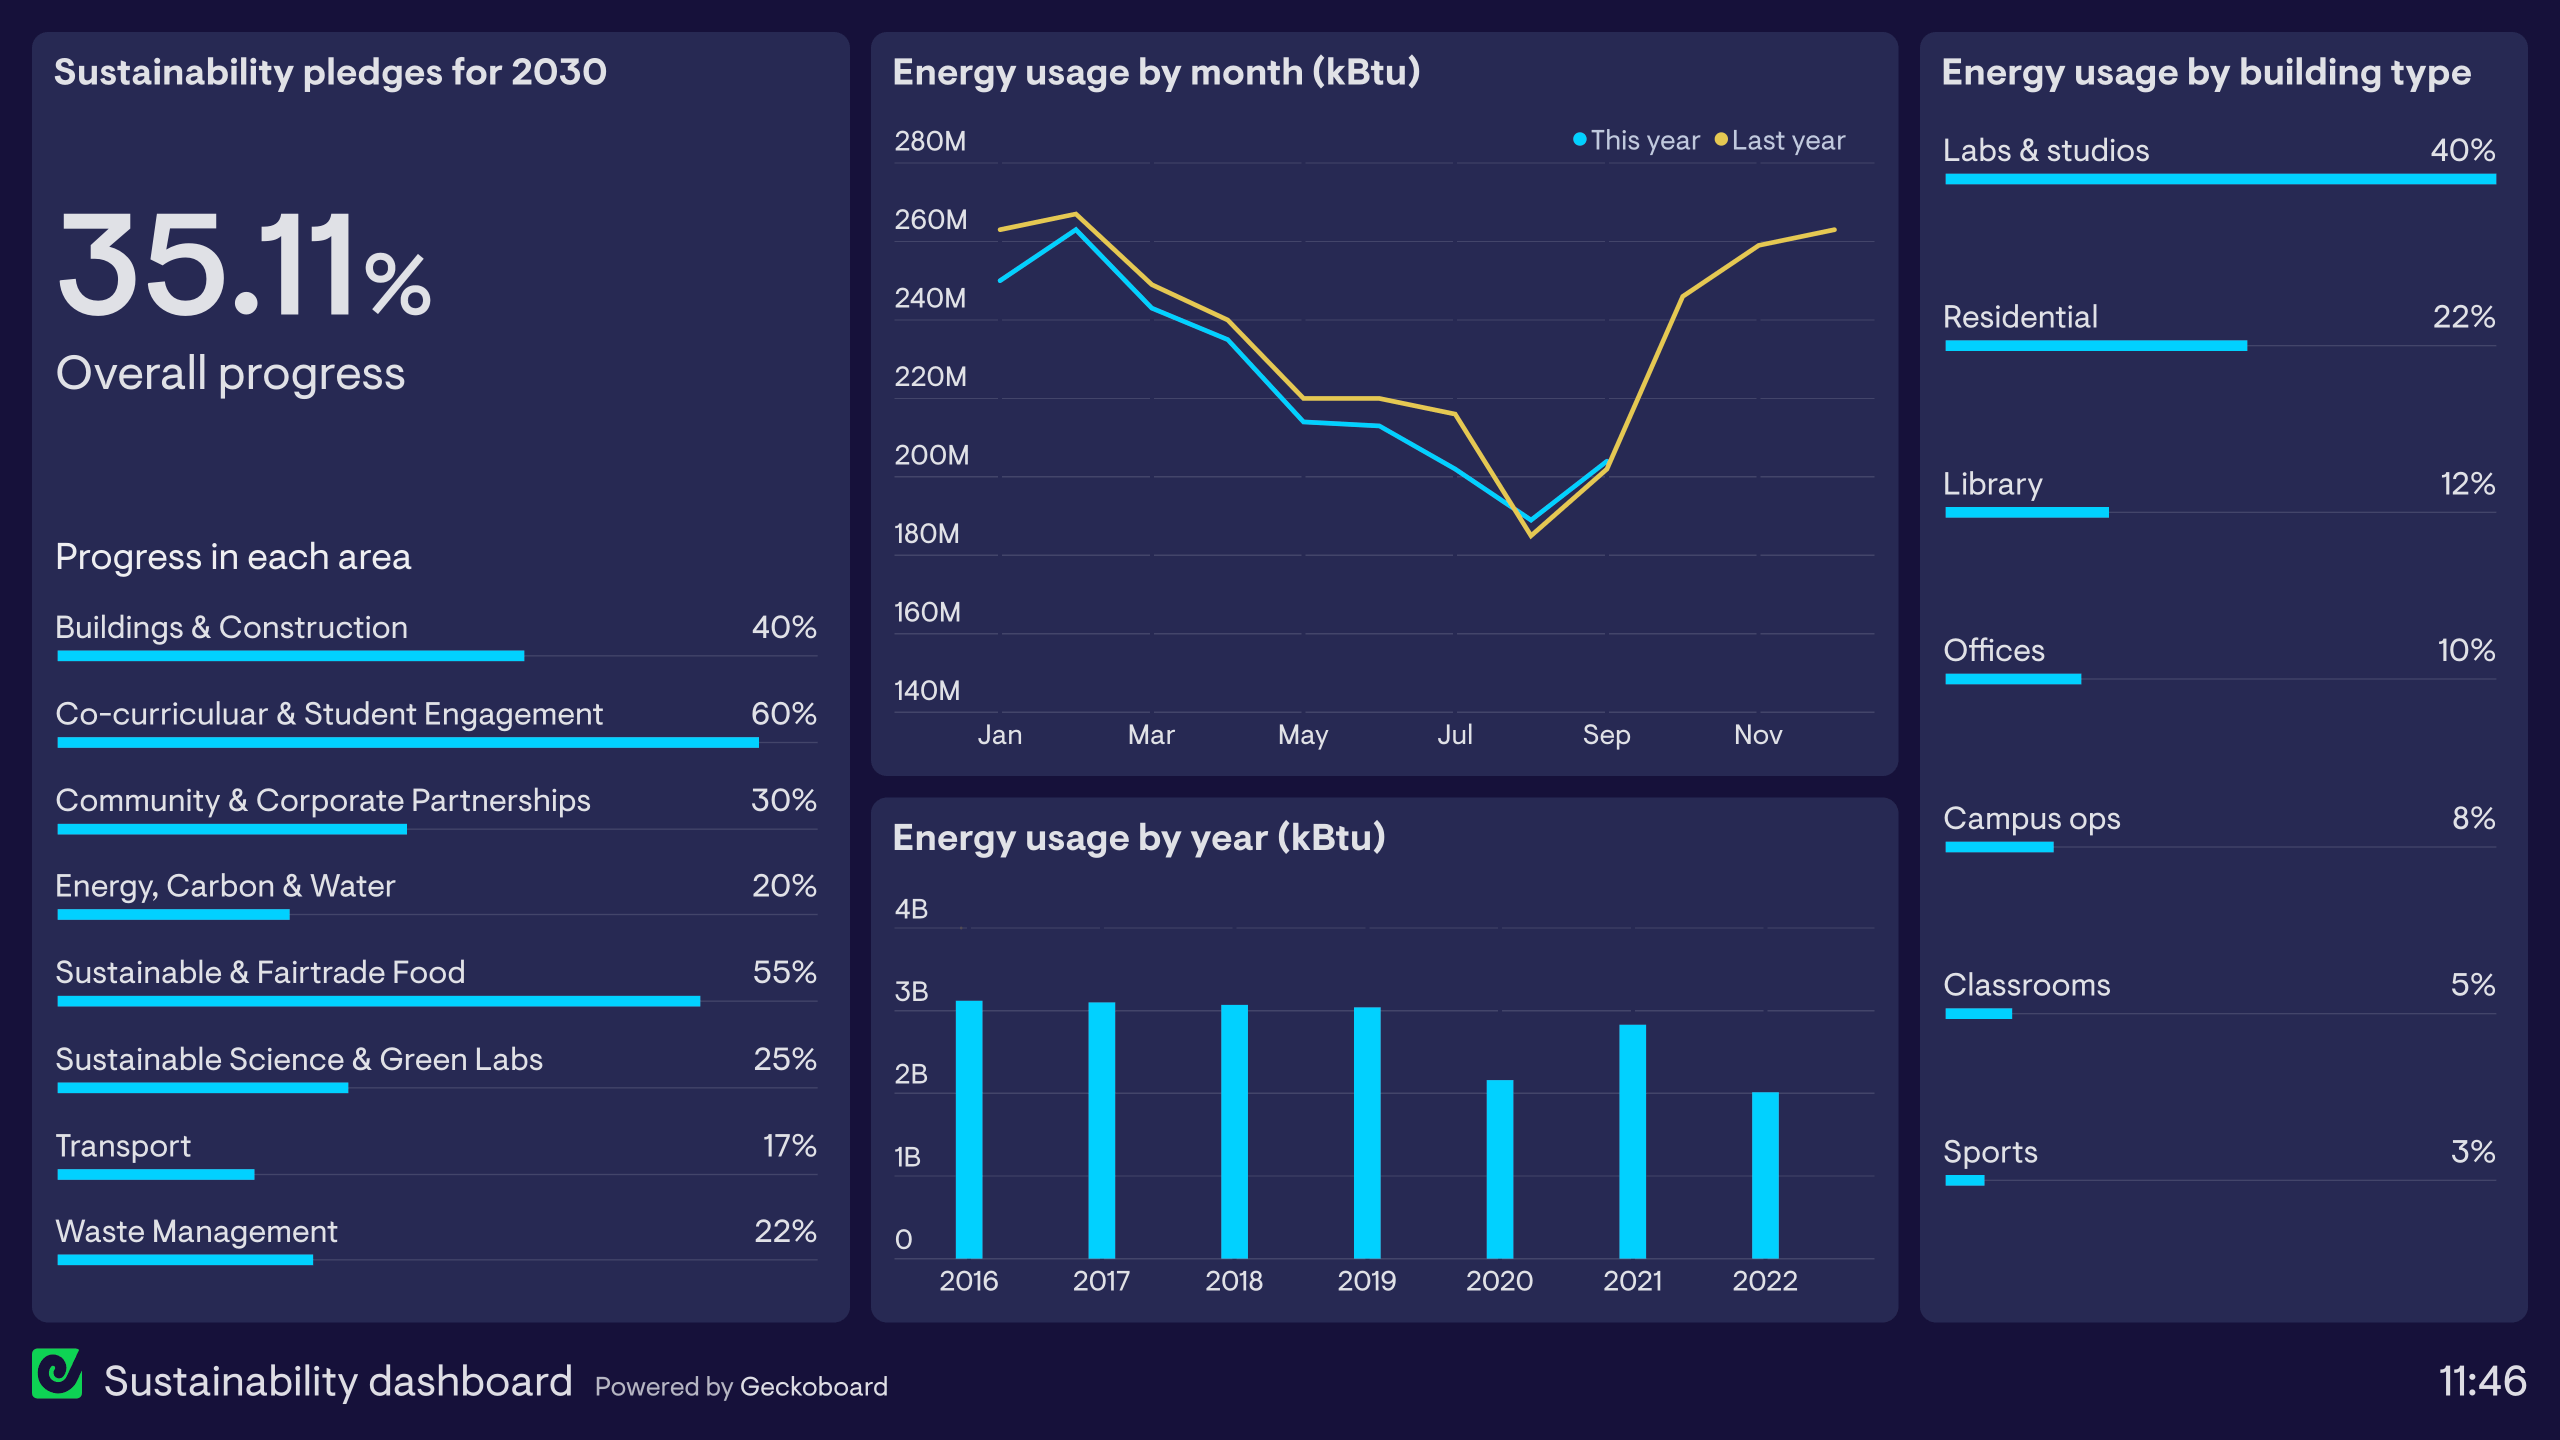
View dashboardsSustainability dashboards
Sustainability dashboards help organizations track their progress towards sustainability goals, for example, by helping to monitor energy usage or communicate the progress of sustainability pledges.
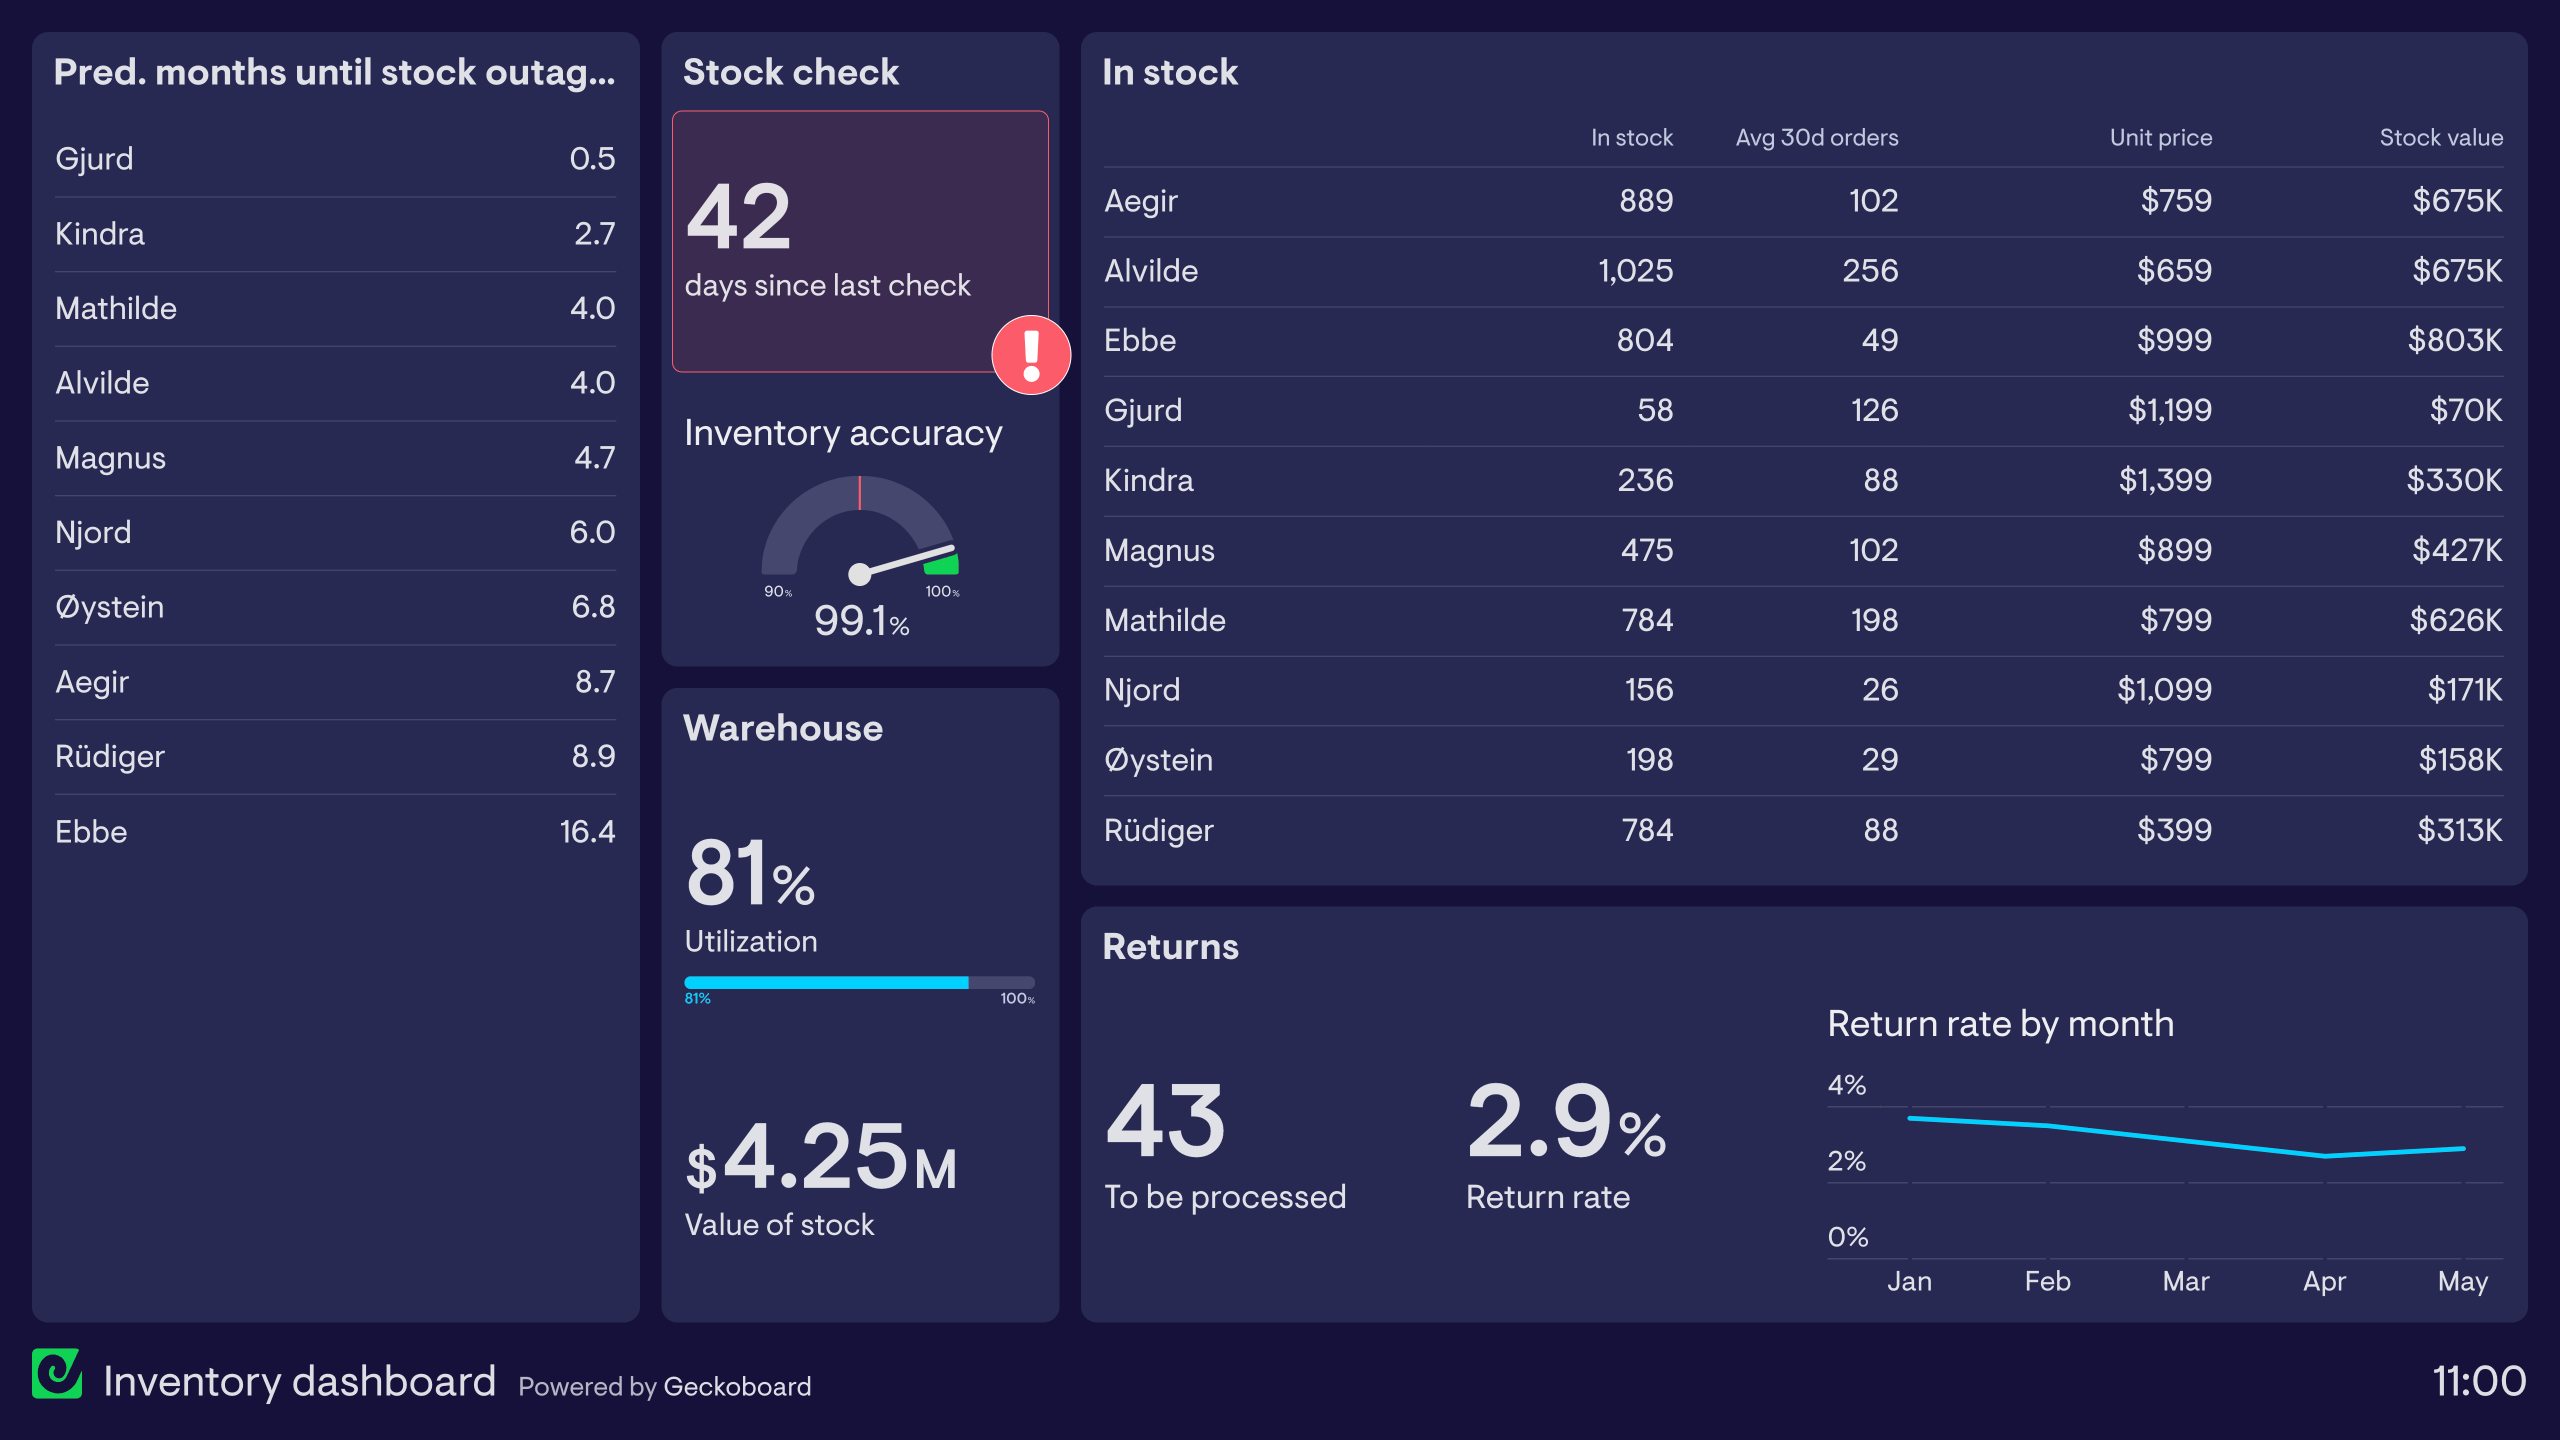
View dashboardsInventory dashboards
Inventory dashboards give a real-time view of how much stock a business currently holds, helping operations teams better manage product availability and new orders.
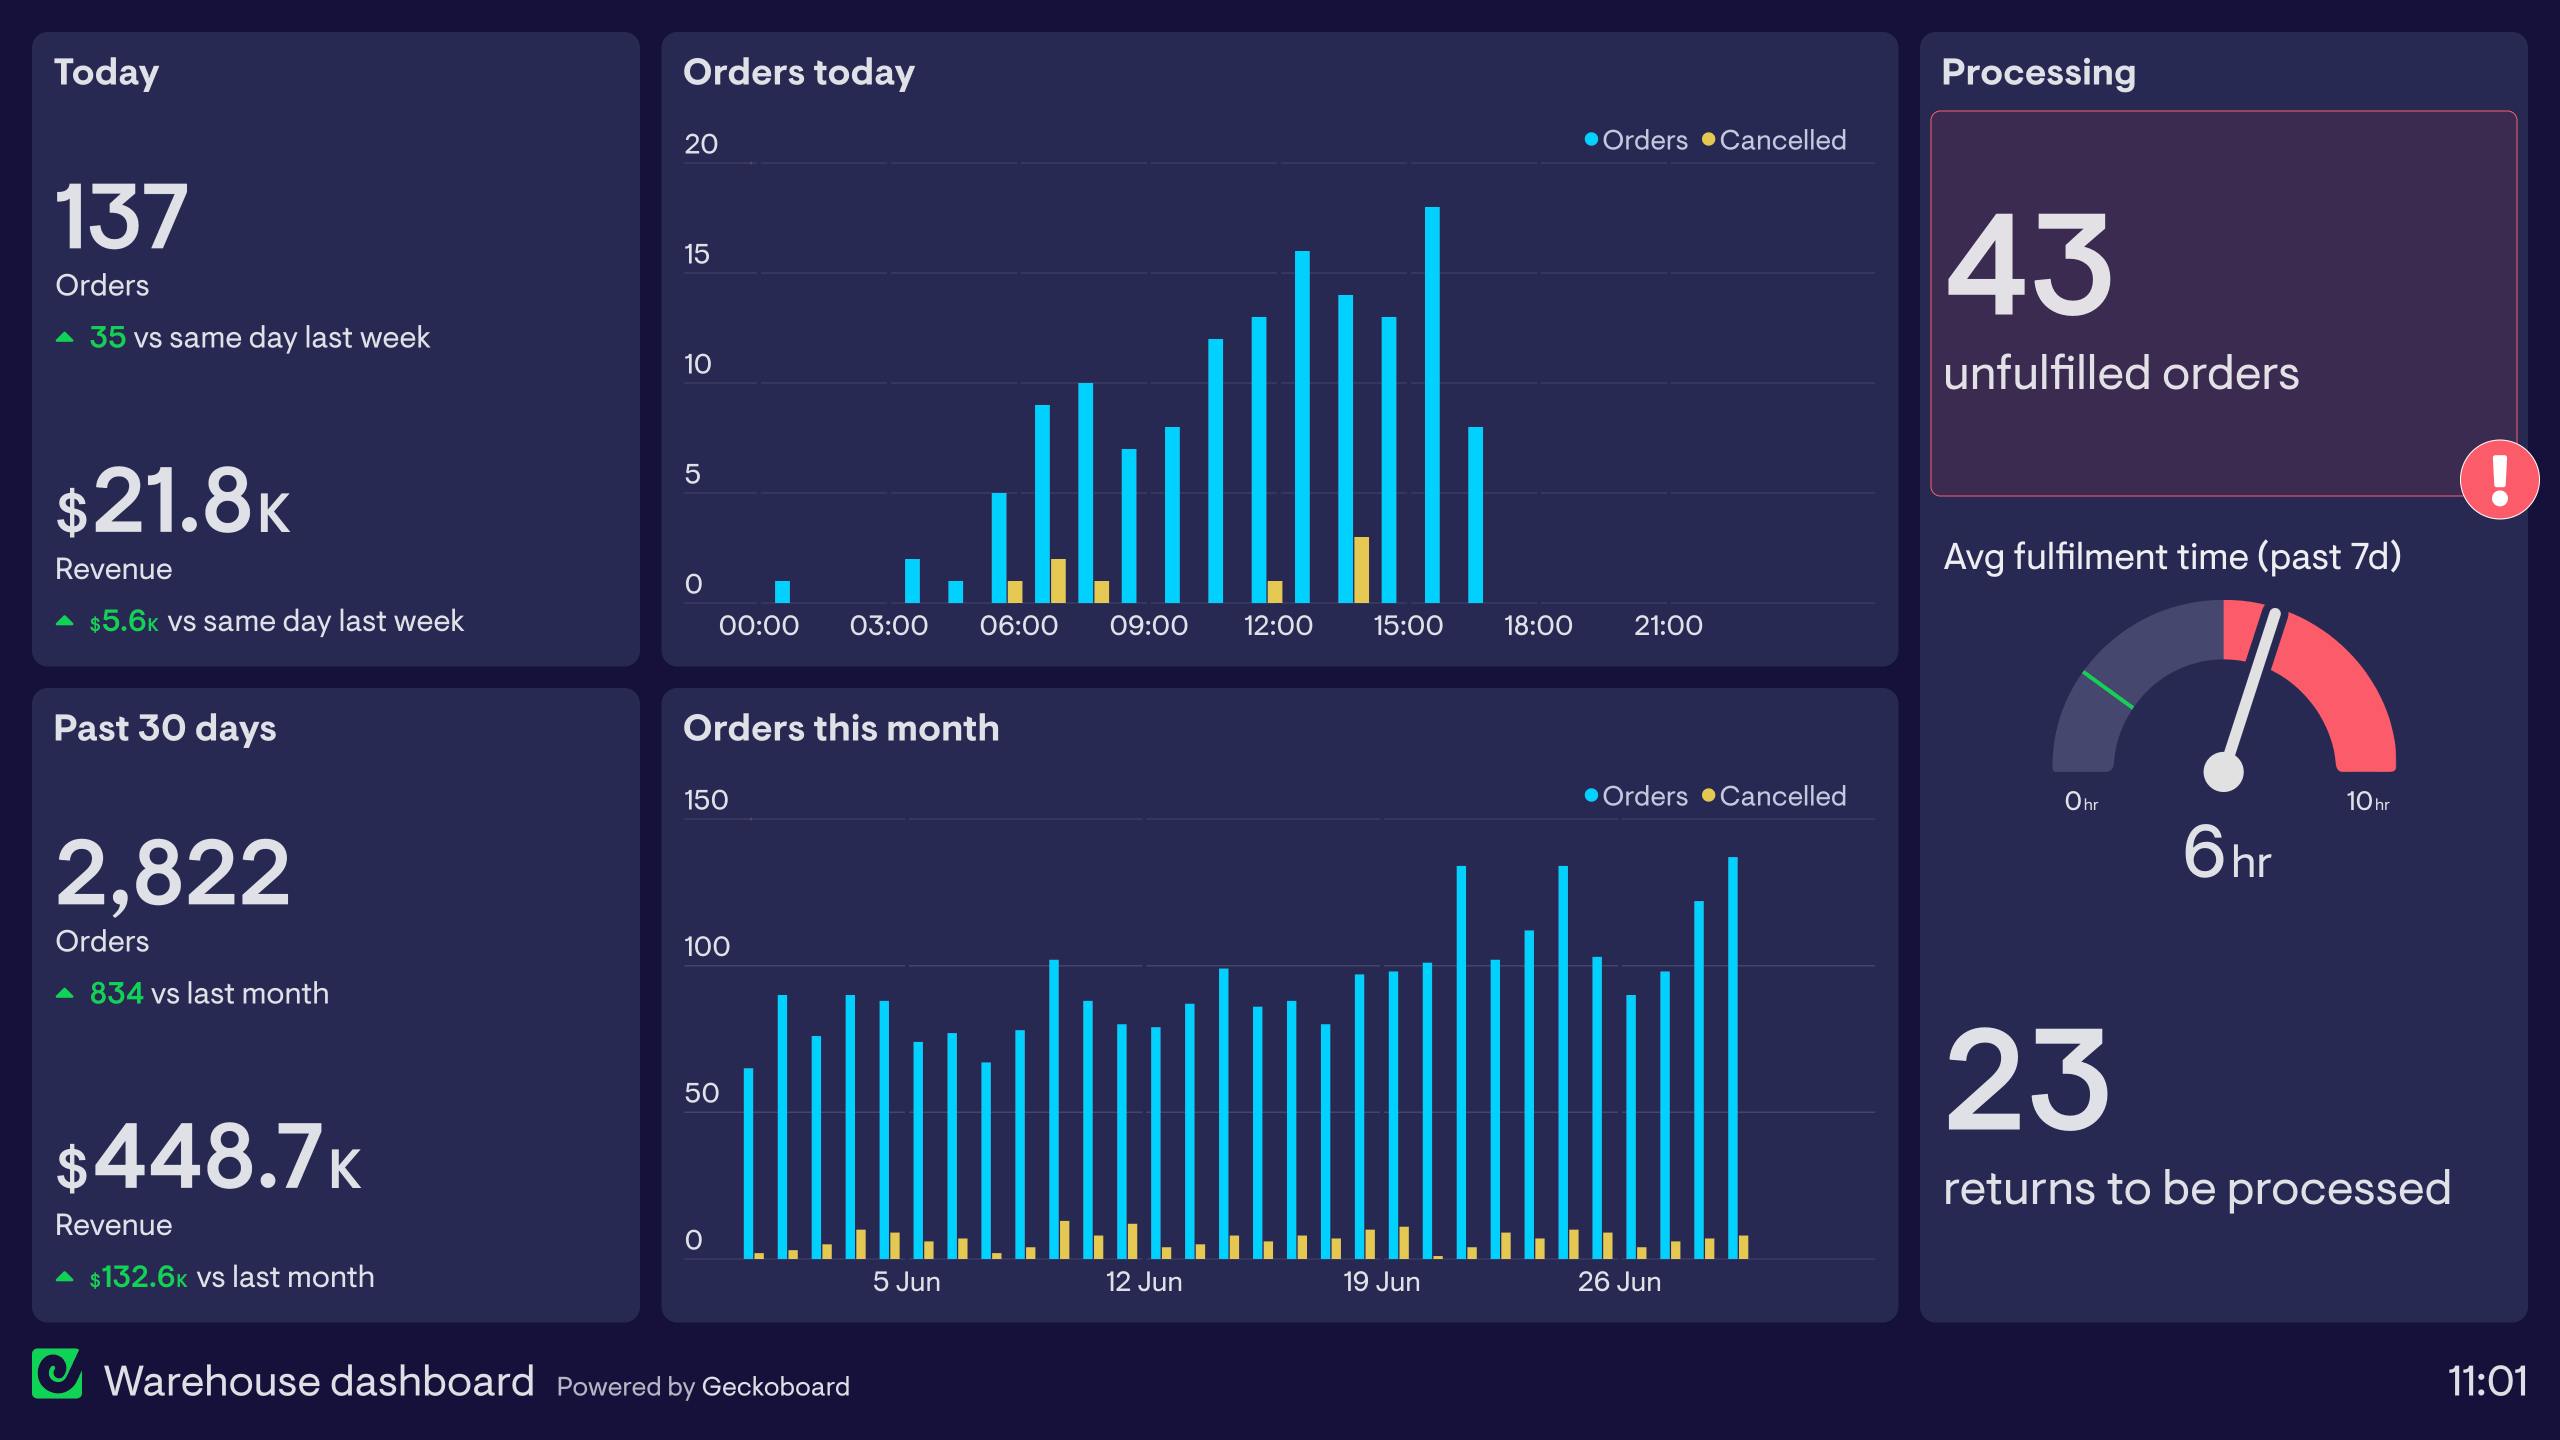
View dashboardsWarehouse dashboards
Warehouse dashboards display live order information, so that team members in the warehouse can anticipate busy periods, respond to demand, and meet their fulfillment goals.
View dashboards