Dashboard examples
Real dashboards used by sales, marketing, support, and ops teams to track performance and stay aligned. Browse our library of 100+ dashboard examples, covering the tools you already use including Salesforce, HubSpot, Shopify, Zendesk, Aircall and Google Analytics.

Browse by dashboard category

Jump to specific dashboard examples
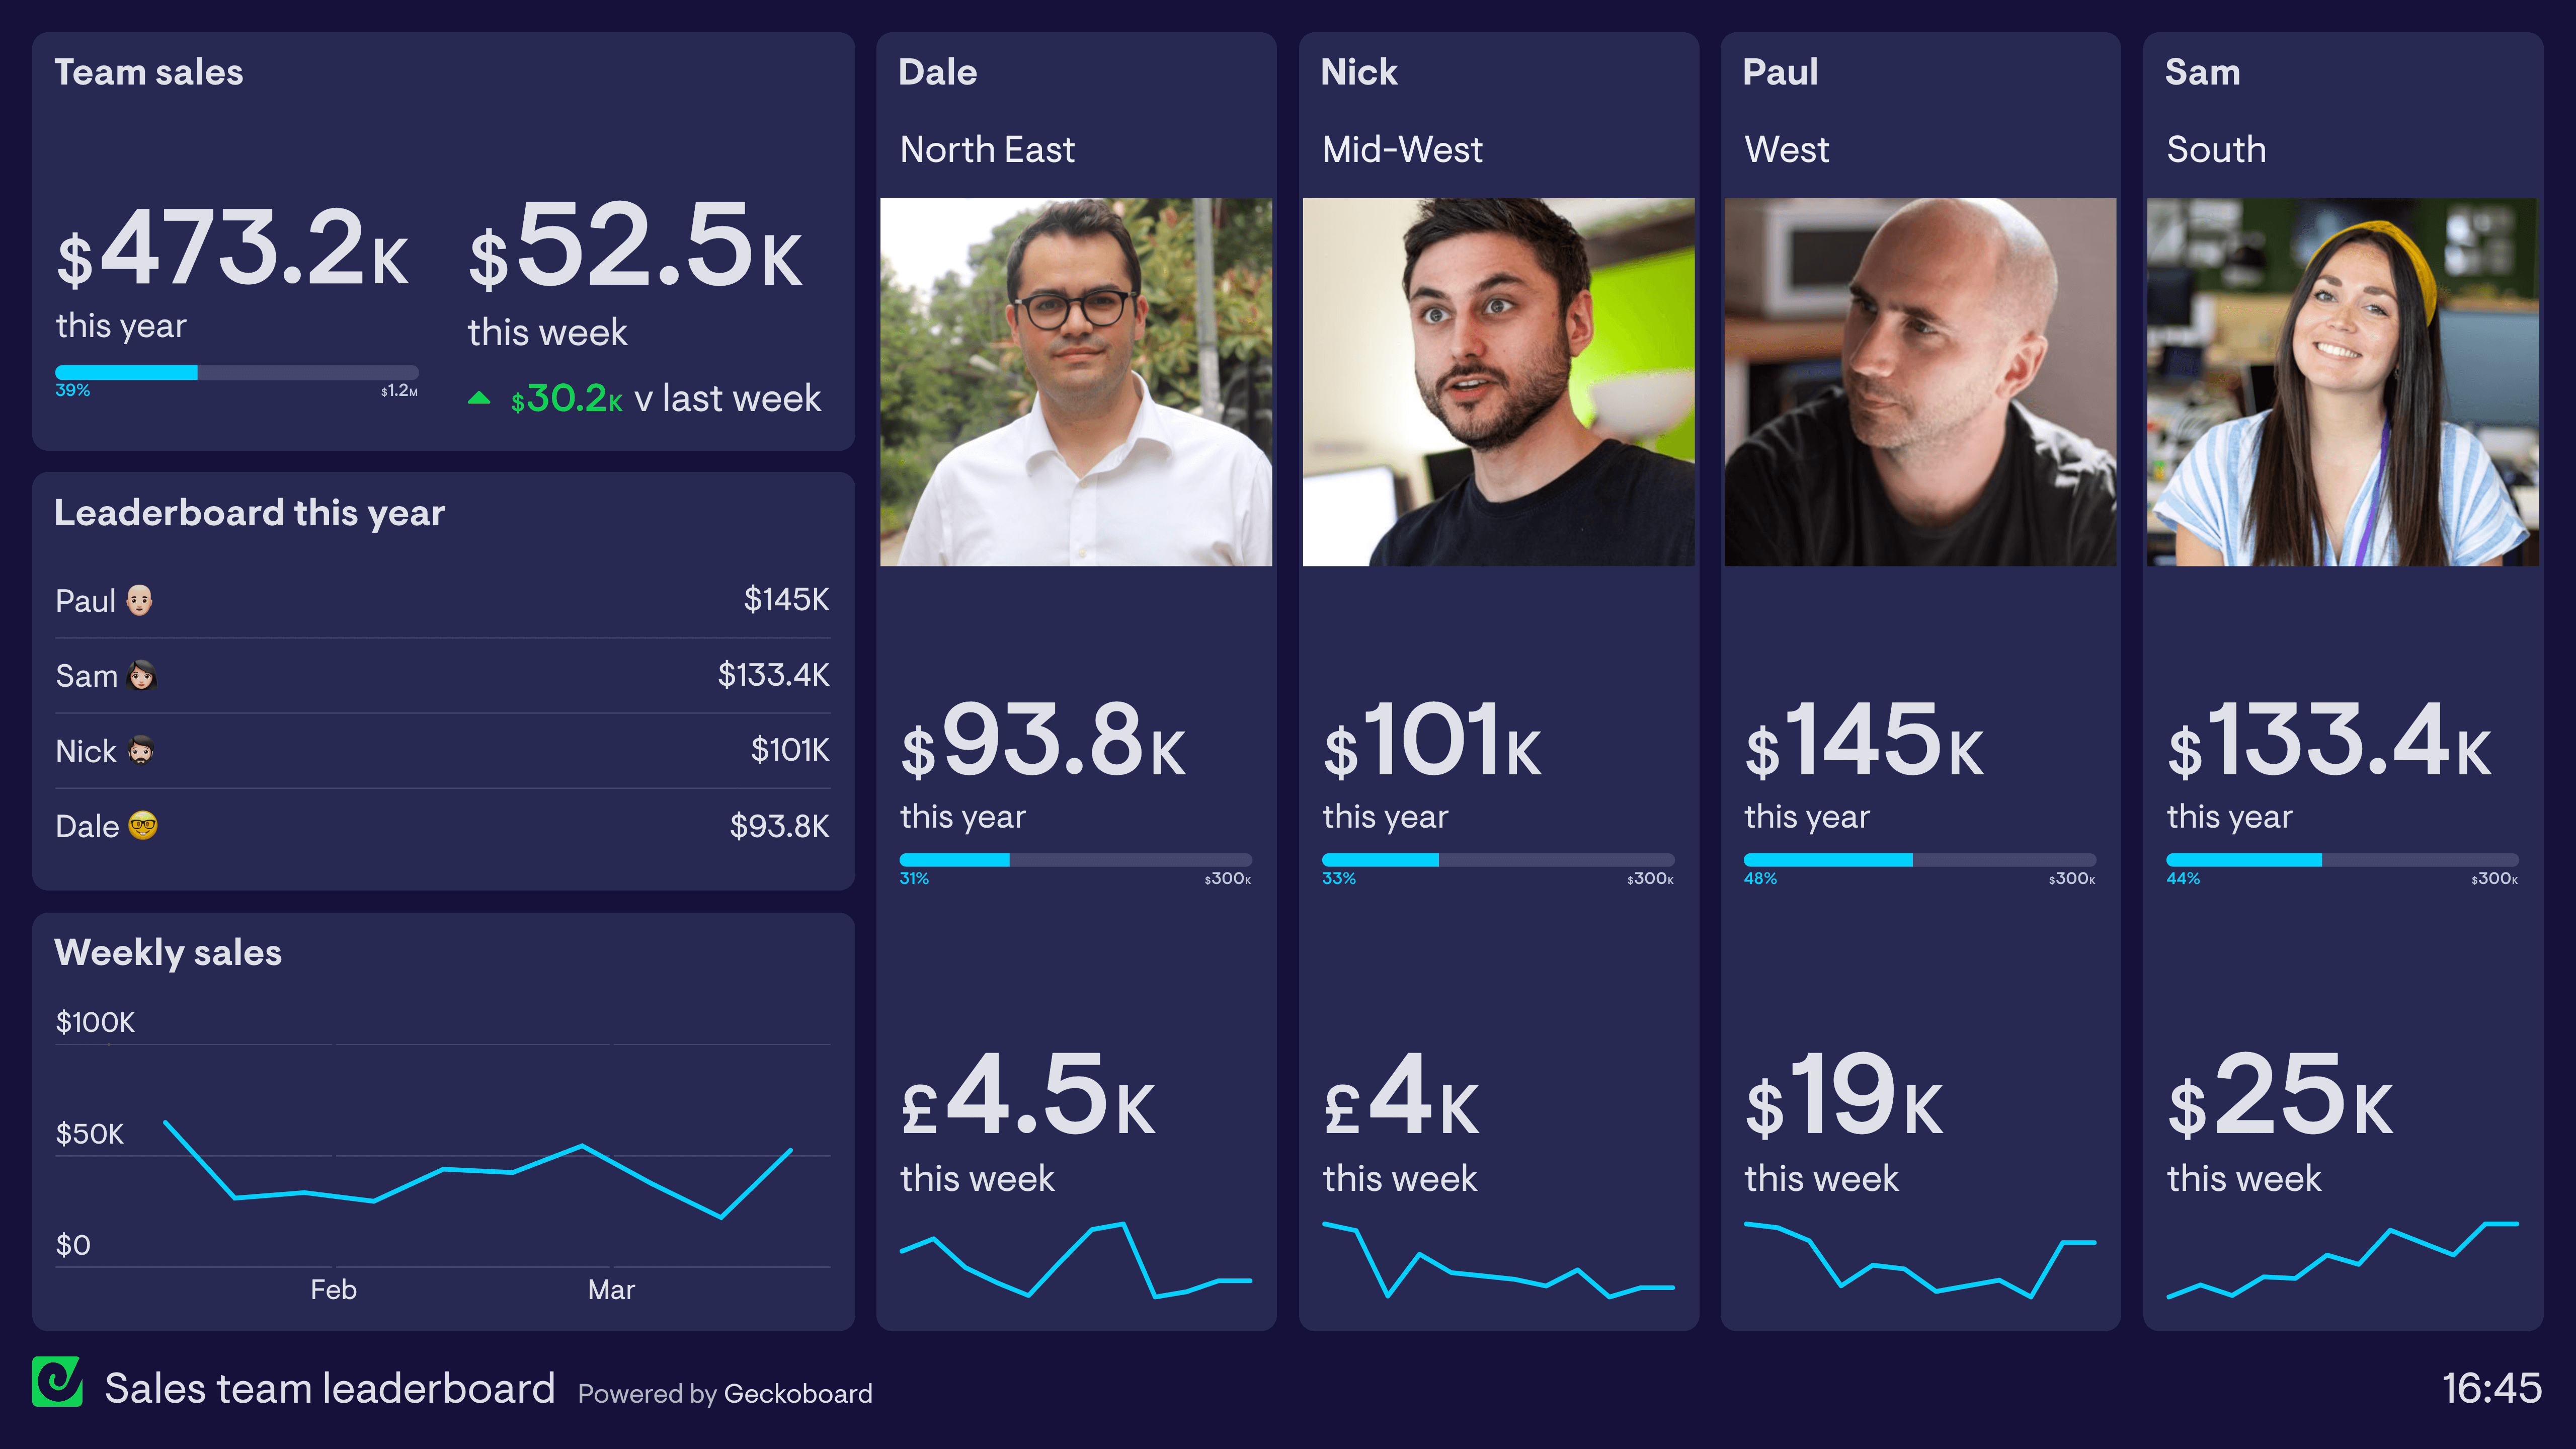
Sales
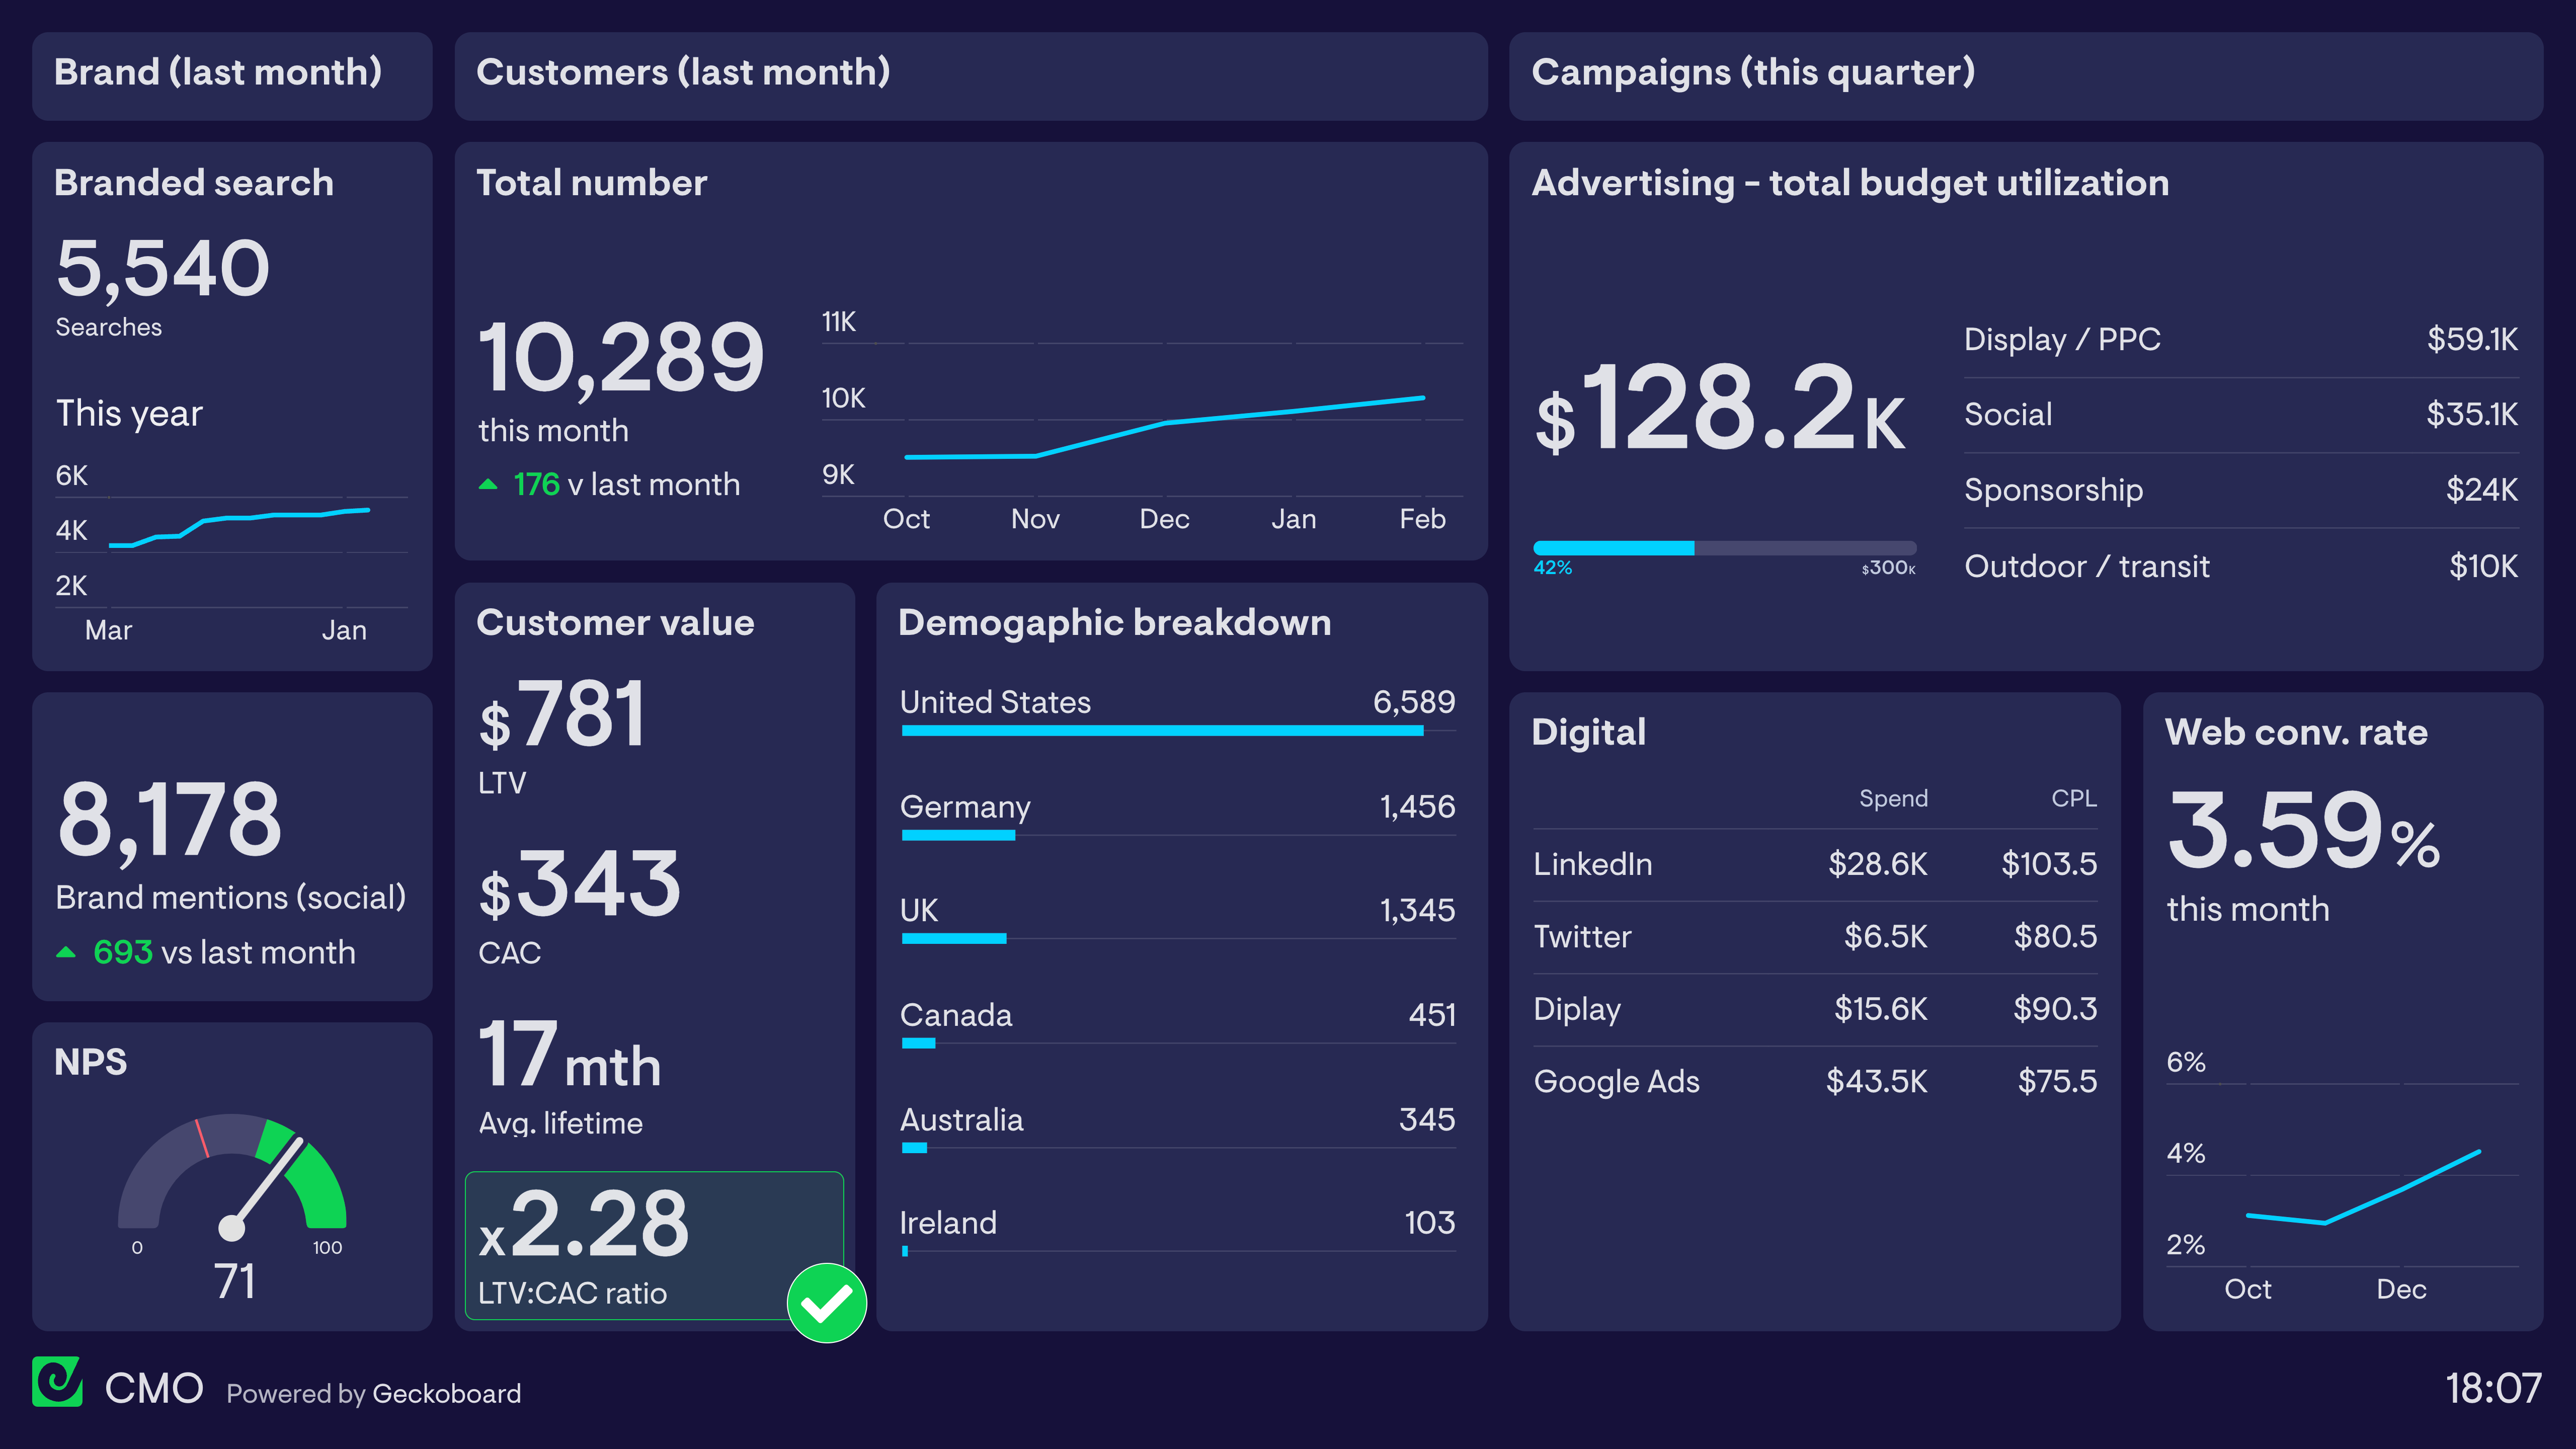
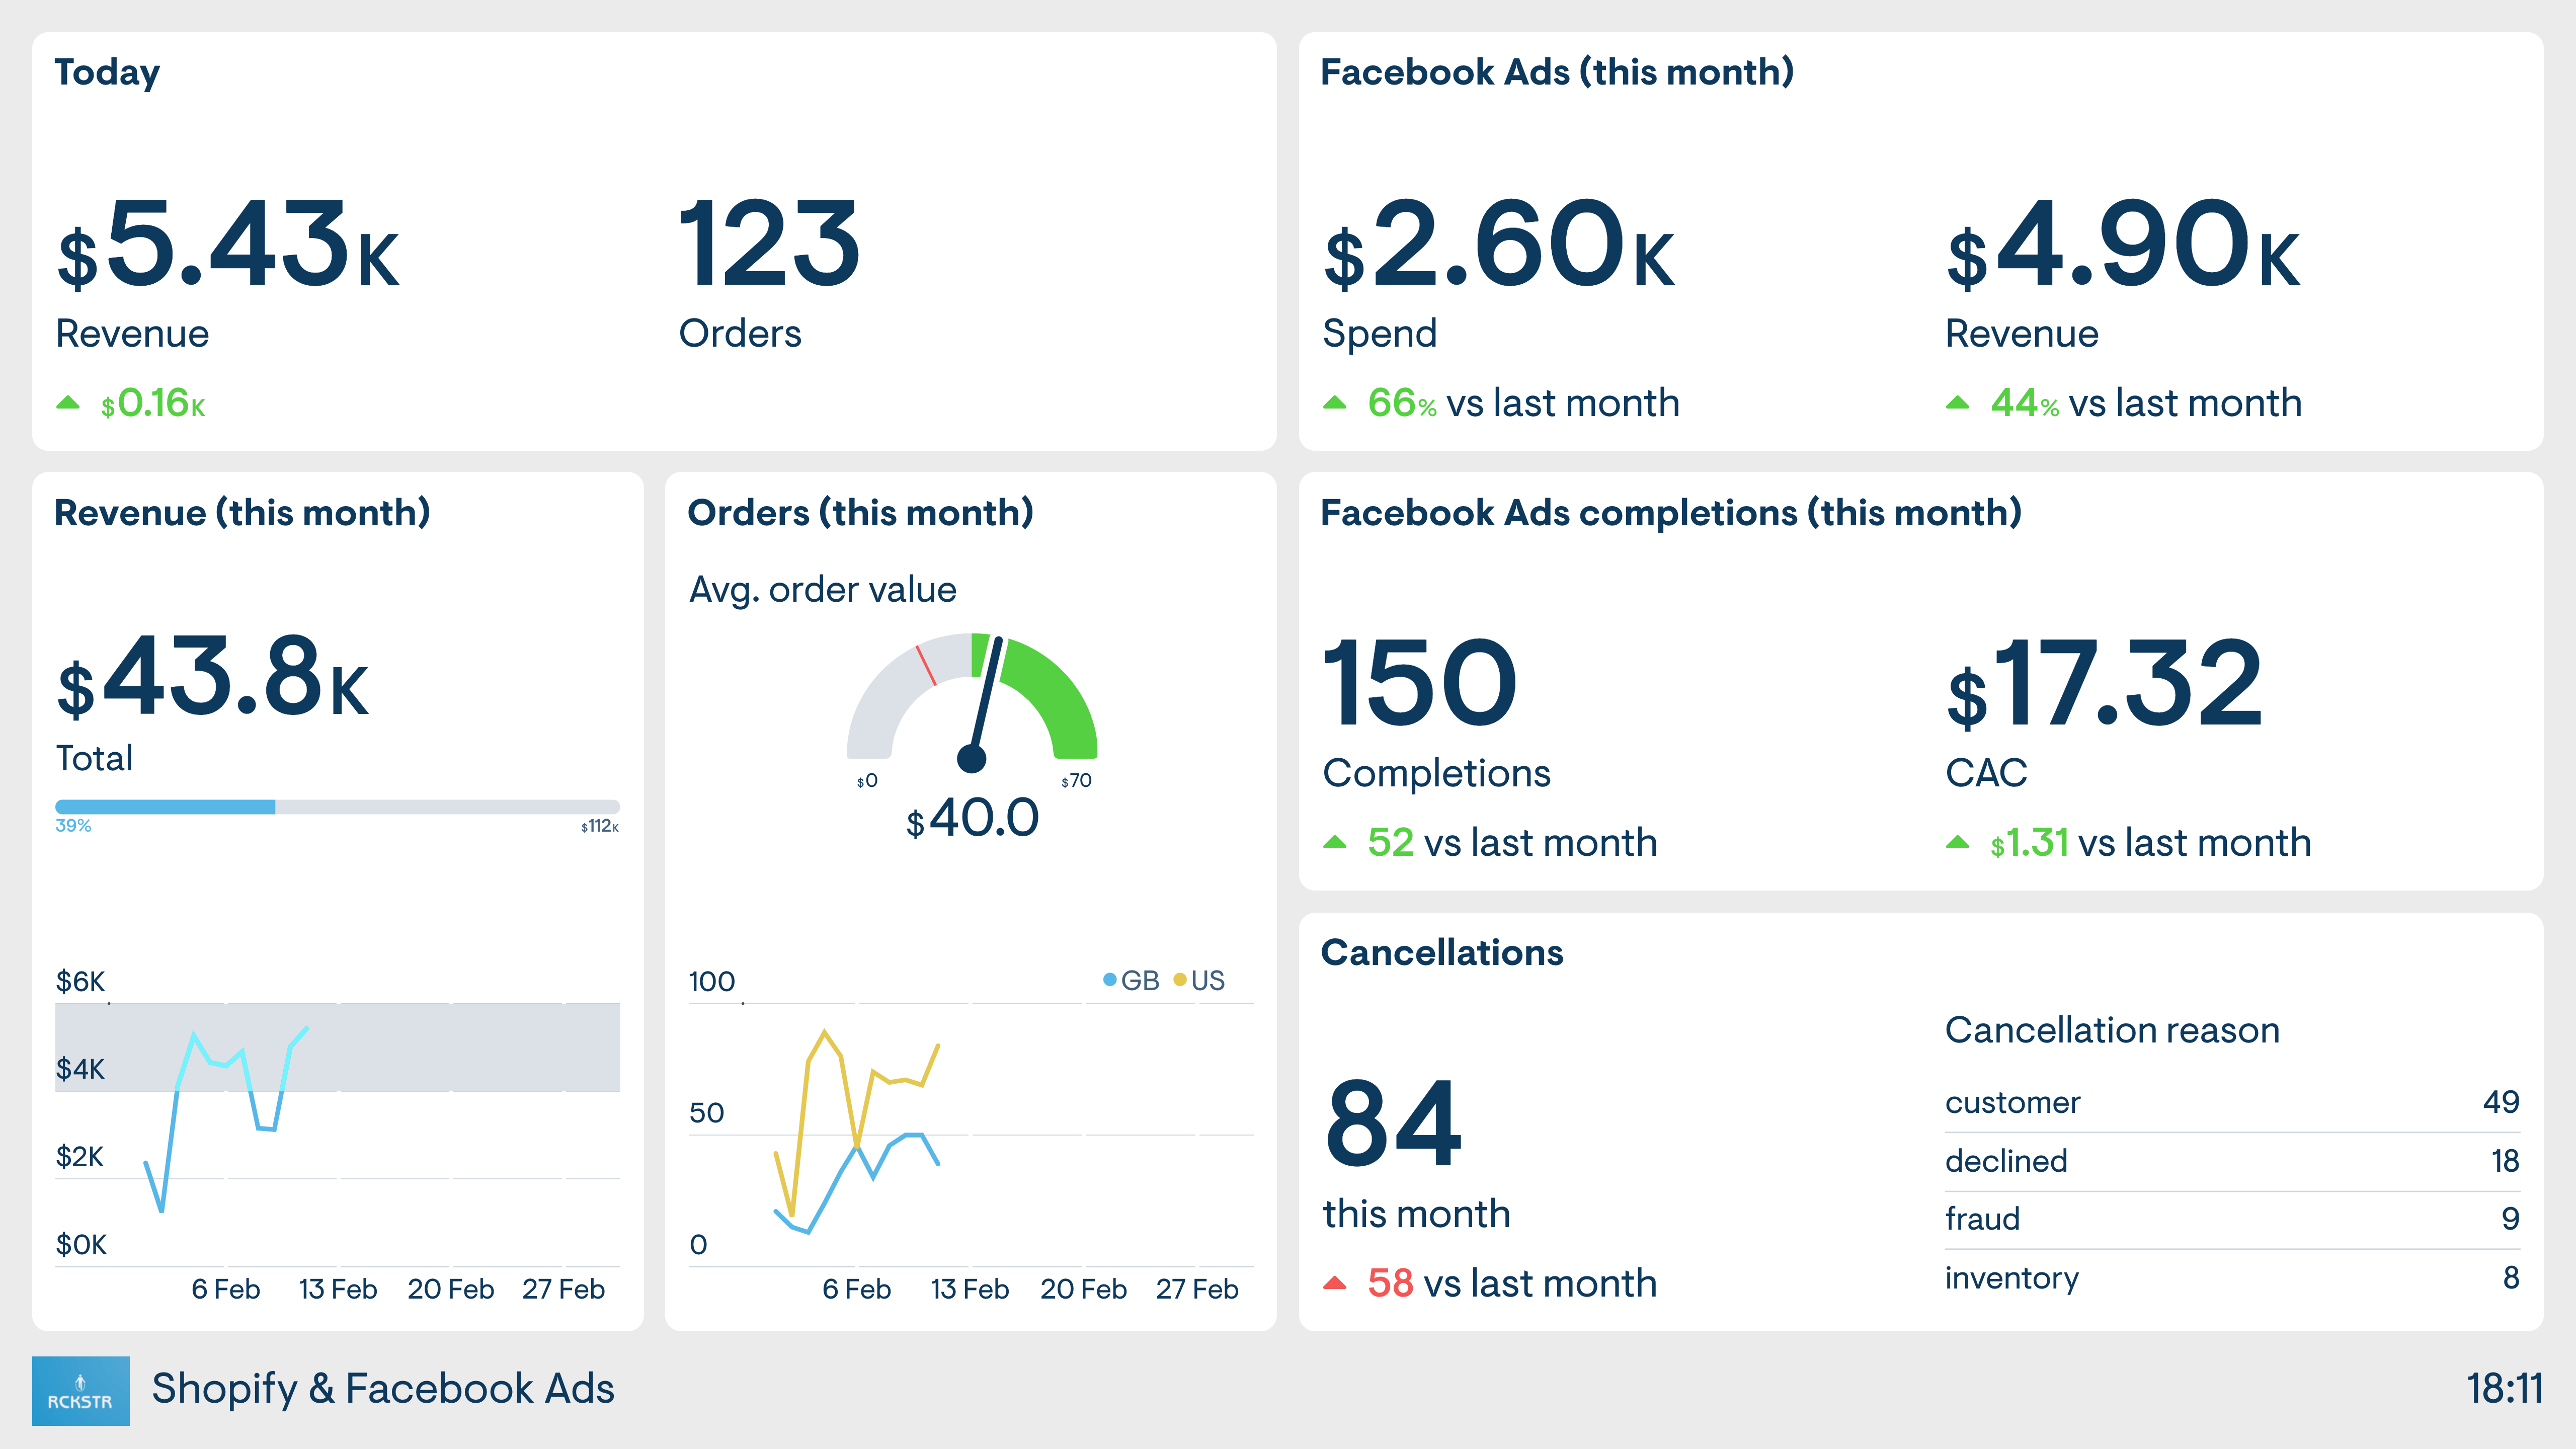
Marketing
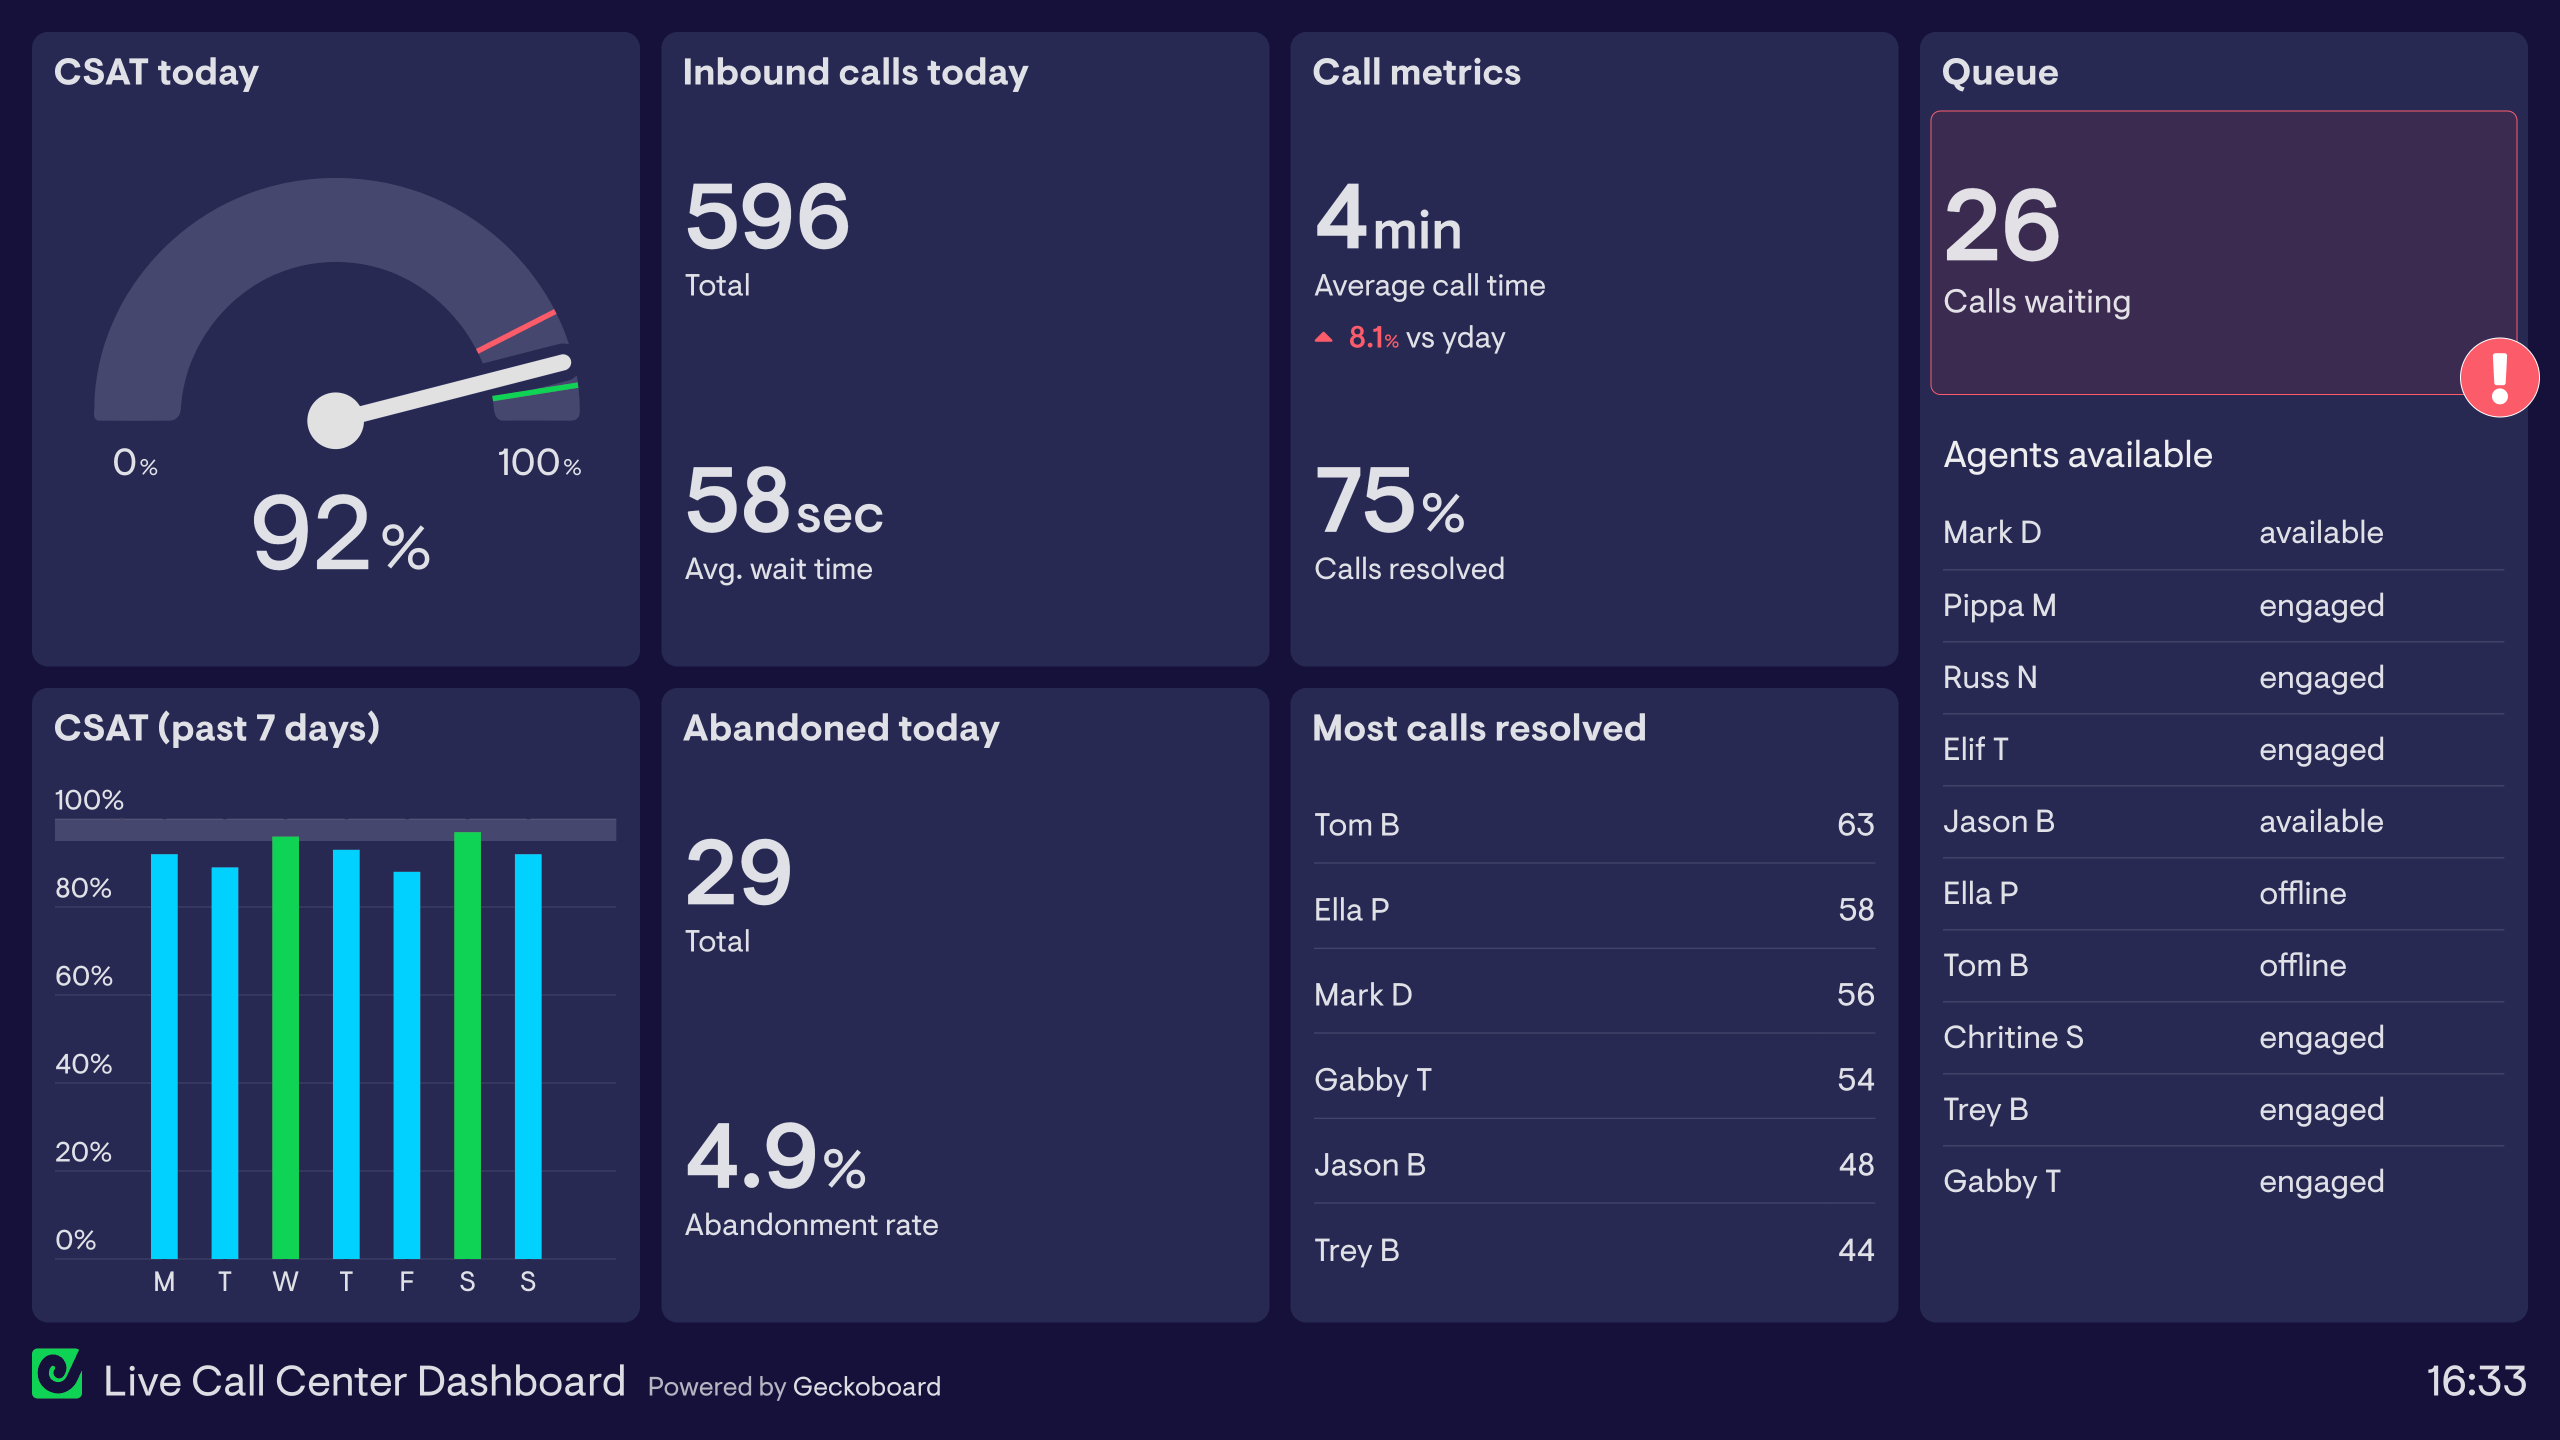
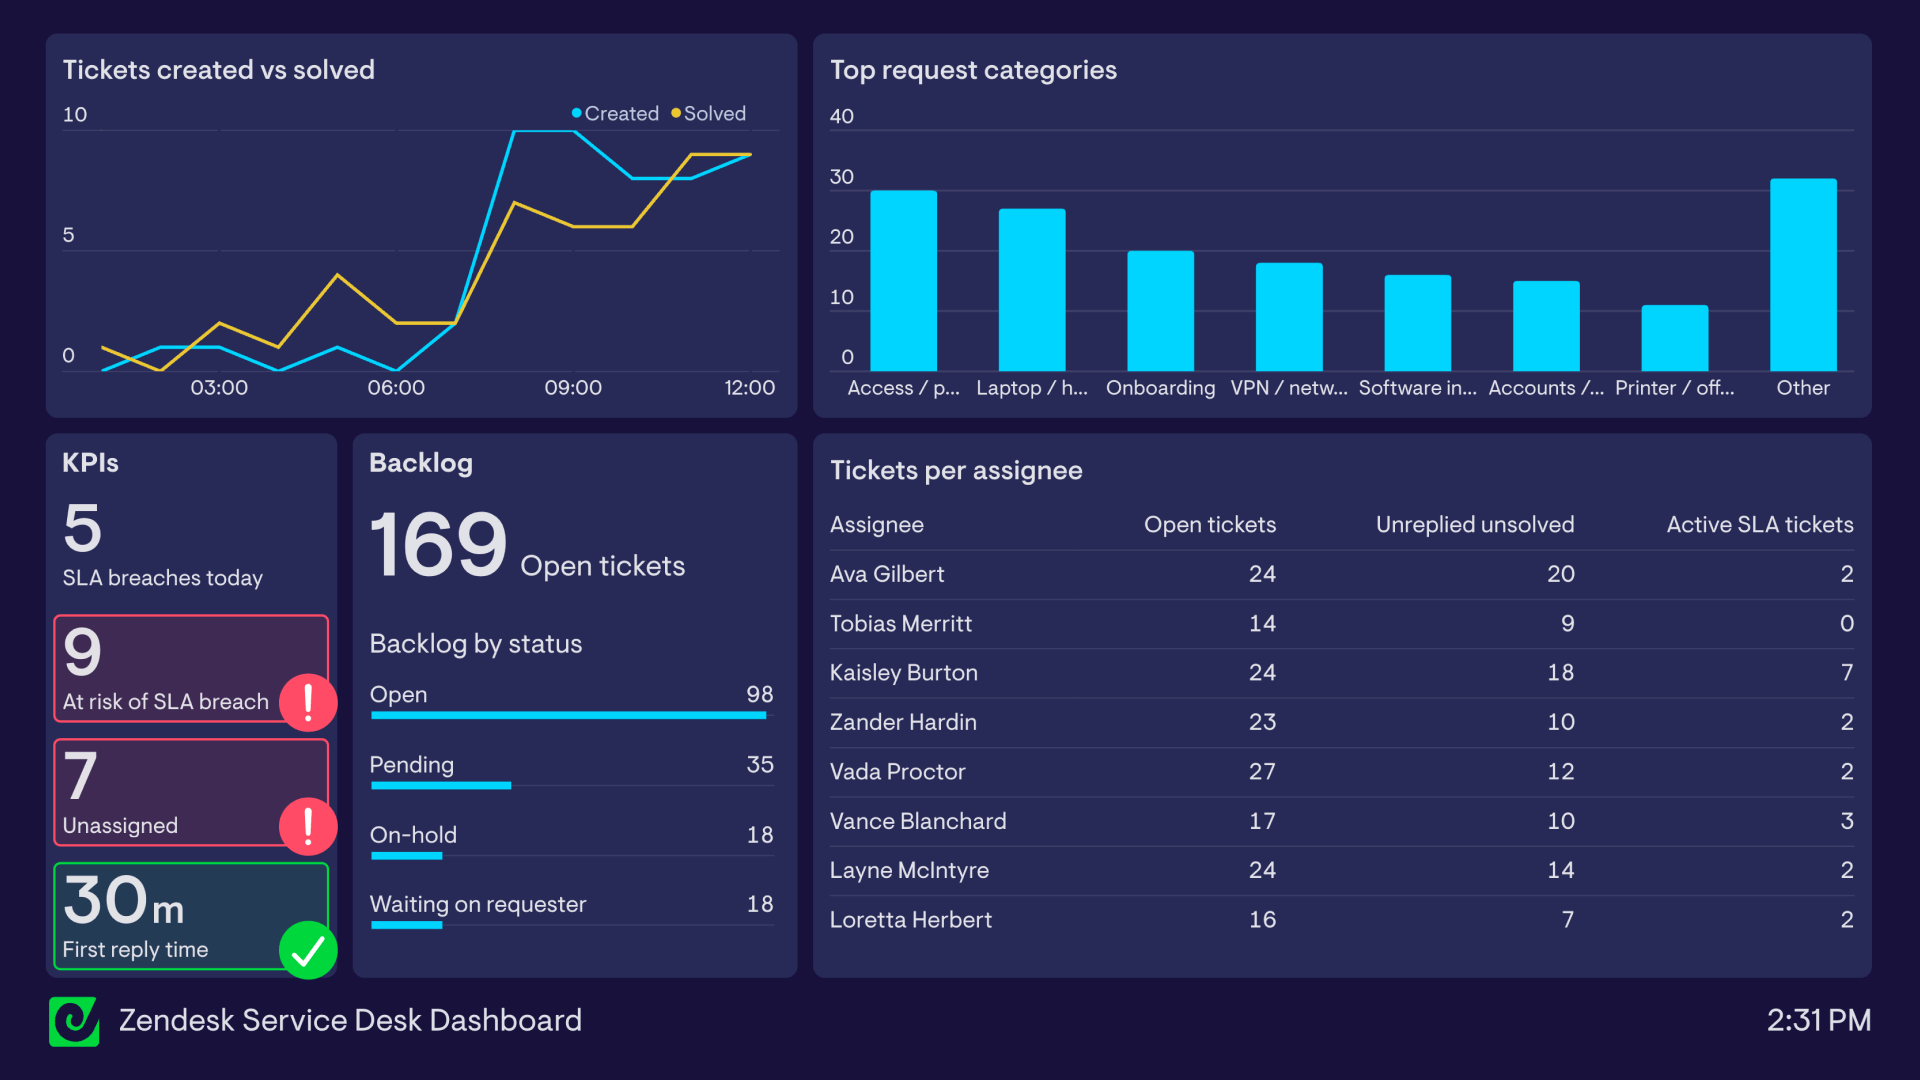
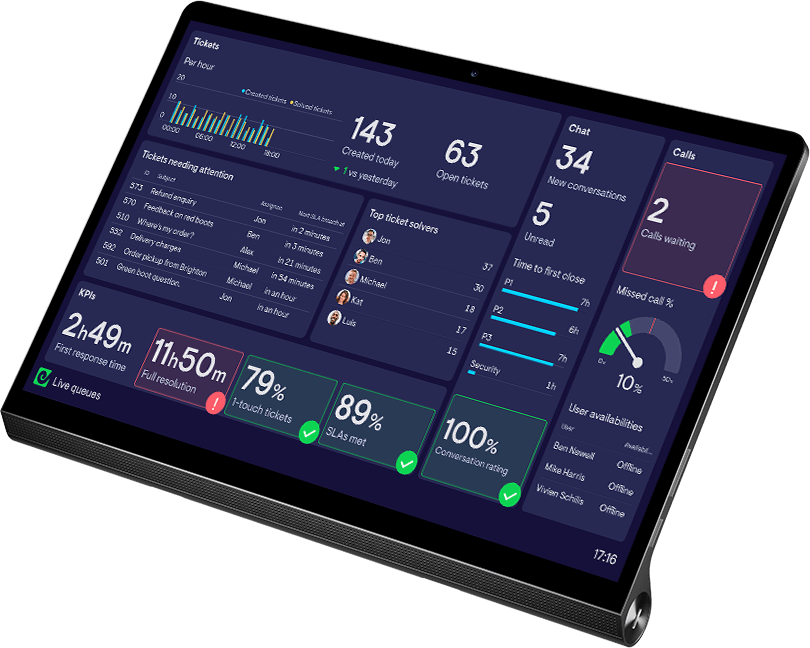
Customer support
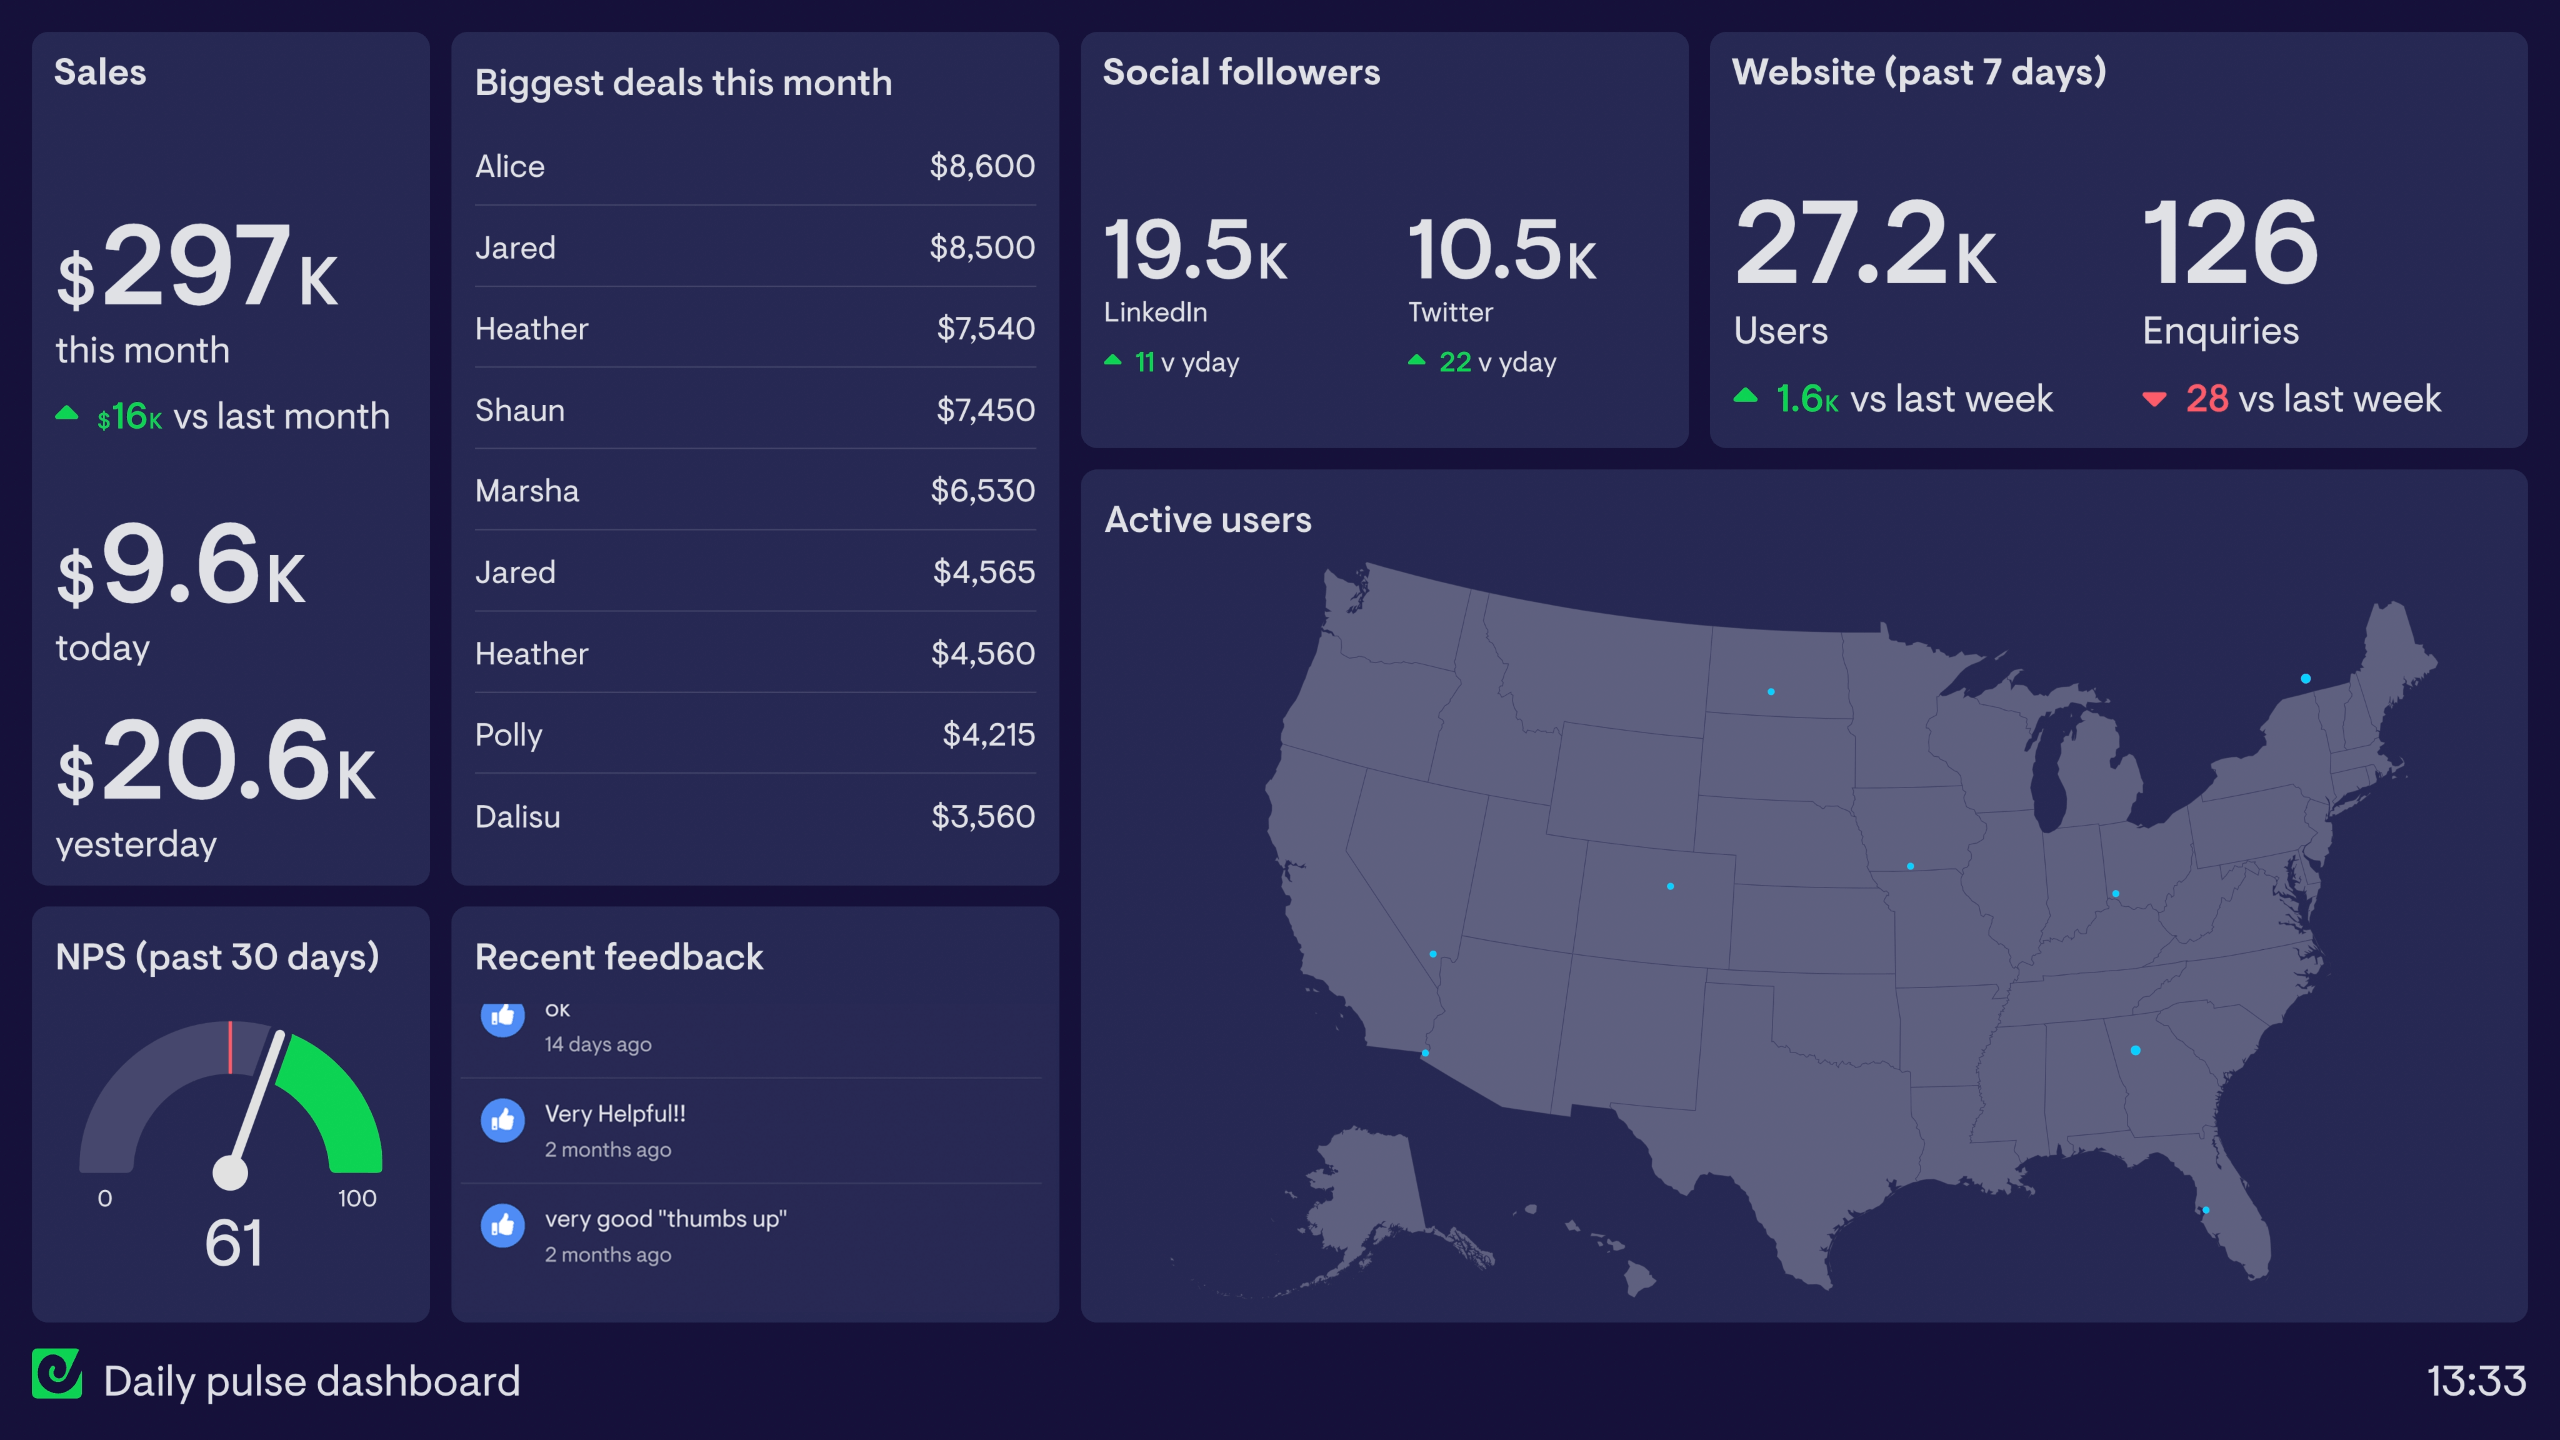
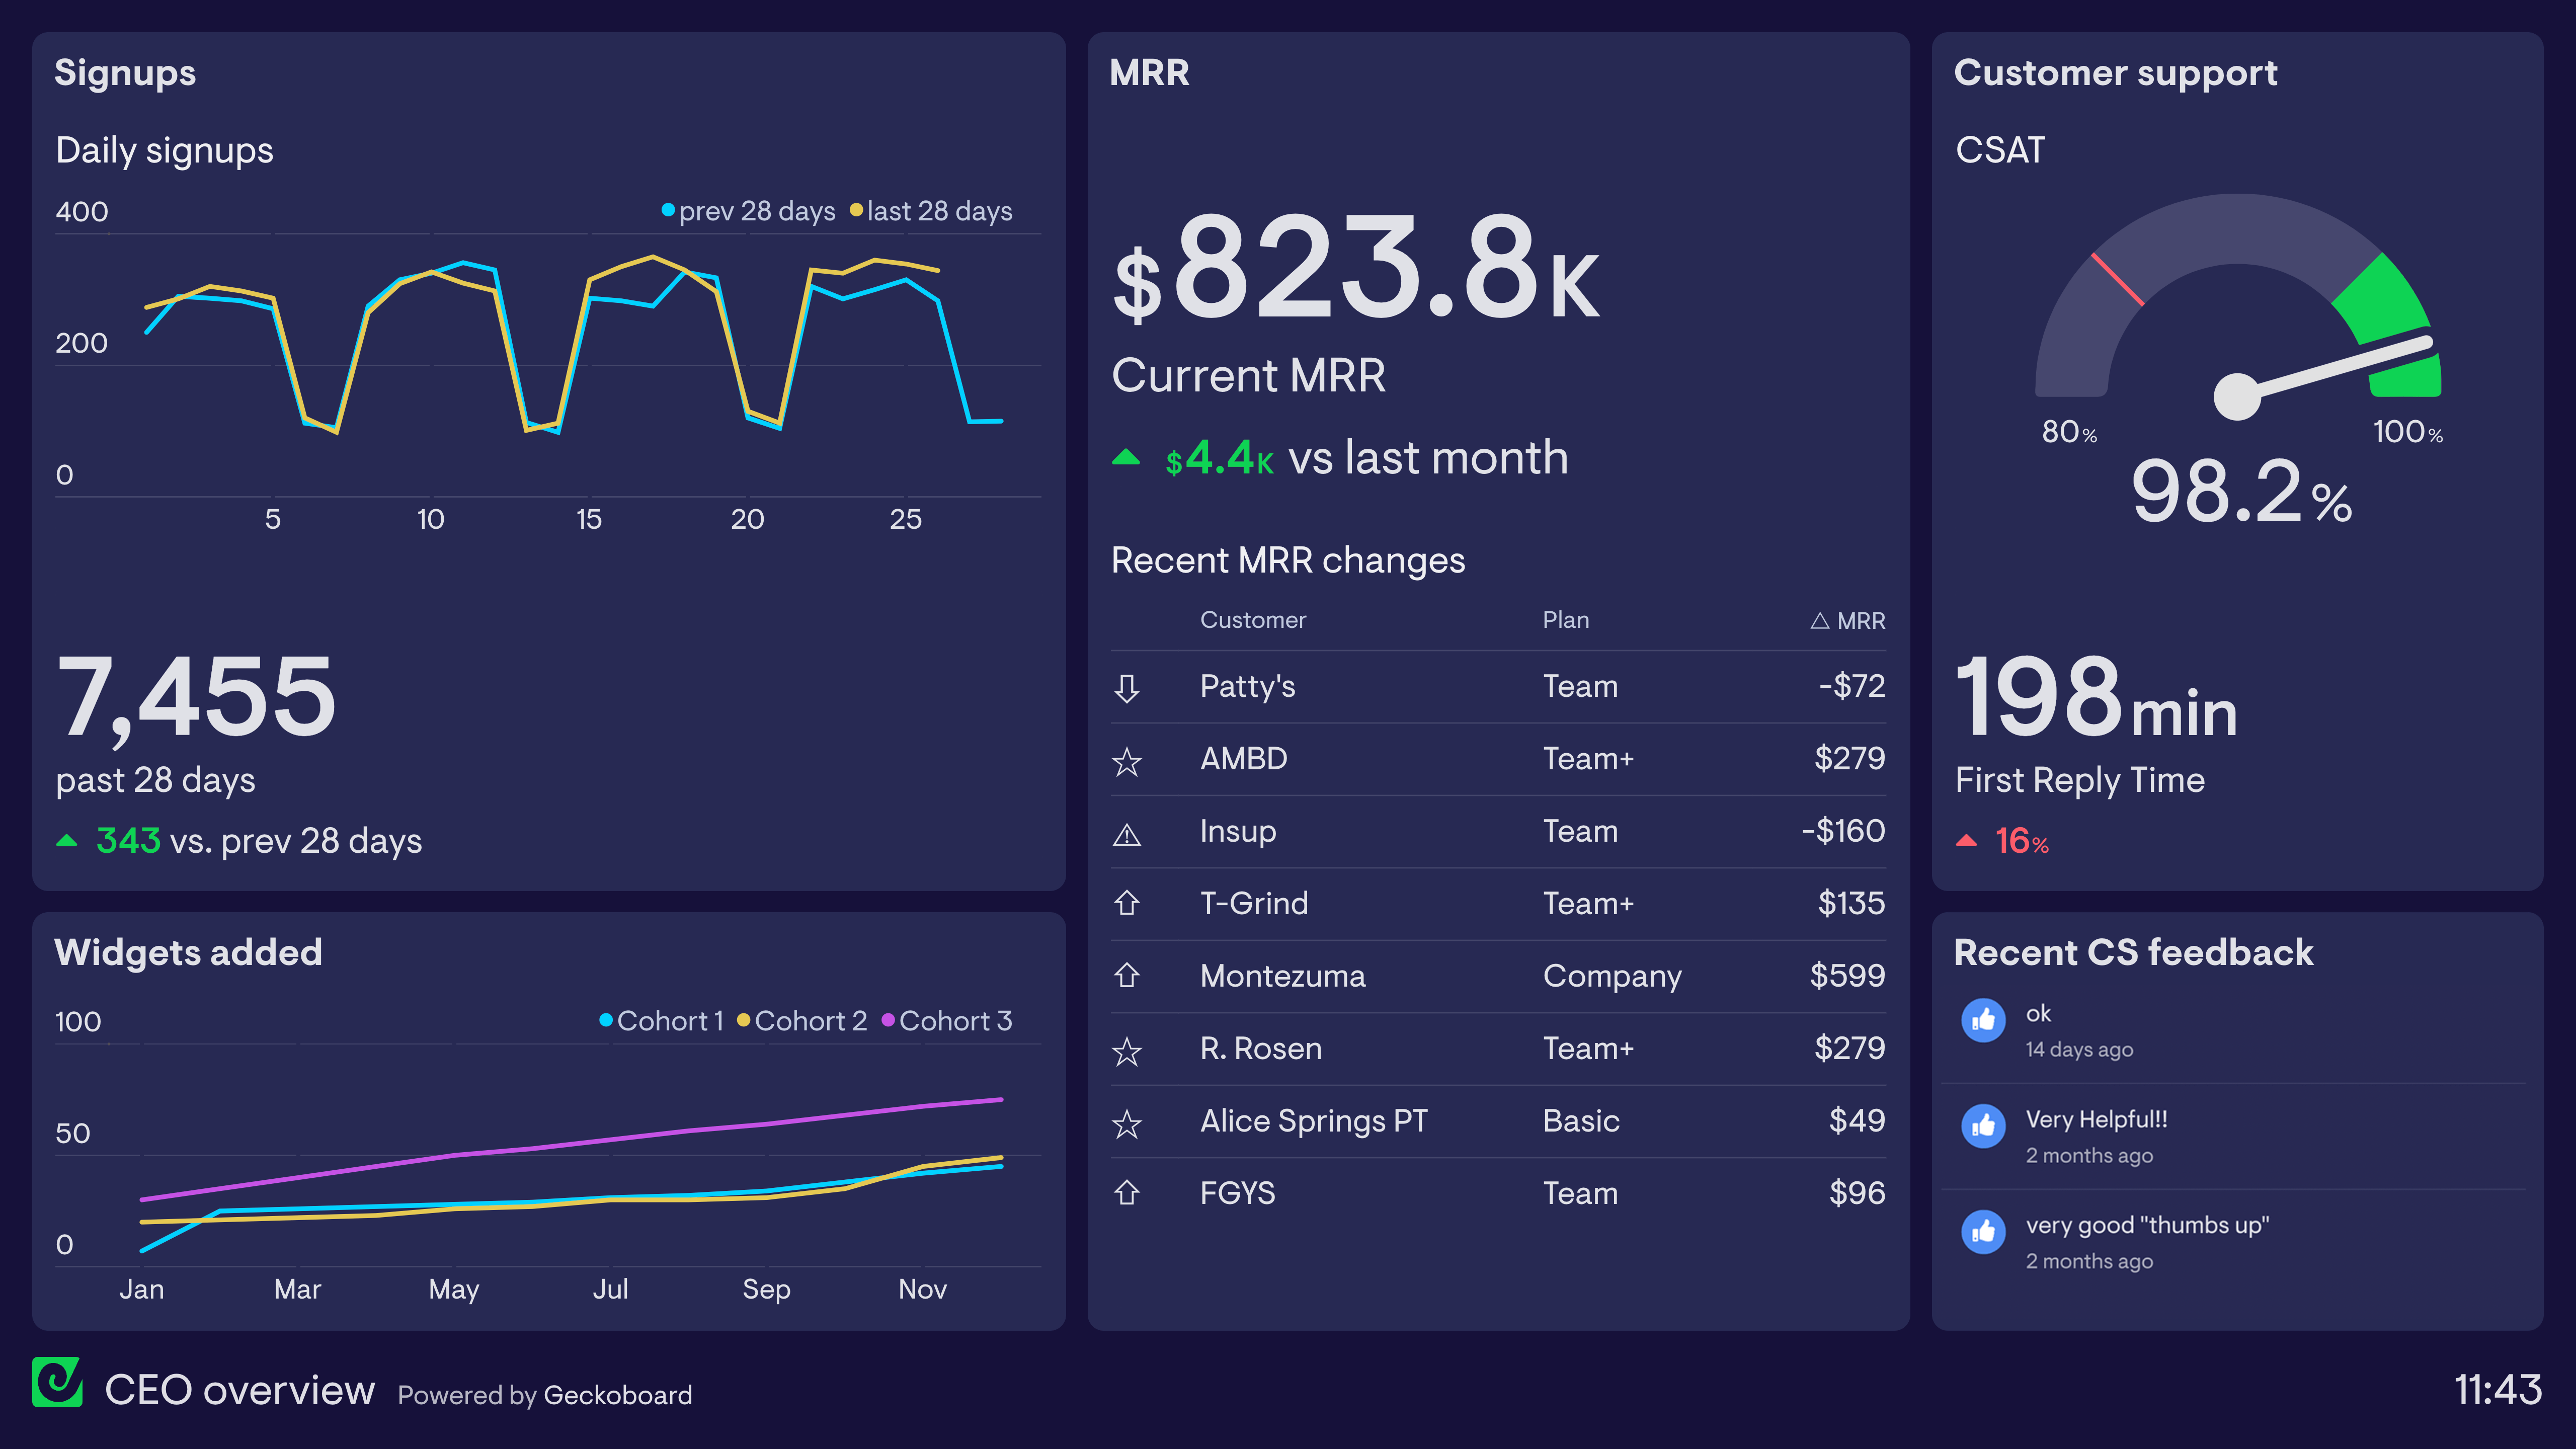
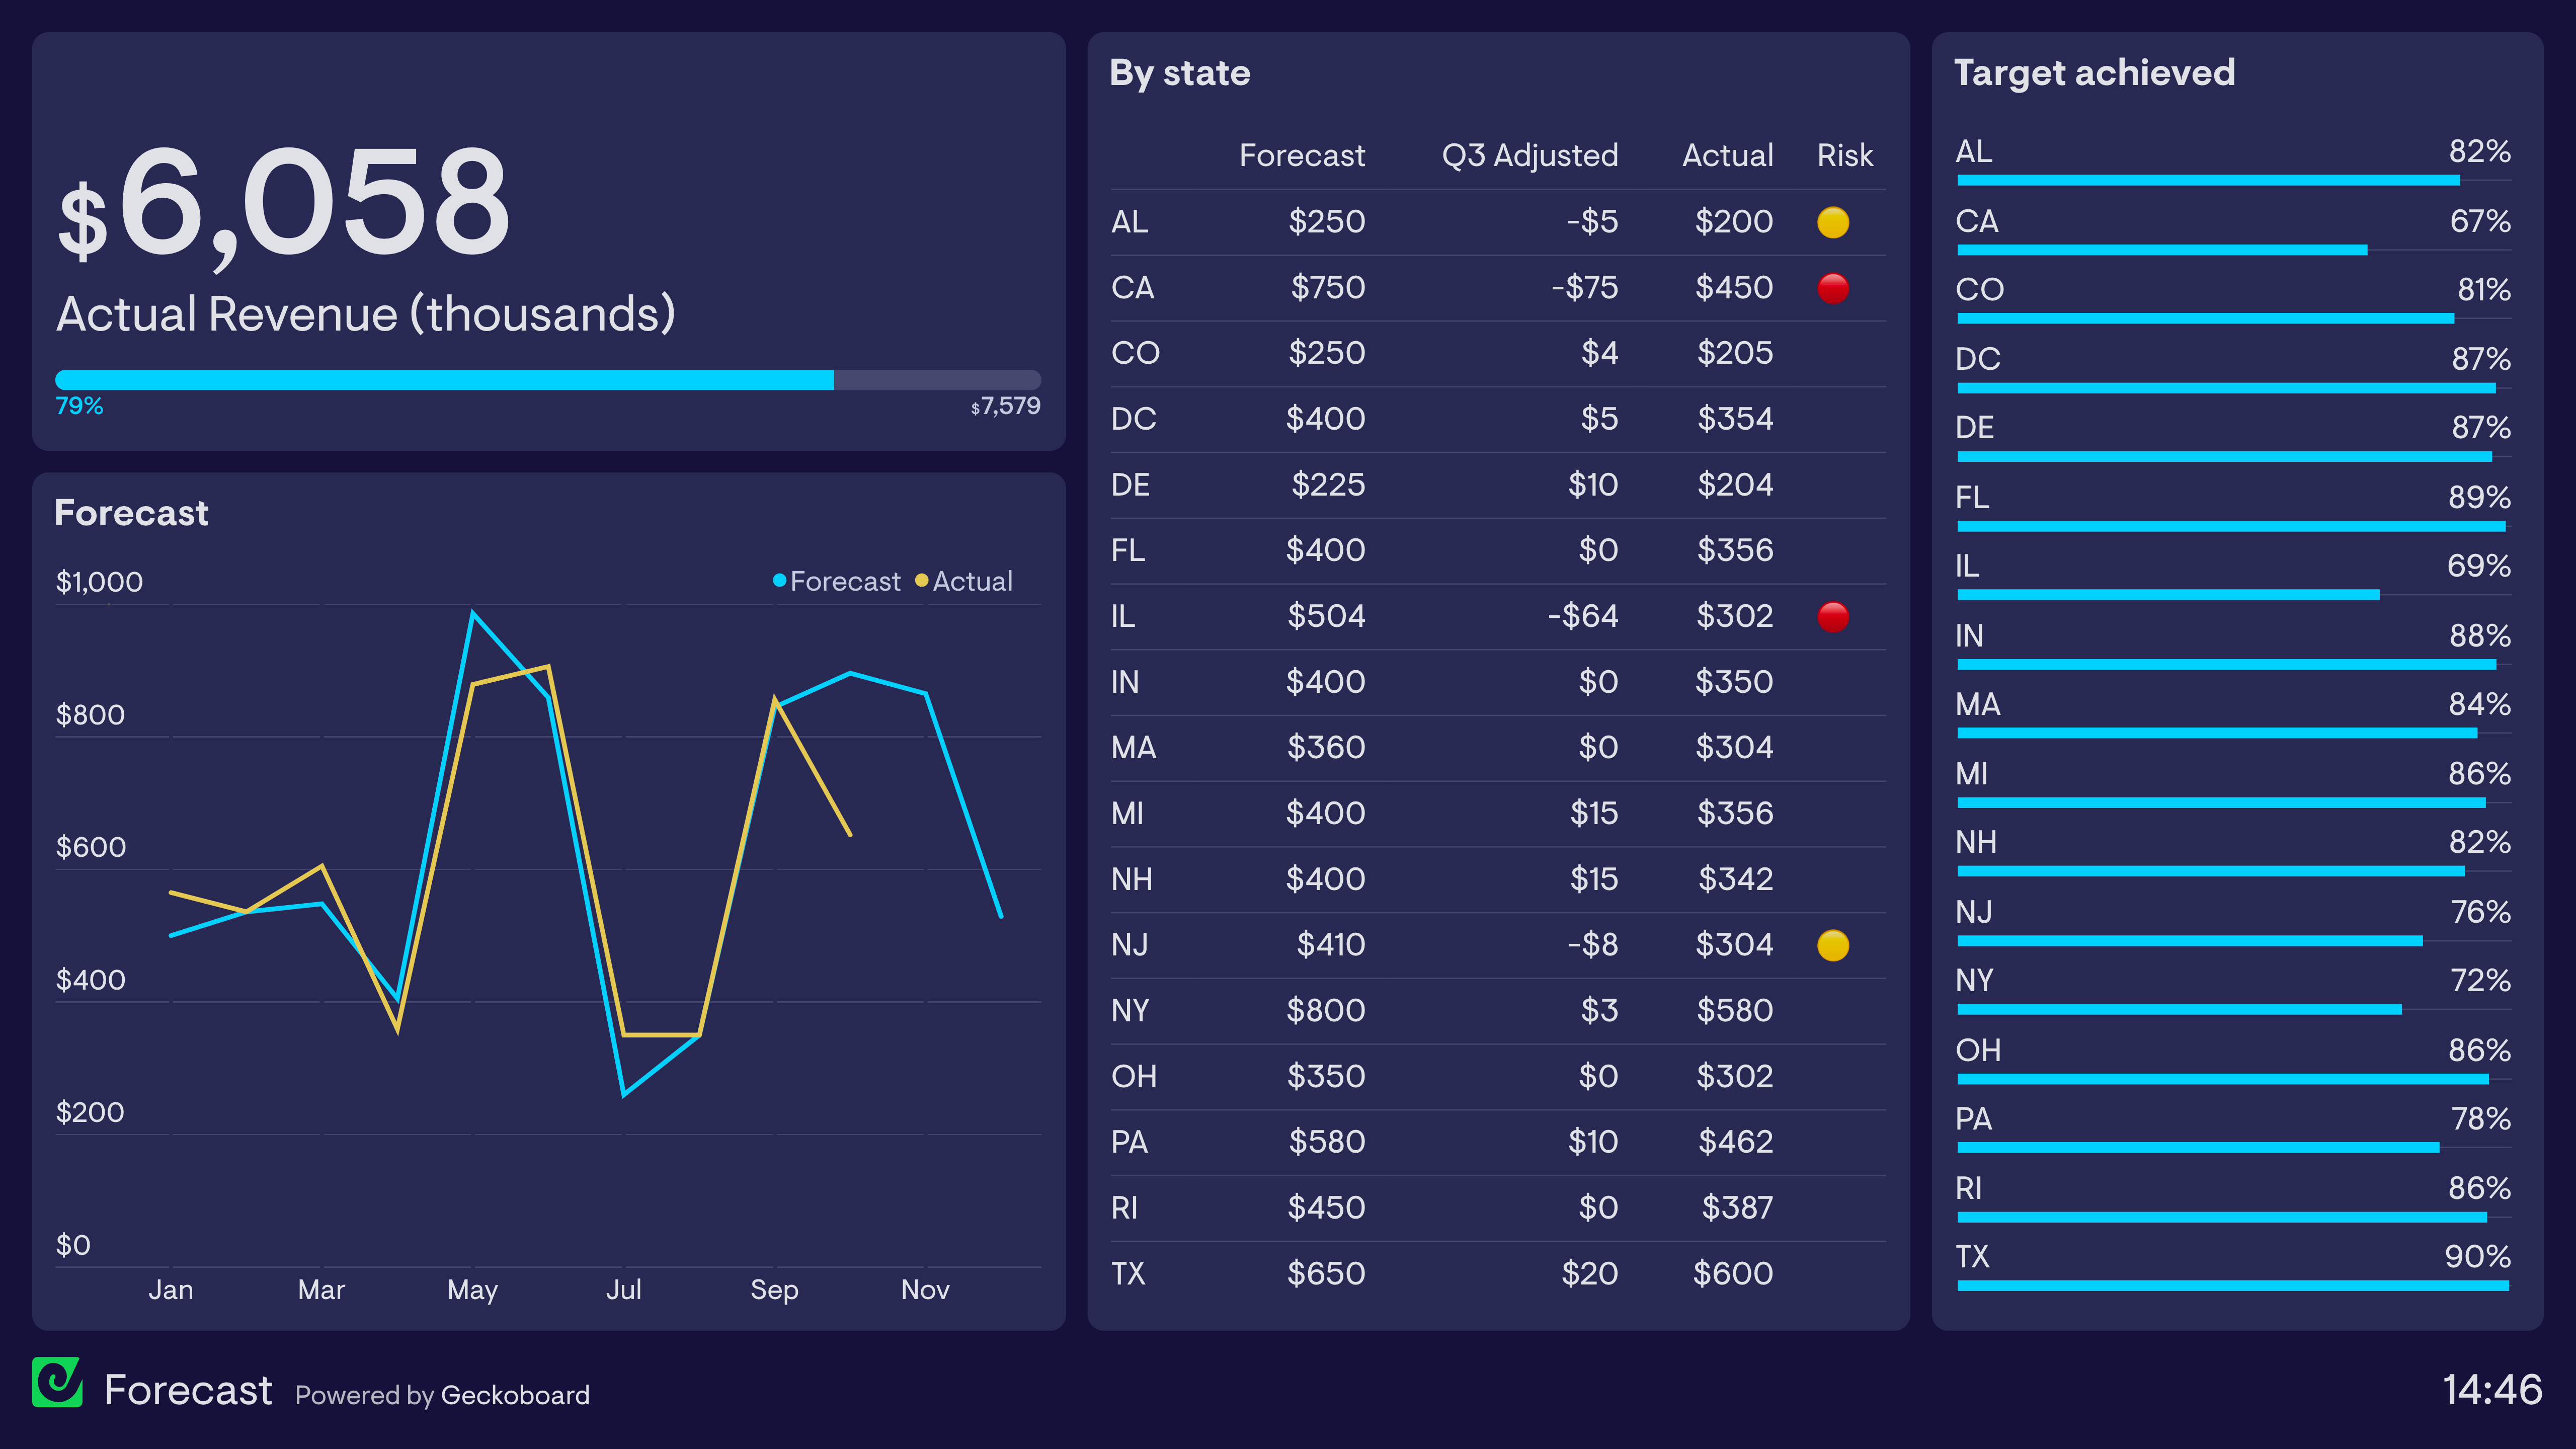
Executive
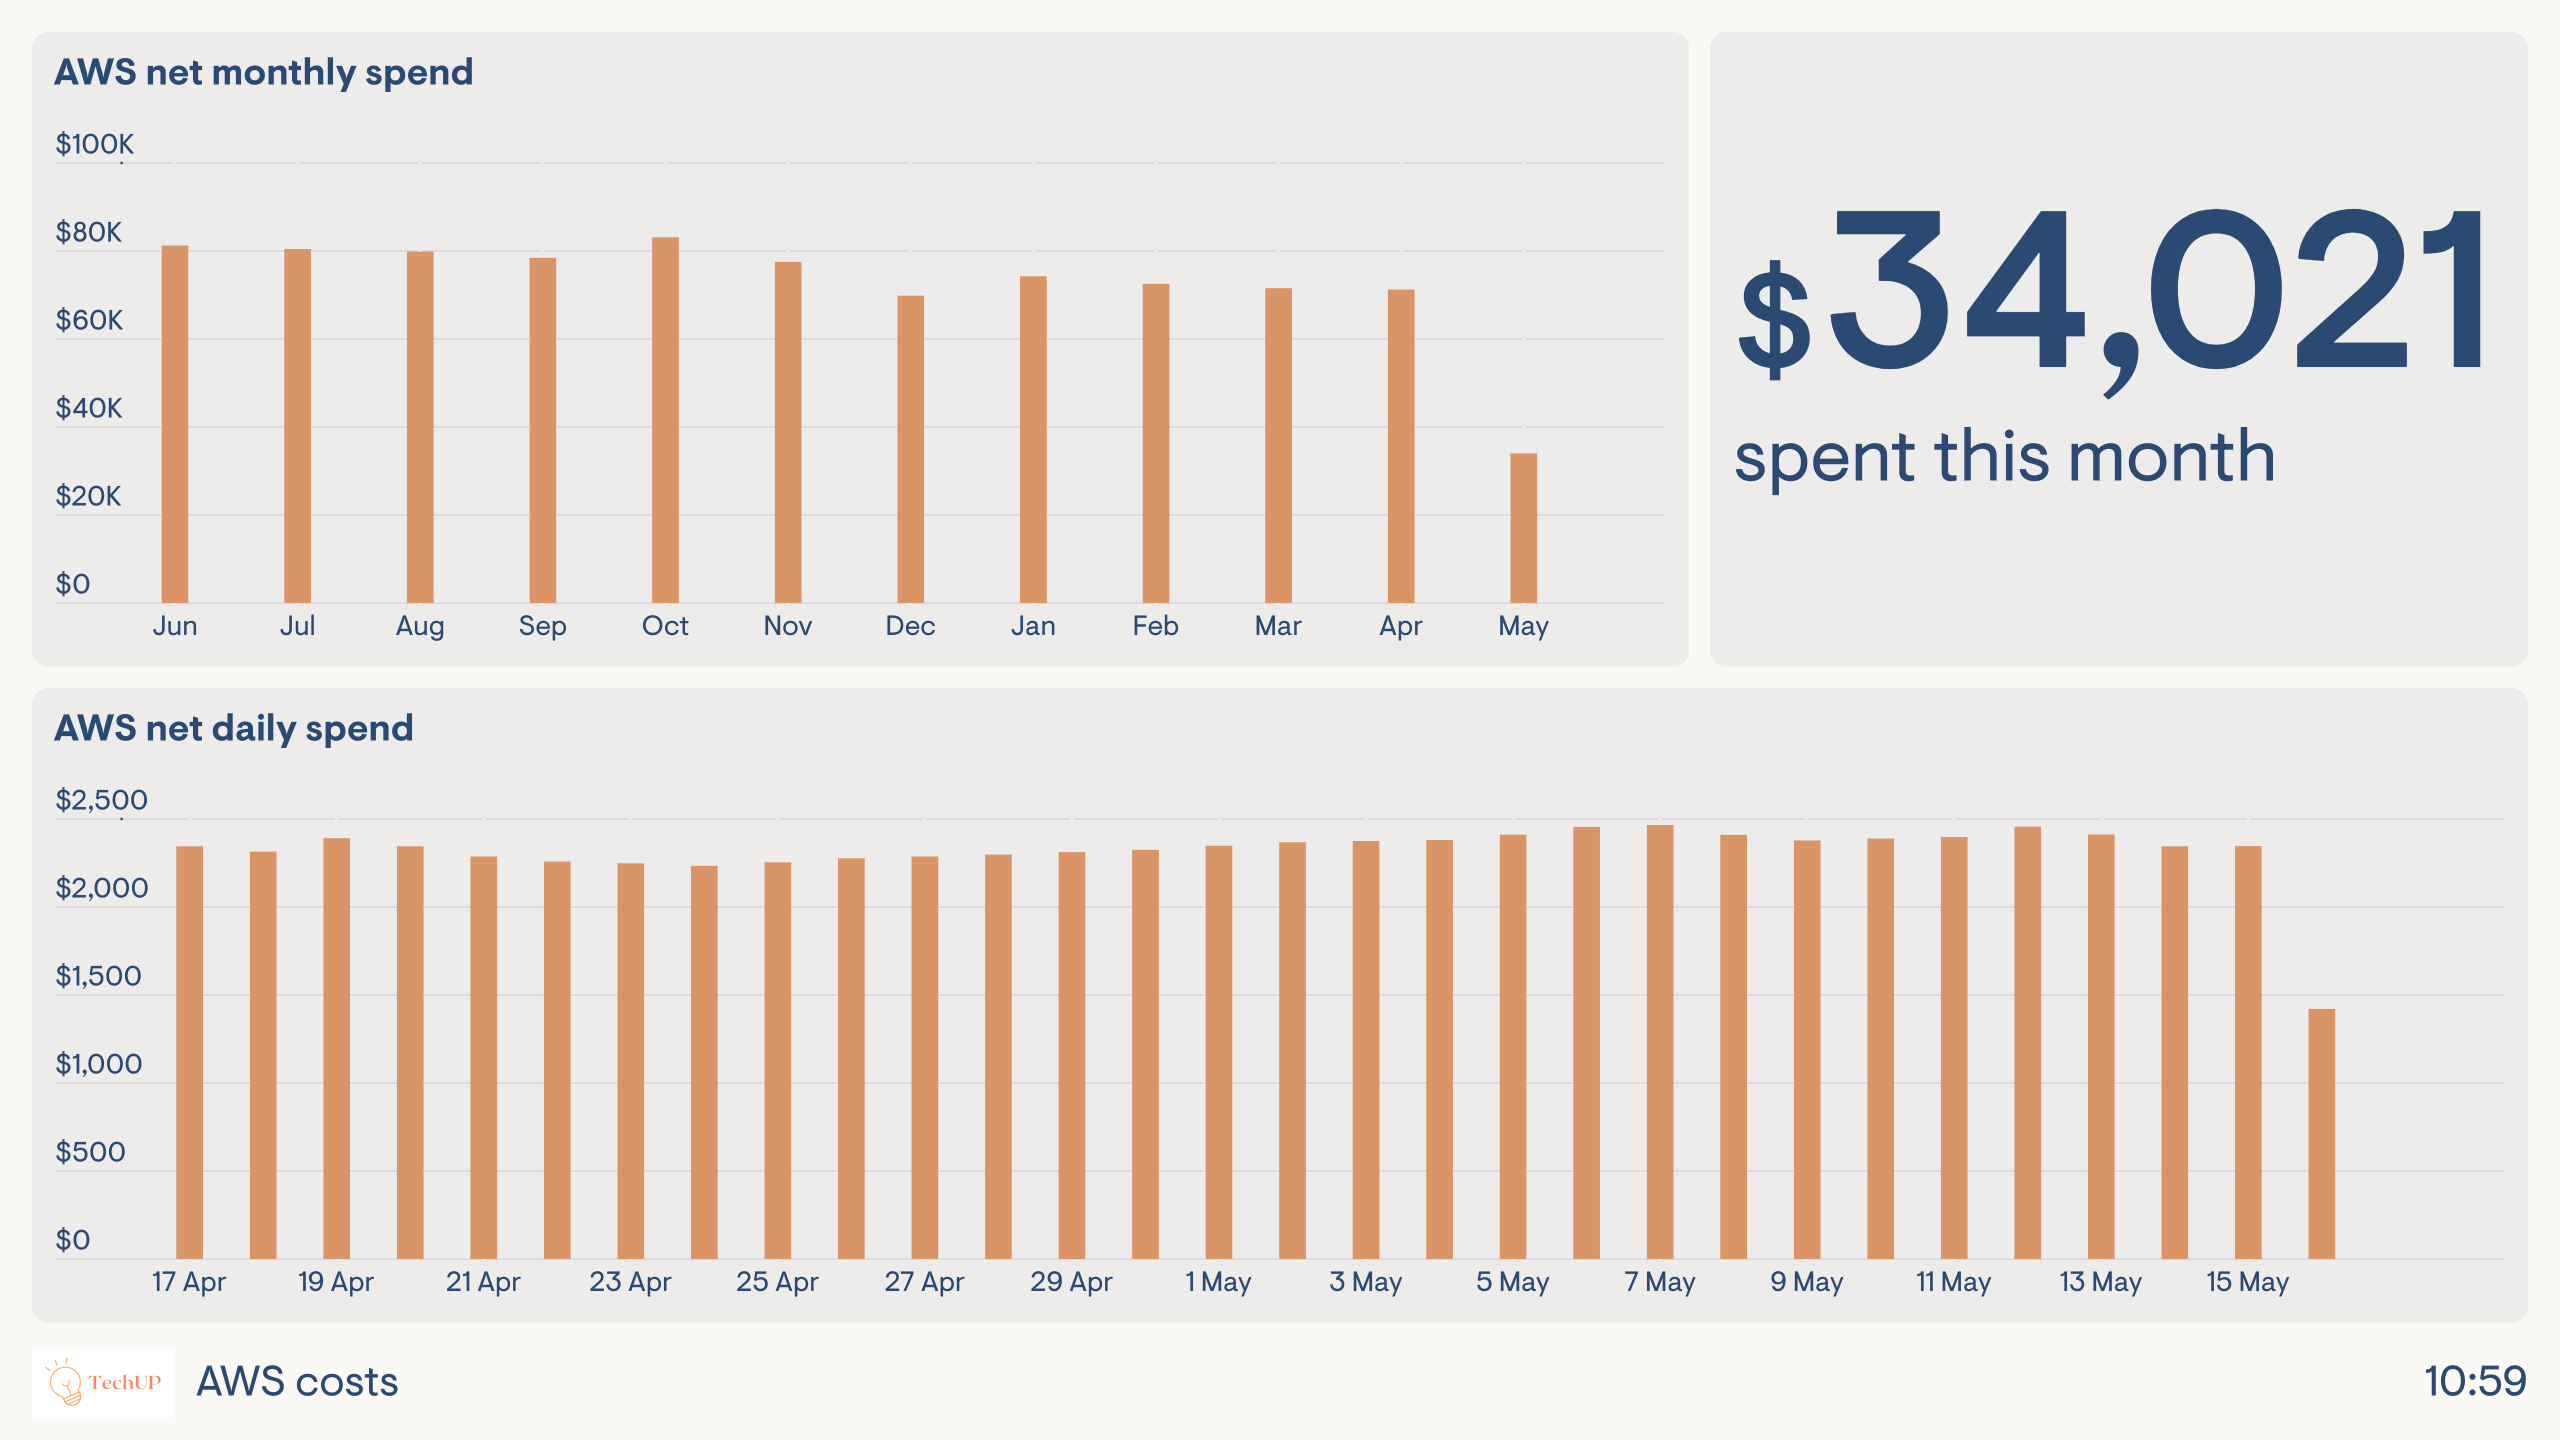
Finance
Operations
Ready to get started?
Try Geckoboard completely free for 14 days.
Chat with an expert who can answer any questions you have.